XRP Pundit Shares Why You Shouldn’t Get Tricked By The Price Rebound

bitcoinistPublicado em 2026-03-25Última atualização em 2026-03-25

Resumo

A crypto analyst, CasiTrades, warns that the recent XRP price rebound may be a temporary bounce and a potential bull trap. Despite the uptrend driven by positive macro conditions and Bitcoin's rise above $70,000, XRP has broken below a key bullish trendline, which is now acting as resistance. This break suggests the recovery could be a short-lived "subwave 2 bounce," often followed by further declines. If rejected at resistance levels of $1.40-$1.41 or $1.51-$1.55, the price could crash around 40% to major support near $0.87. The analyst concludes that unless XRP breaks and holds above $1.65 resistance, a significant downturn is likely.

Recently, the XRP price has been in an uptrend, spurred on by the improving macro political climate and the Bitcoin price crossing $70,000. But while this move has brought some much-needed positive sentiment back into the market, one analyst is calling for caution during this time. The call points to the fact that the move above $1.4 might be only temporary and that the price downtrend will resume in short succession, trapping investors in their positions.

The XRP Trendline To Watch For A Lower Break

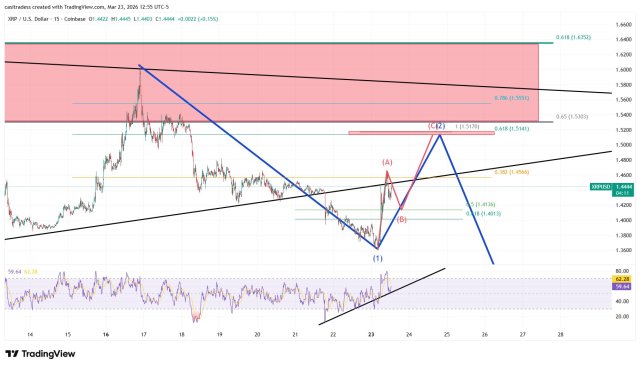
Over the last few weeks, the XRP price had formed an interesting trendline, which crypto analyst CasiTrades had called out. At a point, the XRP price was still trading above the trendline, suggesting that the trend was still very bullish. However, the digital asset has now seen its price fall below this trendline, putting it in a very perilous position.

CasiTrades explains that the price break below this trendline has seen it begin to act more like resistance at this level. If that is the case, it means that the price might not be able to break out of it, and if it is pushed down, then it could trigger another wave down.

The recent price recovery, the crypto analyst explains, could be a subwave 2 bounce. Such a bounce is historically short-lived and actually tends to give way to more declines. As a result, at the first sign of resistance, it is possible that the XRP price will be harshly rejected, triggering the next move down.
Source: X

Such a move would eventually see no support above the $1, and this would leave room for the bears to drag the price further down. In fact, the crypto analyst says that the next major support on the leg down lies around $0.87. This would constitute a 40% crash from current levels at the time of writing.

As for levels to watch, CasiTrades says to keep an eye on $1.40-$1.41 for the B wave. For the C wave, the major levels to watch are $1.51-$1.55, and these targets are for the short-term. “Either we head down to $0.87, or we somehow break and hold $1.65 resistance,” the analyst stated.

Price resumes uptrend | Source: XRPUSDT on Tradingview.com

Criptomoedas em alta

Perguntas relacionadas

QAccording to the analyst CasiTrades, what is the significance of XRP's price falling below the identified trendline?

AThe price break below the trendline suggests it has begun to act as resistance, indicating a potential failure to break out and a possible trigger for another downward wave.

QWhat does the analyst refer to as a 'subwave 2 bounce' and what is its typical outcome?

AA 'subwave 2 bounce' is a short-lived price recovery that historically tends to give way to more declines, often resulting in a harsh rejection at the first sign of resistance.

QWhat is the next major support level for XRP if the price downtrend resumes, and what percentage drop would that represent from the current price mentioned?

AThe next major support level is around $0.87, which would constitute a 40% crash from the current price levels at the time of writing.

QWhat are the two possible price targets for the short-term B wave and C wave that investors should watch, according to the analysis?

AFor the B wave, watch $1.40-$1.41. For the C wave, watch $1.51-$1.55.

QWhat two ultimate price scenarios does the analyst CasiTrades outline for XRP?

AThe two scenarios are: the price heads down to $0.87, or it breaks and holds above the $1.65 resistance level.

Leituras Relacionadas

Why Bitcoin Holds Above $64,000 After Fed's Hard Pause

**Bitcoin Stabilizes Near $64,000 Following Hawkish Fed Pause** The cryptocurrency market, led by Bitcoin, remained stable around $64,000 despite a volatile reaction to the latest U.S. Federal Reserve meeting. The Fed paused interest rates but signaled a hawkish stance, with three committee members voting for an increase—the highest dissent since 2016. This limits risk appetite but hasn't triggered panic selling. Key market highlights include Bitcoin ETFs seeing a net inflow of $32.1 million, breaking a streak of outflows, while Ethereum ETFs experienced outflows of $18.65 million. Liquidations affected about 90,000 traders. Technically, Bitcoin finds support around $63,000-$63,500, with major resistance near $66,000. While its price is about 49% below its all-time high, institutional demand via ETFs and the absence of mass capitulation support a potential recovery scenario in the second half of the year. Major altcoins showed mixed movements, with Solana attracting capital while Ethereum faced selling pressure despite strong on-chain metrics like a growing staking queue. Regulatory news took a pause as the U.S. Senate delayed the CLARITY Act vote until at least autumn. For the final trading day of July, U.S. inflation and consumer spending data will be crucial. Bitcoin's key levels to watch are $63,000 support and $66,000 resistance. Sustained ETF inflows and Bitcoin holding above $63,000 are seen as positive signs for a potential market recovery later in the year.

cryptonews.ruHá 2h

Why Bitcoin Holds Above $64,000 After Fed's Hard Pause

cryptonews.ruHá 2h

Trading

Spot

Artigos em Destaque

Como comprar T

Bem-vindo à HTX.com!Tornámos a compra de Threshold Network Token (T) simples e conveniente.Segue o nosso guia passo a passo para iniciar a tua jornada no mundo das criptos.Passo 1: cria a tua conta HTXUtiliza o teu e-mail ou número de telefone para te inscreveres numa conta gratuita na HTX.Desfruta de um processo de inscrição sem complicações e desbloqueia todas as funcionalidades.Obter a minha contaPasso 2: vai para Comprar Cripto e escolhe o teu método de pagamentoCartão de crédito/débito: usa o teu visa ou mastercard para comprar Threshold Network Token (T) instantaneamente.Saldo: usa os fundos da tua conta HTX para transacionar sem problemas.Terceiros: adicionamos métodos de pagamento populares, como Google Pay e Apple Pay, para aumentar a conveniência.P2P: transaciona diretamente com outros utilizadores na HTX.Mercado de balcão (OTC): oferecemos serviços personalizados e taxas de câmbio competitivas para os traders.Passo 3: armazena teu Threshold Network Token (T)Depois de comprar o teu Threshold Network Token (T), armazena-o na tua conta HTX.Alternativamente, podes enviá-lo para outro lugar através de transferência blockchain ou usá-lo para transacionar outras criptomoedas.Passo 4: transaciona Threshold Network Token (T)Transaciona facilmente Threshold Network Token (T) no mercado à vista da HTX.Acede simplesmente à tua conta, seleciona o teu par de trading, executa as tuas transações e monitoriza em tempo real.Oferecemos uma experiência de fácil utilização tanto para principiantes como para traders experientes.

540 Visualizações TotaisPublicado em {updateTime}Atualizado em 2026.06.02

Como comprar T

Discussões

Bem-vindo à Comunidade HTX. Aqui, pode manter-se informado sobre os mais recentes desenvolvimentos da plataforma e obter acesso a análises profissionais de mercado. As opiniões dos utilizadores sobre o preço de T (T) são apresentadas abaixo.

活动图片













