Three Consecutive Quarters of Decline: The Crypto Market is Experiencing Its Longest Ebb Since 2022

marsbitPublicado em 2026-08-03Última atualização em 2026-08-03

Resumo

The cryptocurrency market experienced its third consecutive quarterly decline in Q2 2026, marking its longest downturn since 2022, according to a CoinGecko report. The total market capitalization fell 12.6% to $2.1 trillion, a retreat of roughly 52% from its October 2025 peak. Multiple indicators signal an orderly capital exit from the sector. For the first time since Q3 2023, the total stablecoin market cap shrank (-1.6% to $305.1B), indicating funds are leaving the ecosystem entirely, not just rotating to safer crypto assets. Trading volumes on centralized exchanges dropped 27.9%, while DeFi's Total Value Locked (TVL) plummeted 23.4%. Both Bitcoin (-14.2%) and Ethereum (-25.4%) underperformed traditional risk assets like equities in Q2, breaking from previous correlative narratives. Ethereum saw its first-ever three-quarter losing streak, with its market share falling to around 10%. A few areas saw growth. Prediction market volumes surged 48.7%, largely driven by sports betting. Hyperliquid's HYPE token entered the top 10 by market cap, and tokenized collectibles platforms grew, though primarily via gamified mechanics. Despite a ~9.8% Bitcoin rebound in July, historical trends suggest caution for August. The market, now ~49% below its 2025 high, is undergoing a measured retreat. Its recovery hinges on future Federal Reserve policy and the industry's ability to develop sustainable revenue streams beyond speculation.

Author: Xiao Bing

According to the Q2 2026 cryptocurrency industry report previously released by CoinGecko, the data is grim: the total market capitalization of the crypto market fell by 12.6% in Q2, shrinking from $2.4 trillion to $2.1 trillion, hitting its lowest level since September 2024 and marking a decline of approximately 52% from the October 2025 peak. This is the third consecutive quarter of decline.

Within this 58-page report, the most noteworthy aspect is not any single number, but several trend lines all pointing in the same direction: capital is exiting the crypto market, and it's doing so in a remarkably orderly fashion.

Triple Evidence of Capital Outflows

The first piece of evidence comes from stablecoins.

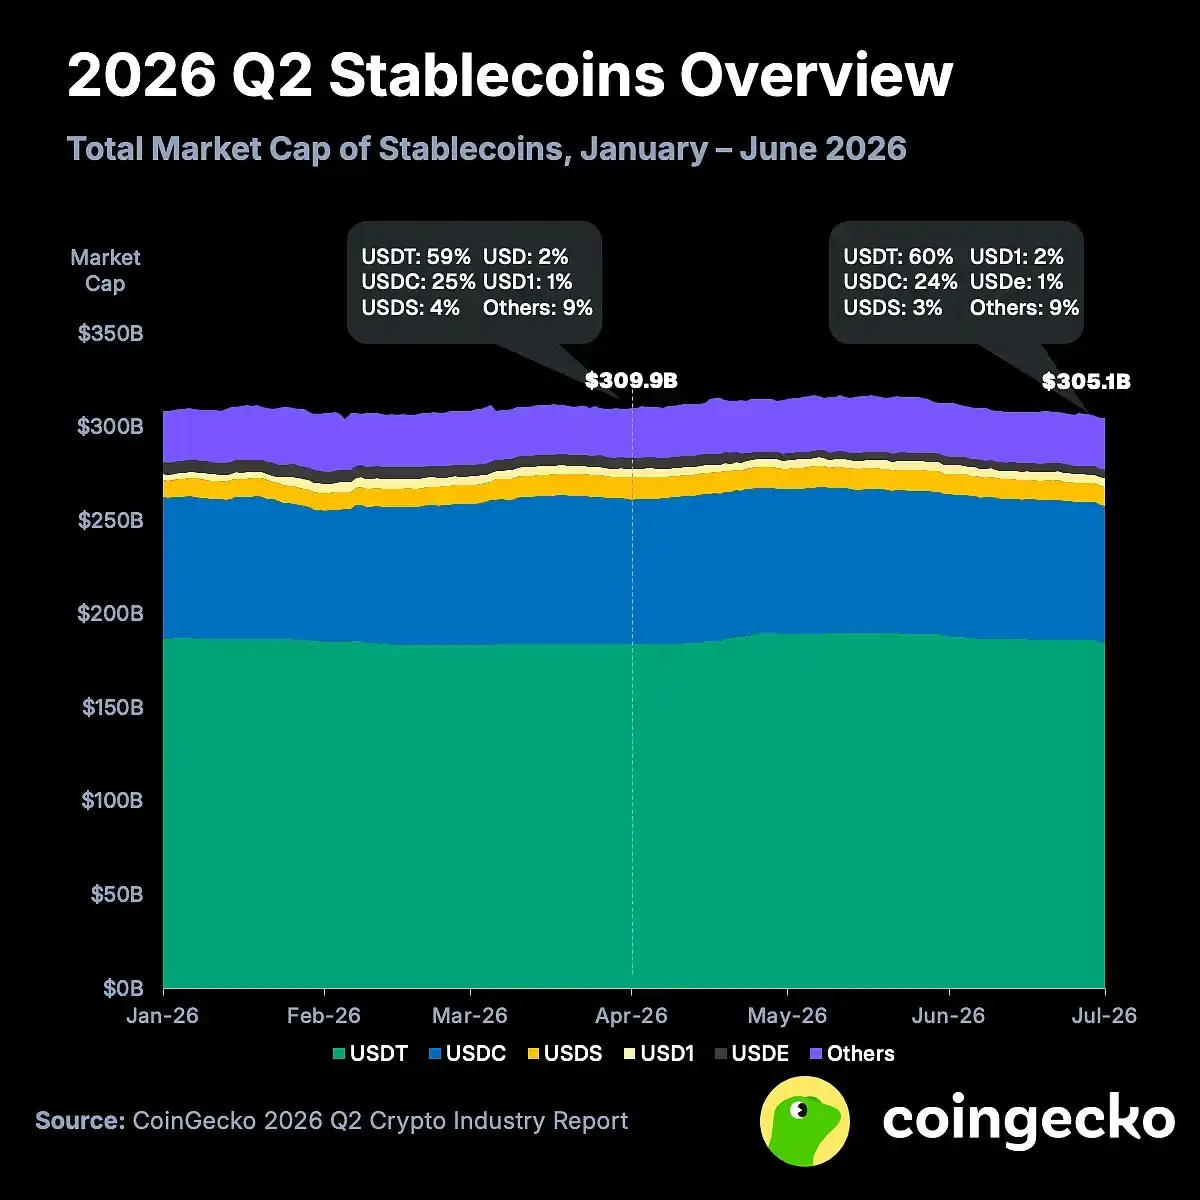
The total market cap of stablecoins declined by 1.6% to $3.051 trillion in Q2, marking the first quarterly negative growth since Q3 2023. Stablecoins are the "cash layer" of the crypto ecosystem; their shrinkage indicates that capital is no longer satisfied with retreating from risky assets to on-chain safe havens—it is directly exiting the industry.

Structural divergence is also intensifying. Tether's USDT defied the trend with a slight 0.2% increase, raising its market share to 60%, while Circle's USDC saw an outflow of $3.7 billion (-4.8%), Sky's USDS shrank by $2 billion (-16.4%), and Ethena's USDe contracted by $1.4 billion (-24.4%). This landscape indicates two things: demand for offshore dollars remains solid, but native yield-bearing stablecoins on-chain are experiencing a redemption wave, primarily because DeFi yields have fallen below the risk-free rate.
The second piece of evidence comes from trading volume.

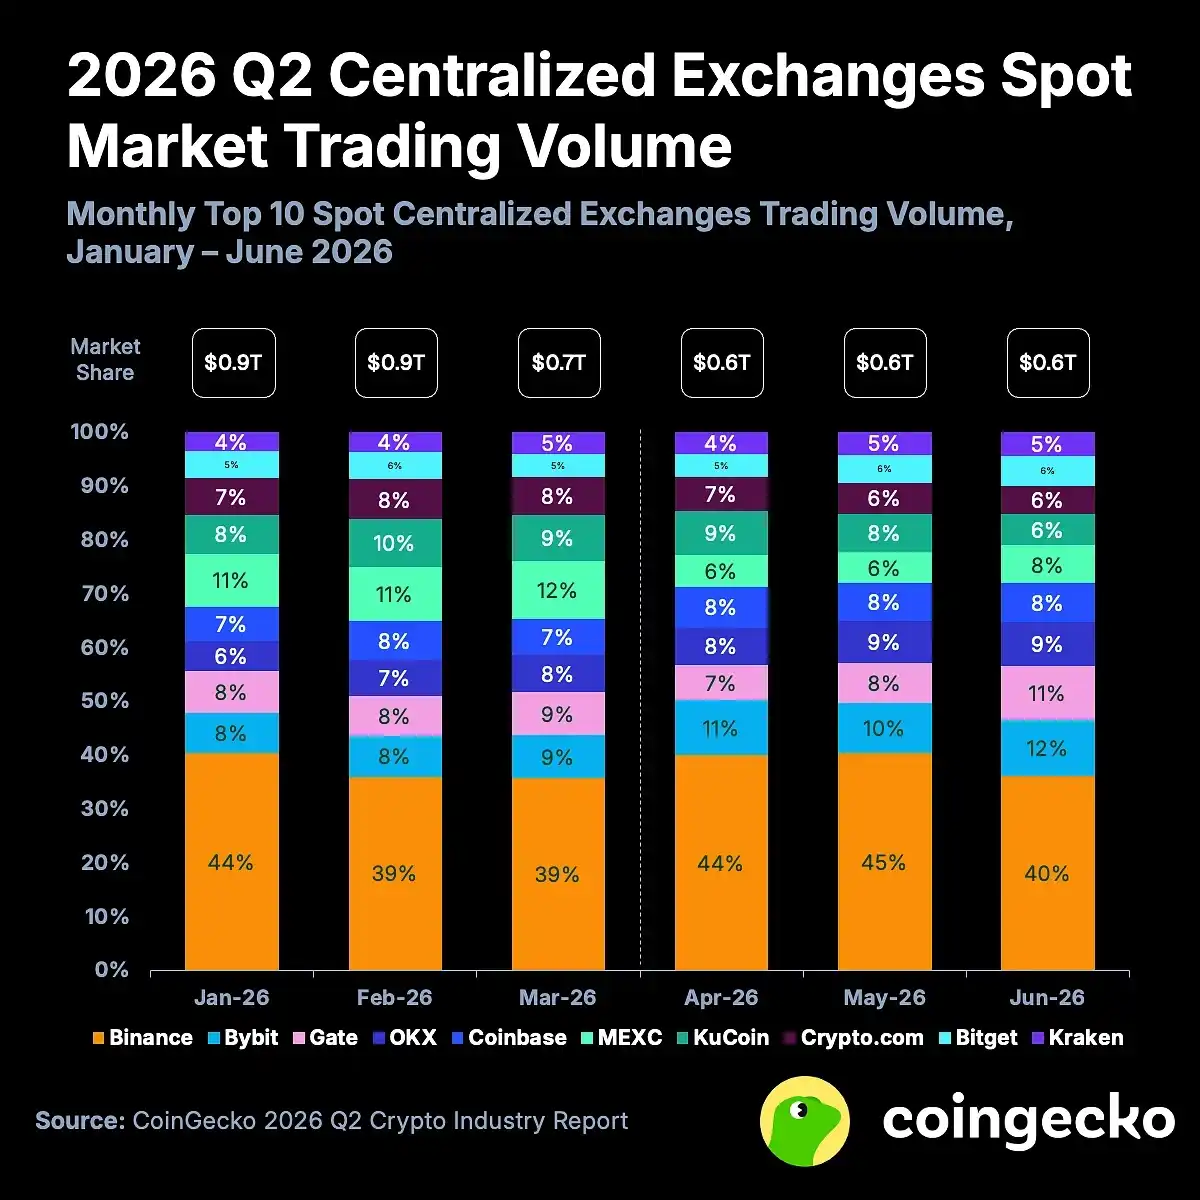
Spot trading volume on centralized exchanges fell by 27.9% to $1.95 trillion in Q2, with May's single-month volume of $619 billion being the lowest point of the year. Perpetual contract trading volume saw a relatively milder decline (-10% to $12.7 trillion), which is not good news. It suggests that speculative demand is declining slower than investment demand, indicating the market structure is becoming more fragile.
The third piece of evidence comes from DeFi.

Total Value Locked (TVL) in DeFi plummeted by 23.4% in Q2. Ethereum was hit hardest by the KelpDAO attack incident, with its TVL shrinking by 28.7% (-$15 billion) and its market share dropping to 52.9%. The decline in TVL, combined with an average 44.6% drop in on-chain transaction fees, indicates a broad contraction in on-chain economic activity.

BTC and ETH Both Lag Behind

If we only look at total market cap, a 12.6% decline is moderate within the volatility typical of crypto markets. What is truly unsettling is the divergence between crypto assets and traditional risk assets.

US stocks staged a strong rebound in Q2, while Bitcoin (-14.2%) and Ethereum (-25.4%) completely failed to keep up.

This is a significant structural signal: the narratives of "Bitcoin as digital gold/a risk asset/tech stock alternative" that prevailed over the past two years all failed simultaneously this quarter. It didn't rise with gold, didn't rise with the Nasdaq, and didn't act as a safe haven when risk aversion sentiment surged.

Ethereum's situation is worse.

Q2 marked the first time in Ethereum's history that it has declined for three consecutive quarters. While Bitcoin's dominance remains above 55%, Ethereum's share has fallen to around 10%, far below its historical average of 18%.

June was the most brutal month of the quarter. The Fed's hawkish stance, fluctuations in US-Iran tensions, and the symbolic sale of Bitcoin by MicroStrategy converged to ignite the most severe single-month decline of the year. That MicroStrategy sale involved only 32 BTC (worth about $2.5 million, or 0.0038% of its holdings), but it shattered the faith-based narrative of Michael Saylor "never selling." Subsequently, US-listed Bitcoin ETFs saw cumulative outflows of nearly $4 billion over the following 12 trading days.

A Few Bright Spots

Amid the overall shrinking market, a few corners are still growing, but the direction of this growth is thought-provoking.

Nominal trading volume in prediction markets grew by 48.7% to $113.8 billion in Q2, with a record high of $52.8 billion in June alone.
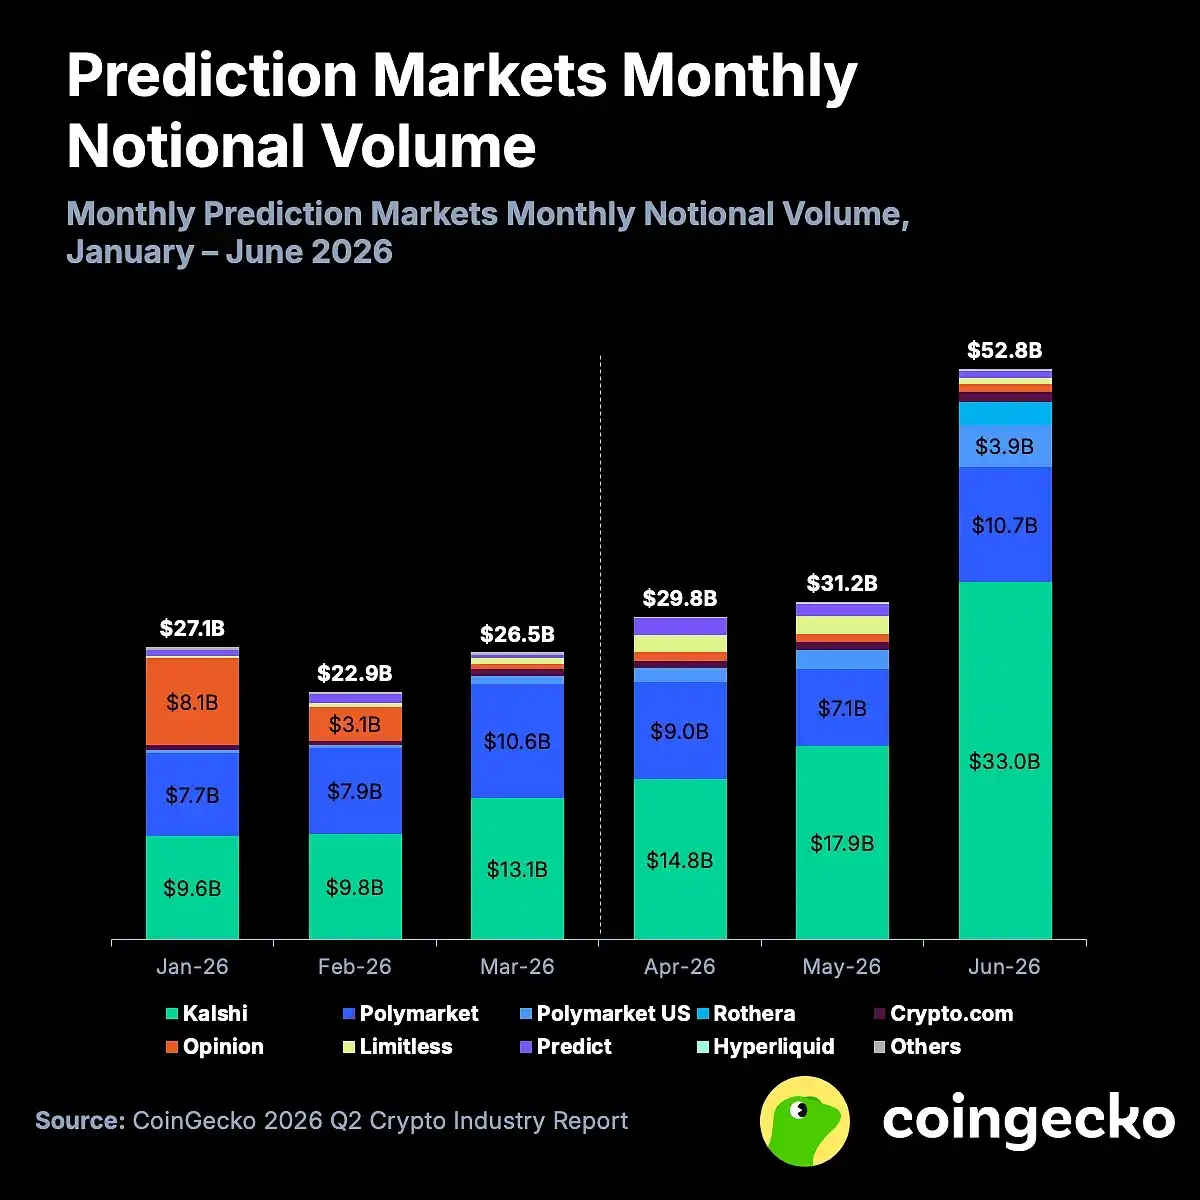
Kalshi's market share expanded from 42.4% to 58.9%, while Polymarket's share dropped from 35.8% to 30.2%. Robinhood's joint venture project with SIG, Rothera, launched in May and ranked fourth with $2.1 billion in trading volume in June. This growth was primarily driven by sporting events, with sports contracts accounting for 81% of the total volume on Polymarket by June.

Hyperliquid's HYPE token, propelled by newly launched ETFs, prediction market features, and a listing on Coinbase's protocol, broke into the top ten by market cap, standing out as a conspicuous exception among altcoins in Q2.

New players emerged in the tokenized collectibles market. Collector Crypt, with 317% monthly trading volume growth (from $97 million in January to $406 million in June), replaced Courtyard as the leader, capturing a 62.8% market share in June. However, the report also notes that over 98% of trading volume on these platforms comes from gacha-style blind box mechanisms, not genuine secondary market liquidity.

What July's Rebound Changed

The CoinGecko report covers data up to the end of June. The market has offered a partial response in July.

Bitcoin rebounded by approximately 9.8% in July, recovering from briefly falling below $58,000 at the start of the month to around $65,000, with a July high touching $67,000. However, this rebound is not encouraging in a historical context: August has seen declines in 9 of the past 12 years, with a median return of -7.49%. The 2018 script is the template most often cited for comparison: that year also saw a 21.3% rebound in July following a sharp decline, only to fall again by 9.4% in August, 6% in September, and crash completely in November.

Bitcoin's current price is around $64,000, representing a decline of approximately 49% from the October 2025 all-time high of $126,000, requiring a doubling to return to its previous peak. Whale addresses have accumulated a net increase of about 270,000 BTC over the past month, but the accumulation rate by long-term holders has slowed by 47%. ETF funds have not yet seen a large-scale return of inflows.

Overall, the crypto market is experiencing an orderly capital retreat, with no panicked crash, just a slow ebb tide. Where this tide will finally recede to depends on two things: when the Federal Reserve eases its stance, and whether this industry can find sources of real revenue beyond speculation before the next cycle arrives.


Perguntas relacionadas

QAccording to CoinGecko's Q2 2026 report, by what percentage did the total cryptocurrency market capitalization shrink, and what is the significance of this being the third consecutive quarterly decline?

AThe total cryptocurrency market capitalization shrank by 12.6% in Q2 2026, from $2.4 trillion to $2.1 trillion. The significance of this being the third consecutive quarterly decline is that it marks the longest sustained downturn since 2022, indicating a prolonged and orderly withdrawal of capital from the market rather than a sudden crash.

QWhat three key pieces of evidence from the report indicate an orderly capital exodus from the crypto market?

AThe three key pieces of evidence are: 1) The total stablecoin market cap fell for the first time since Q3 2023, declining 1.6% to $305.1B, indicating direct withdrawals. 2) Spot trading volume on centralized exchanges dropped by 27.9%. 3) Total Value Locked (TVL) in DeFi plummeted by 23.4%, and average on-chain transaction fees fell by 44.6%, showing a contraction in economic activity.

QHow did the performance of Bitcoin and Ethereum in Q2 2026 deviate from traditional risk assets like US stocks, and what does this signal?

AWhile US stocks rallied strongly in Q2 2026, Bitcoin fell 14.2% and Ethereum fell 25.4%. This signals that the narratives of Bitcoin as a 'digital gold,' risk asset, or tech stock alternative simultaneously failed, as it did not move in correlation with gold, the Nasdaq, or act as a safe haven.

QDespite the overall market decline, which specific sectors saw growth in Q2 2026, and what was a notable characteristic of that growth?

AThe prediction markets sector saw growth, with nominal trading volume increasing 48.7% to $113.8B. A notable characteristic is that by June, sports-related contracts accounted for 81% of the volume on platforms like Polymarket, and the growth of new platforms like Collector Crypt in tokenized collectibles was largely driven (over 98%) by 'gacha'-style blind box mechanisms, not genuine secondary market liquidity.

QWhat are the two key factors identified in the article that will determine when the crypto market downturn stops?

AThe two key factors are: 1) When the U.S. Federal Reserve changes its tight monetary policy ('when the Fed loosens its grip'). 2) Whether the industry can find real sources of revenue beyond speculation before the next market cycle arrives.

Leituras Relacionadas

On the Eve of Circle's Earnings Report, Wall Street Shows Major Divergence in CRCL Valuation

On the eve of Circle (CRCL) releasing its quarterly earnings report, Wall Street analysts are deeply divided over the company's valuation. Morgan Stanley downgraded Circle from "Equal Weight" to "Underweight," slashing its price target from $106 to $38. Analyst James Faucette argues the market overestimates the growth potential of Circle's core USDC stablecoin, noting its circulation hasn't increased since Q3 2025 and new use cases beyond remittances and card spending are limited. He warns that slowing USDC growth could pressure the crucial "reserve income" and shift revenue toward lower-margin transaction fees. In stark contrast, TD Cowen initiated coverage with a "Buy" rating and an $82 price target. Analyst Bryan Bergin believes the market underestimates Circle's potential to evolve from a stablecoin issuer into a broader digital financial infrastructure platform. He forecasts a ~31% annual growth rate for USDC through 2030 and expects faster growth in fee-based revenue from services like payments, RWA tokenization, and its Arc network. A key external factor adding uncertainty is the stalled progress of the CLARITY Act in the US Senate, whose delay could dampen institutional adoption expectations for stablecoins. The core disagreement lies in whether Circle's future hinges on USDC circulation growth or a successful platform-based transformation. The upcoming earnings report is keenly awaited for insights into reserve income trends and the progress of newer business verticals.

marsbitHá 7m

On the Eve of Circle's Earnings Report, Wall Street Shows Major Divergence in CRCL Valuation

marsbitHá 7m

Hong Kong Stock Market in July: Super IPOs Coexist with Wave of Breakings, Hard Tech Still the Main Theme

The Hong Kong IPO market in July presented a "two-tiered" scenario characterized by both a mega-IPO and a significant wave of new stock listings falling below their issue price ("breaking issue"). The highlight was Zhongji Innolight's (stock code: 03308.HK) listing on July 30, which raised approximately HK$53.41 billion. This marked the largest IPO on the Hong Kong exchange in nearly seven years since Alibaba's secondary listing. A prominent trend was the continued dominance of A+H listings, with companies like Luxshare (02475.HK) and others contributing significantly to the total monthly fundraising of around HK$116 billion. In stark contrast, the market saw a sharp rise in "broken issues." Out of 17 new listings for the month, 7 broke issue on their debut, with the rate climbing to 47% by month-end. Factors contributing to this included an intense concentration of listings (15 in one week), profit-taking by investors, and a market reassessment of valuations, particularly for companies with unclear commercial prospects. Despite the sell-off, hard tech remained the core theme, accounting for over 70% of July's listings. Key sectors were semiconductors and AI/autonomous driving. However, market enthusiasm became highly selective, with extreme over-subscription for certain niche players while others were heavily sold off. This signals a shift from speculative fervor towards a more value-driven assessment. Looking ahead, recent listing reforms by the Hong Kong Exchanges are expected to attract more tech firms. With a large pipeline of over 350 companies awaiting listing, including potential large offerings like SHEIN, the market is poised for continued activity. Analysts view July's correction not as a downturn but as a healthy valuation reset, emphasizing the need for investors to carefully discern company fundamentals.

marsbitHá 9m

Hong Kong Stock Market in July: Super IPOs Coexist with Wave of Breakings, Hard Tech Still the Main Theme

marsbitHá 9m

Wall Street Shows Sharp Divergence in CRCL Valuation on the Eve of Circle's Earnings Report

On the eve of its earnings report on August 5th, significant divergence emerged on Wall Street regarding the valuation of Circle (CRCL). Morgan Stanley downgraded Circle from "Equal Weight" to "Underweight," slashing its target price from $106 to $38. Analyst James Faucette argues that the market has overestimated the growth potential of USDC, noting stagnant circulation since Q3 2025 and a lack of major new use cases beyond remittances and card spending. He warns that slower USDC growth could pressure Circle's core "reserve income" and shift its revenue mix toward lower-margin transaction fees, making current valuations excessive. In contrast, TD Cowen initiated coverage with a "Buy" rating and an $82 target price. Analyst Bryan Bergin believes the market underestimates Circle's potential to evolve from a stablecoin issuer into a broader digital financial infrastructure platform. He focuses on future services like payments, asset management, RWA tokenization, and blockchain infrastructure, forecasting a ~31% CAGR for USDC circulation through 2030 and faster growth in fee-based revenues. A key external variable is the delayed progress of the CLARITY Act, whose uncertainty may pressure market sentiment by slowing regulatory clarity for stablecoins. Ultimately, the split centers on whether Circle's value hinges on USDC growth or its platform transformation. The upcoming earnings report will be scrutinized for details on reserve income, payment services, and RWA initiatives.

Odaily星球日报Há 12m

Wall Street Shows Sharp Divergence in CRCL Valuation on the Eve of Circle's Earnings Report

Odaily星球日报Há 12m

July Security Report: Total Losses Approximately $97 Million, Cross-Chain Bridge Attacks Concentrated with Over $35 Million

In July 2026, the cryptocurrency sector suffered total losses of approximately $97 million, with hacker attacks and contract vulnerabilities accounting for about $94 million. A significant trend was the shift in attack vectors from smart contract code to off-chain infrastructure, signature key leaks, and governance manipulation. Major incidents included: * **Ostium ($23.75M loss):** An attacker gained access to its off-chain price oracle signing system, manipulated BTC prices, and drained funds. * **AFX Trade Bridge ($24.15M loss):** The private validator key for its cross-chain bridge was compromised, allowing unauthorized withdrawals. * **BonkDAO ($20M loss):** An attacker acquired enough tokens to pass a malicious governance proposal and drain the treasury, exploiting low voting thresholds. * **Bonzo Lend ($9.05M loss):** A third-party oracle provider's signature verification was exploited to inject manipulated token prices. * **Verus Bridge ($7.55M loss):** A repeat attack exploiting the same unpatched bridge vulnerability. * **B2 Network ($3.86M loss):** An attacker seized the upgrade authority for a staking contract. Cross-chain bridges remained a prime target, with concentrated attacks causing over $35 million in losses. Phishing scams resulted in roughly $3 million in losses, employing sophisticated methods like fake mobile apps and physical counterfeit letters targeting Ledger users. Key takeaways are the acceleration of attacks on off-chain infrastructure, the persistent vulnerability of cross-chain bridges, and the rising prominence of governance-layer exploits. Recommendations include enhancing off-chain key management with multi-sig security, implementing stricter governance controls, and increasing user vigilance against phishing.

marsbitHá 47m

July Security Report: Total Losses Approximately $97 Million, Cross-Chain Bridge Attacks Concentrated with Over $35 Million

marsbitHá 47m

Trading

Spot
活动图片