Written by: Four Pillars(@FourPillarsFP)
Compiled by: AididiaoJP, Foresight News
Key Takeaways
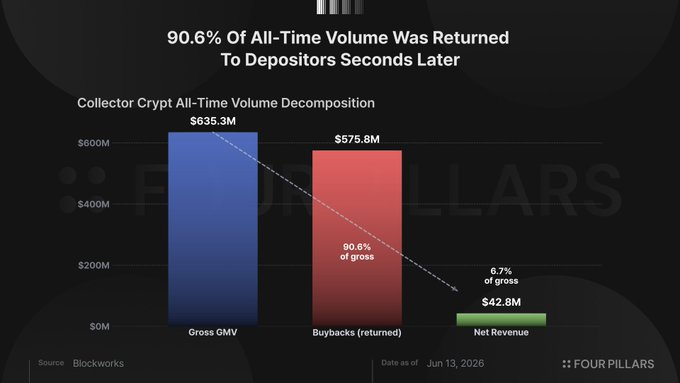
- Collector Crypt (CC) has generated cumulative total revenue of $635 million, with 90.6% returned to users via instant card buybacks, resulting in net revenue of only $43 million and a retention rate of 6.7%.
- Total secondary trading volume across all channels is less than $5 million, with eBay's share dropping from 1.23% to 0.10% (declining for six consecutive quarters).
- Total token value capture (burn + buyback) amounts to only $1.4 million, representing 3.4% of net revenue, while operational wallets have off-ramped $45.7 million USDC.
- As volume tripled, shifting towards higher-tier card packs, the net profit margin was halved from 11.2% to 5.8%. Each step up in price tier further drags down the blended margin.
- The current ~$535M FDV represents a 7.3x multiple of net revenue for what is essentially a "casino" with continuously compressing margins, only about 420 daily active players, a 20.5% free float, and 72% of insider supply locked until November 2027.
Introduction
You deposit $1000 into Collector Crypt, open a Grail pack, and receive a tokenized Pokémon card valued by the platform at $1015. It looks like you've profited. Turbo mode automatically kicks in, selling the card back to the protocol at a 93% buyback rate, and $944 is instantly credited to you. The entire cycle takes just seconds.
This cycle is rapidly repeated by hundreds of wallets, generating $635 million in volume and creating a ~$535 million FDV for the CARDS token. This article will dissect the composition of this volume, whether the collector economy priced into the token is materializing, and how much of the revenue actually flows to the token.
Note: Collector Crypt (CC) is an on-chain gacha (loot box / blind box) platform that combines physical collectible cards (primarily graded cards like Pokémon and sports cards) with NFTs. Users deposit USDC to purchase random card packs at different price points ($25 ~ $2500+), opening them to receive an NFT card backed by a physical, graded card. The platform offers 85%~93% instant buybacks (Turbo mode is enabled by default), allowing users to sell the card back to the platform for USDC within seconds, creating a fast loop.
What is this $635 Million Really?
90.6% of the cumulative volume is returned to users within seconds
CC's core product is a gacha machine. Users deposit USDC, buy random card packs ($25 to $2500, with a $5000 tier in the API not yet public), and receive a card NFT backed by a physical, graded card. Each card has an "insured value," and the platform offers 85%–93% instant buybacks.
The buyback is the default behavior, not the exception. In all 33 machine configurations within CC's API, `turboMode: true` is enabled. Cards are automatically sold back to the protocol, and users receive USDC minus the spread within seconds.
According to Blockworks daily data up to June 13, cumulative revenue is $635 million, of which $576 million was returned to users as card buybacks, resulting in net revenue of $43 million and a retention rate of 6.7%. Here, "buyback" does not refer to token buybacks but to the platform repurchasing the cards it just sold, recycling the same deposit into the next pull.
On the ATH day, June 11, the machine processed $10.6 million in volume, retained $881,000, for a retention rate of 8.3%.
The DeFiLlama adapter source code confirms this breakdown: `dailyFees = pack_purchases + royalties - buybacks`. That is, the ~$52 million annualized fees on the dashboard are already net of buybacks. `dailyVolume = pack_purchases`, representing gross spending before the recycling, which is the number displayed on protocol volume leaderboards.
Volume is highly concentrated among dozens of wallets
Blockworks counts 23,333 cumulative users. In May 2026, the platform had about 420 daily active users, with a daily average volume of $3.3 million, meaning approximately $7,800 per user per day. Even if 400 of those 420 users each spent $1000 daily, the remaining 20 wallets would still contribute $2.9 million, accounting for 87% of the total. Such extreme concentration is a mathematical inevitability given the averages.
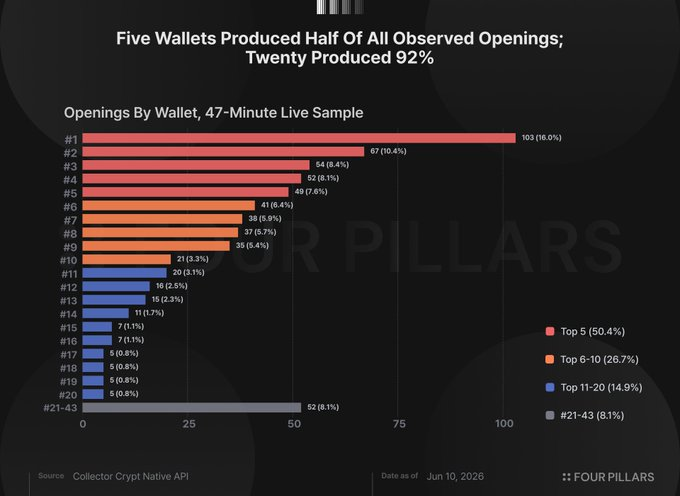
Actual activity corroborates this. We polled CC's public winning API 20 times over a 47-minute window on June 10, deduplicated by NFT address. The sample included 645 pack openings from 43 wallets. The top 5 wallets contributed 50.4% of openings, the top 10 contributed 77.1%, and the top 20 contributed 91.9%. The single most active wallet contributed 103 openings, accounting for 16% of the total.
This is just a 47-minute snapshot, not the full distribution. But both the averages and the sample point in the same direction: this $635 million is a casino with a 6.7% retention rate, fed at industrial speeds by a few dozen high-frequency players.
The Collector Market Has Not Arrived
The Bull Case
The strongest bull case deserves stating: the buyback loop is the product itself. The act of pulling is the entertainment. An 85%–93% return rate means users lose slowly, while instant liquidity against the vault's physical cards is a product innovation. As consumer design, this is defensible.
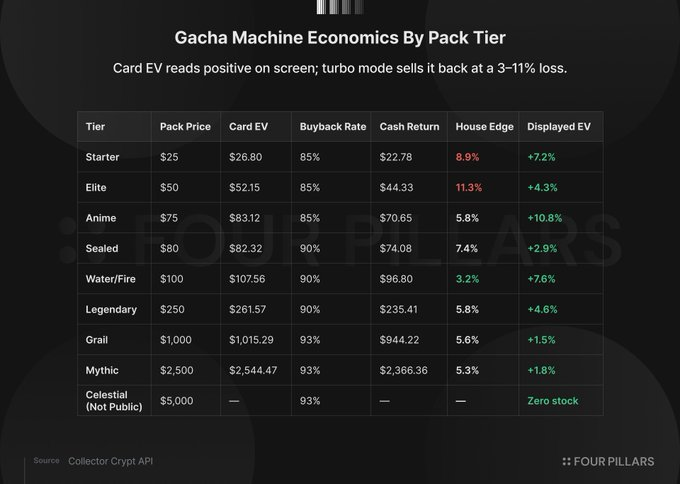
But the machine configuration reveals the direction of design optimization. CC independently controls two variables: the insured value assigned to cards and the buyback rate at which turbo mode automatically resells. Tier ranges and vault inventory are configured so that the probability-weighted expected card value exceeds the pack price. The buyback rate then discounts this value to below the price.
For example, a $1000 Grail pack shows an expected card value of $1015. The user sees a +1.5% proposition. Turbo mode activates at a 93% buyback rate, returning $944 cash. The card EV is higher than the pack price, the pack price is higher than the cash return. The user compares the former, while the platform profits from the latter. All tiers share the same structure, achieving an edge ranging from 3.2% to 11.2%.
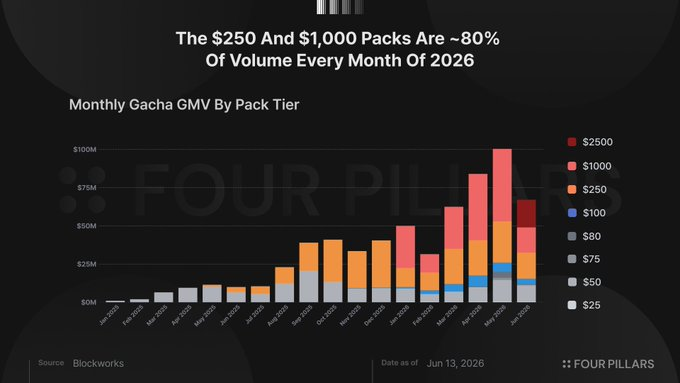
The spending structure confirms the user type. Monthly in 2026, the $250 and $1000 tiers accounted for about 80% of volume (79.4% in Jan, 80.6% in Mar, 79.4% in Apr). Collectors buy specific cards at specific prices to complete specific sets. A distribution dominated by $1000 random packs is a distribution of high-stakes players.
Secondary Trading Below 1%, eBay Share Down 12x
If collectors used the platform, they would trade with each other, and cards would flow into the broader market. CC data tracks both, and both are near zero.
On-platform, cumulative marketplace royalties total $133,000. Of the $6.9 million lifetime marketplace volume, only $823,000 was real peer-to-peer trading, the rest being buyback flows and V1 legacy volume.
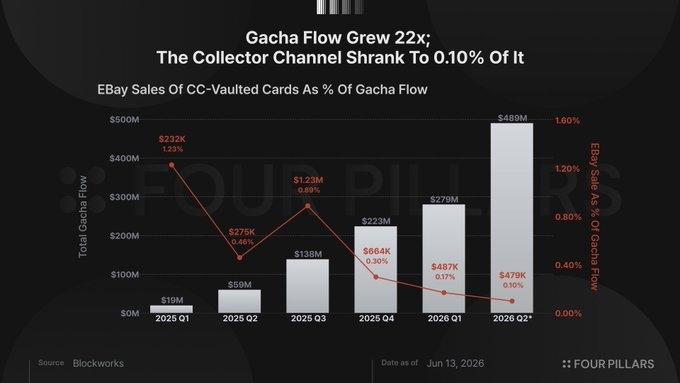
Off-platform, Blockworks tracks eBay sales of cards from CC's vault. The cumulative total is $3.4 million, but the trend is the key finding. As a percentage of gacha flow, eBay was 1.23% in Q1 2025, 0.46% in Q2, 0.89% in Q3, 0.30% in Q4, 0.17% in Q1 2026, and 0.10% in Q2 2026. Over the same period, gacha volume grew about 25x. The absolute value of the collector channel barely moved, while its share plummeted 12x.
Of the $635 million in card value generated by the platform, only $18.5 million worth has been redeemed for physical cards, a 2.9% share. The remaining 97% was sold back to the protocol via automatic buyback, most within seconds.
Combining all channels (eBay + peer-to-peer marketplace trades), real secondary activity totals less than $5 million, against $635 million in gacha throughput. The standard bull rebuttal is "it's early," but the quarterly eBay series answers that. The platform is not on an early trajectory toward collector behavior; it has been clearly moving away from that model for six consecutive quarters.
Turbo mode eliminates the dwell time on which collector platforms monetize—browsing, comparing, set building—the time that builds secondary markets. The design optimizes for loop speed, not discovery. These are two different products.
Token Utility
CC's revenue flows through three layers. Users deposit USDC to buy gacha packs, receive random card NFTs, and in almost all cases automatically sell them back at an 85%–93% buyback rate. The platform keeps the 7%–15% spread as net revenue. Minor revenue lines include a 2% royalty on marketplace trades and a 2% fee when users redeem NFTs for physical cards. All net revenue flows into an operational treasury, used for card inventory purchases, USDC off-ramping, and a small token buyback program starting June 2026.
Volume Triples, Margins Halved
According to Blockworks daily data, in Q3 2025, gross volume was $75 million with an 11.2% net margin; Q4 was $116.3 million with a 5.7% margin; Q1 2026 was $145.9 million with a 5.9% margin; Q2 (through June 13) was $256 million with a 5.8% margin.
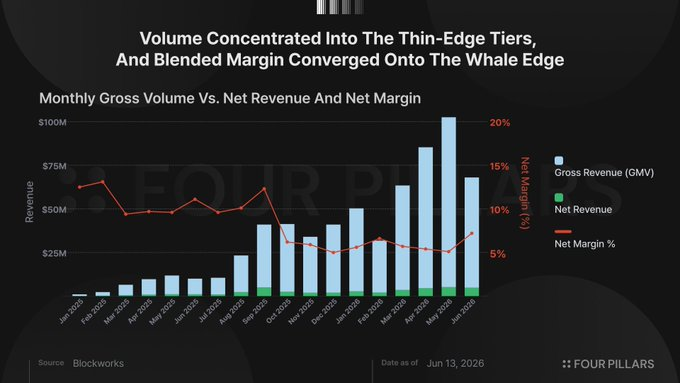
The compression is structural. The thinnest margins are where the volume is largest—around 5% for $250 and $1000 packs, compared to 9%–11% for $25 and $50 tiers, because high-volume players won't cycle six-figure sums at an 11% spread. As volume concentrates towards higher tiers, the blended margin converges to the high-tier edge. The marginal dollar of growth comes from the players from whom the platform retains the least.
The $2500 Mythic pack launched on June 10 has a 6.4% margin. A $5000 Celestial pack already exists in the API (with zero inventory). Each step up in price tier continues to grow gross volume while pulling the blended margin towards the lower bound of the higher tier.
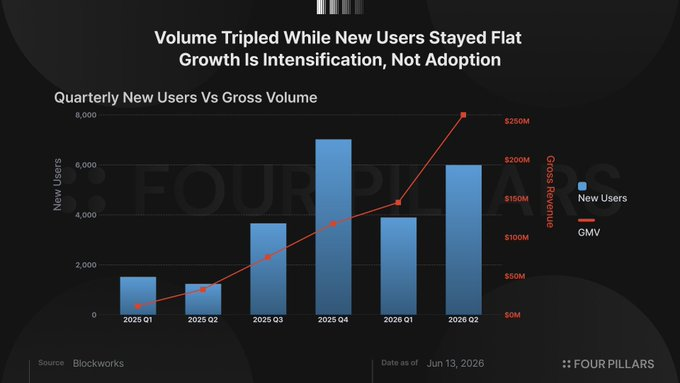
User data confirms that growth is intensification, not expansion of adoption. New users over the past four quarters were 3,668, 7,013, 3,886, and 5,982 (Q2 through June 13), roughly flat, while volume more than tripled. In May 2026, there were 2,593 new users, but daily active users rose from about 280 in April to 420 in May. Most new users churn within days.
Token Value Capture: $55.9K Burned + $887K Buybacks
Since launch, 294,203 CARDS tokens have been burned, representing 0.015% of the supply, worth about $55,900 over 9.5 months. CC's documentation does not specify the mechanism triggering burns. The declining trend coincides with the collapse in marketplace activity. In May 2026, 372 tokens were burned, and in June, 21 tokens worth $4 were burned.
On June 13, Lukas Ruppert of Maelstrom published on-chain evidence linking token purchases to wallets associated with CC's operational infrastructure. Ruppert traced from CC's known operational hub (DFEst) to a DCA bot via Kraken and identified associated wallets with pack opening history. He didn't fully confirm team control but wrote, "If these wallets are indeed controlled by the team, the significance extends far beyond the purchases themselves." The circumstantial evidence is strong.
The on-chain trail shows two events. On May 12, the CARDS Aggregator wallet paid $500,000 via Fireblocks custody to pre-seed investor GSR for 4,045,013 CARDS, at ~$0.124 per token. Then, on June 10 and 11, a newly created wallet funded via Kraken began market buying CARDS through a DCA bot, with two parallel streams of ~$625 and ~$587 every 2–6 minutes. By June 12, the bot had deployed $159,000, accumulating 599,104 CARDS, with $728,000 in remaining budget.
Calculating all forms of token value capture: Burns ($55.9K), GSR settlement ($500K), full DCA budget including undeployed funds ($887K), totals $1.4 million, representing 3.4% of the platform's cumulative $43 million net revenue. At the Q2 current annualized run rate of ~$73 million, the entire DCA budget equals 1.2% of one year's net revenue.
Wallets identified by Ruppert as CC's operational hub have off-ramped $45.7 million USDC, with $8.5 million since May 2026. Regardless of who controls these wallets, the disproportion is noteworthy: $1.4 million toward the token, $45.7 million away from it. The buybacks may be the start of sustained value capture, but simultaneously, there is nothing on-chain, automated, or committed about the program; it could stop tomorrow.
At a 5.8% net margin, materially increasing token buybacks is a zero-sum game with operational wallet income. The buyback rate (85%–93%) determines the player's cost per spin; lowering it would bleed volume, so the total margin pool is bounded by player tolerance. Within this margin, token buybacks and operational off-ramps compete for the same funds.
Even taken at face value, annualizing the Q2 run rate at ~$73 million, the ~$535 million FDV represents a 7.3x multiple of net revenue for a casino with continuously compressing margins, about 420 players per day, and a highly concentrated revenue base (a single wallet exiting could move daily volume by double-digit percentages).
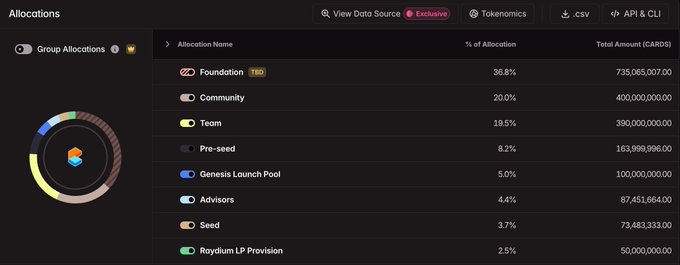
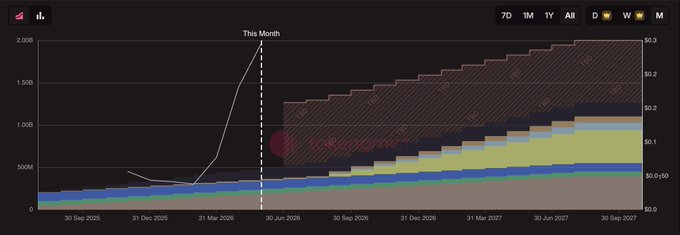
The ~$110 million circulating market cap reflects a 20.5% free float, with 410 million of the 2 billion total supply circulating. The remaining 79.5% is locked according to a public schedule until November 2027, with the next unlock on June 29 releasing 28.84 million tokens across four allocations. Insider allocations constitute 72% of the supply (Foundation 36.75%, Team 19.5%, Pre-Seed 8.2%, Advisors 4.37%, Seed 3.67%), with Community at 20%, Genesis Launch Pool 5%, and Raydium LP 2.5%.
Conclusion
CC has built a product that puts physical cards in a vault and found product-market fit with a handful of high-speed gamblers. Our view would change if marketplace royalties shifted towards real peer-to-peer trading, if the eBay share reversed its six-quarter decline, or if the buyback program scaled beyond 3.4% of net revenue. None of these are currently visible.
What is currently visible: Total token value capture of $1.4 million, 3.4% of cumulative net revenue, against a $110 million market cap ($535 million FDV); $45.7 million off-ramped from operational wallets within the same infrastructure, alongside $887,000 in buybacks; the collector channel shrinking every quarter since launch; and a 20.5% free float atop insider allocations constituting 72% of the supply, locked until November 2027.