Solana flashes buy signal, but key resistance levels keep recovery in check

ambcryptoPublicado em 2026-07-15Última atualização em 2026-07-15

Resumo

Crypto trading volumes have been declining since July 2024, hitting their lowest two-year average, indicating weak demand and low market confidence. This thin liquidity can lead to sharp price moves. Against this backdrop, analyst Ali Martinez notes that Solana (SOL) has flashed a bullish buy signal on the 3-day chart using the SuperTrend indicator, with key levels to watch at $96 and $121. Furthermore, long-term holder data shows consistent accumulation throughout 2026. However, SOL's broader price structure remains bearish, having broken previous swing lows. Key resistance levels from Fibonacci analysis are at $83.79 and $90.22, with the $116 realized price level posing a major overhead supply hurdle. Recent large on-chain token movements, such as a $15.14 million transfer from Alameda Research, have also contributed to selling pressure and liquidations. In summary, while recent signals and holder activity offer a bullish near-term case, significant resistance levels and weak market-wide capital flows continue to challenge a sustained SOL recovery.

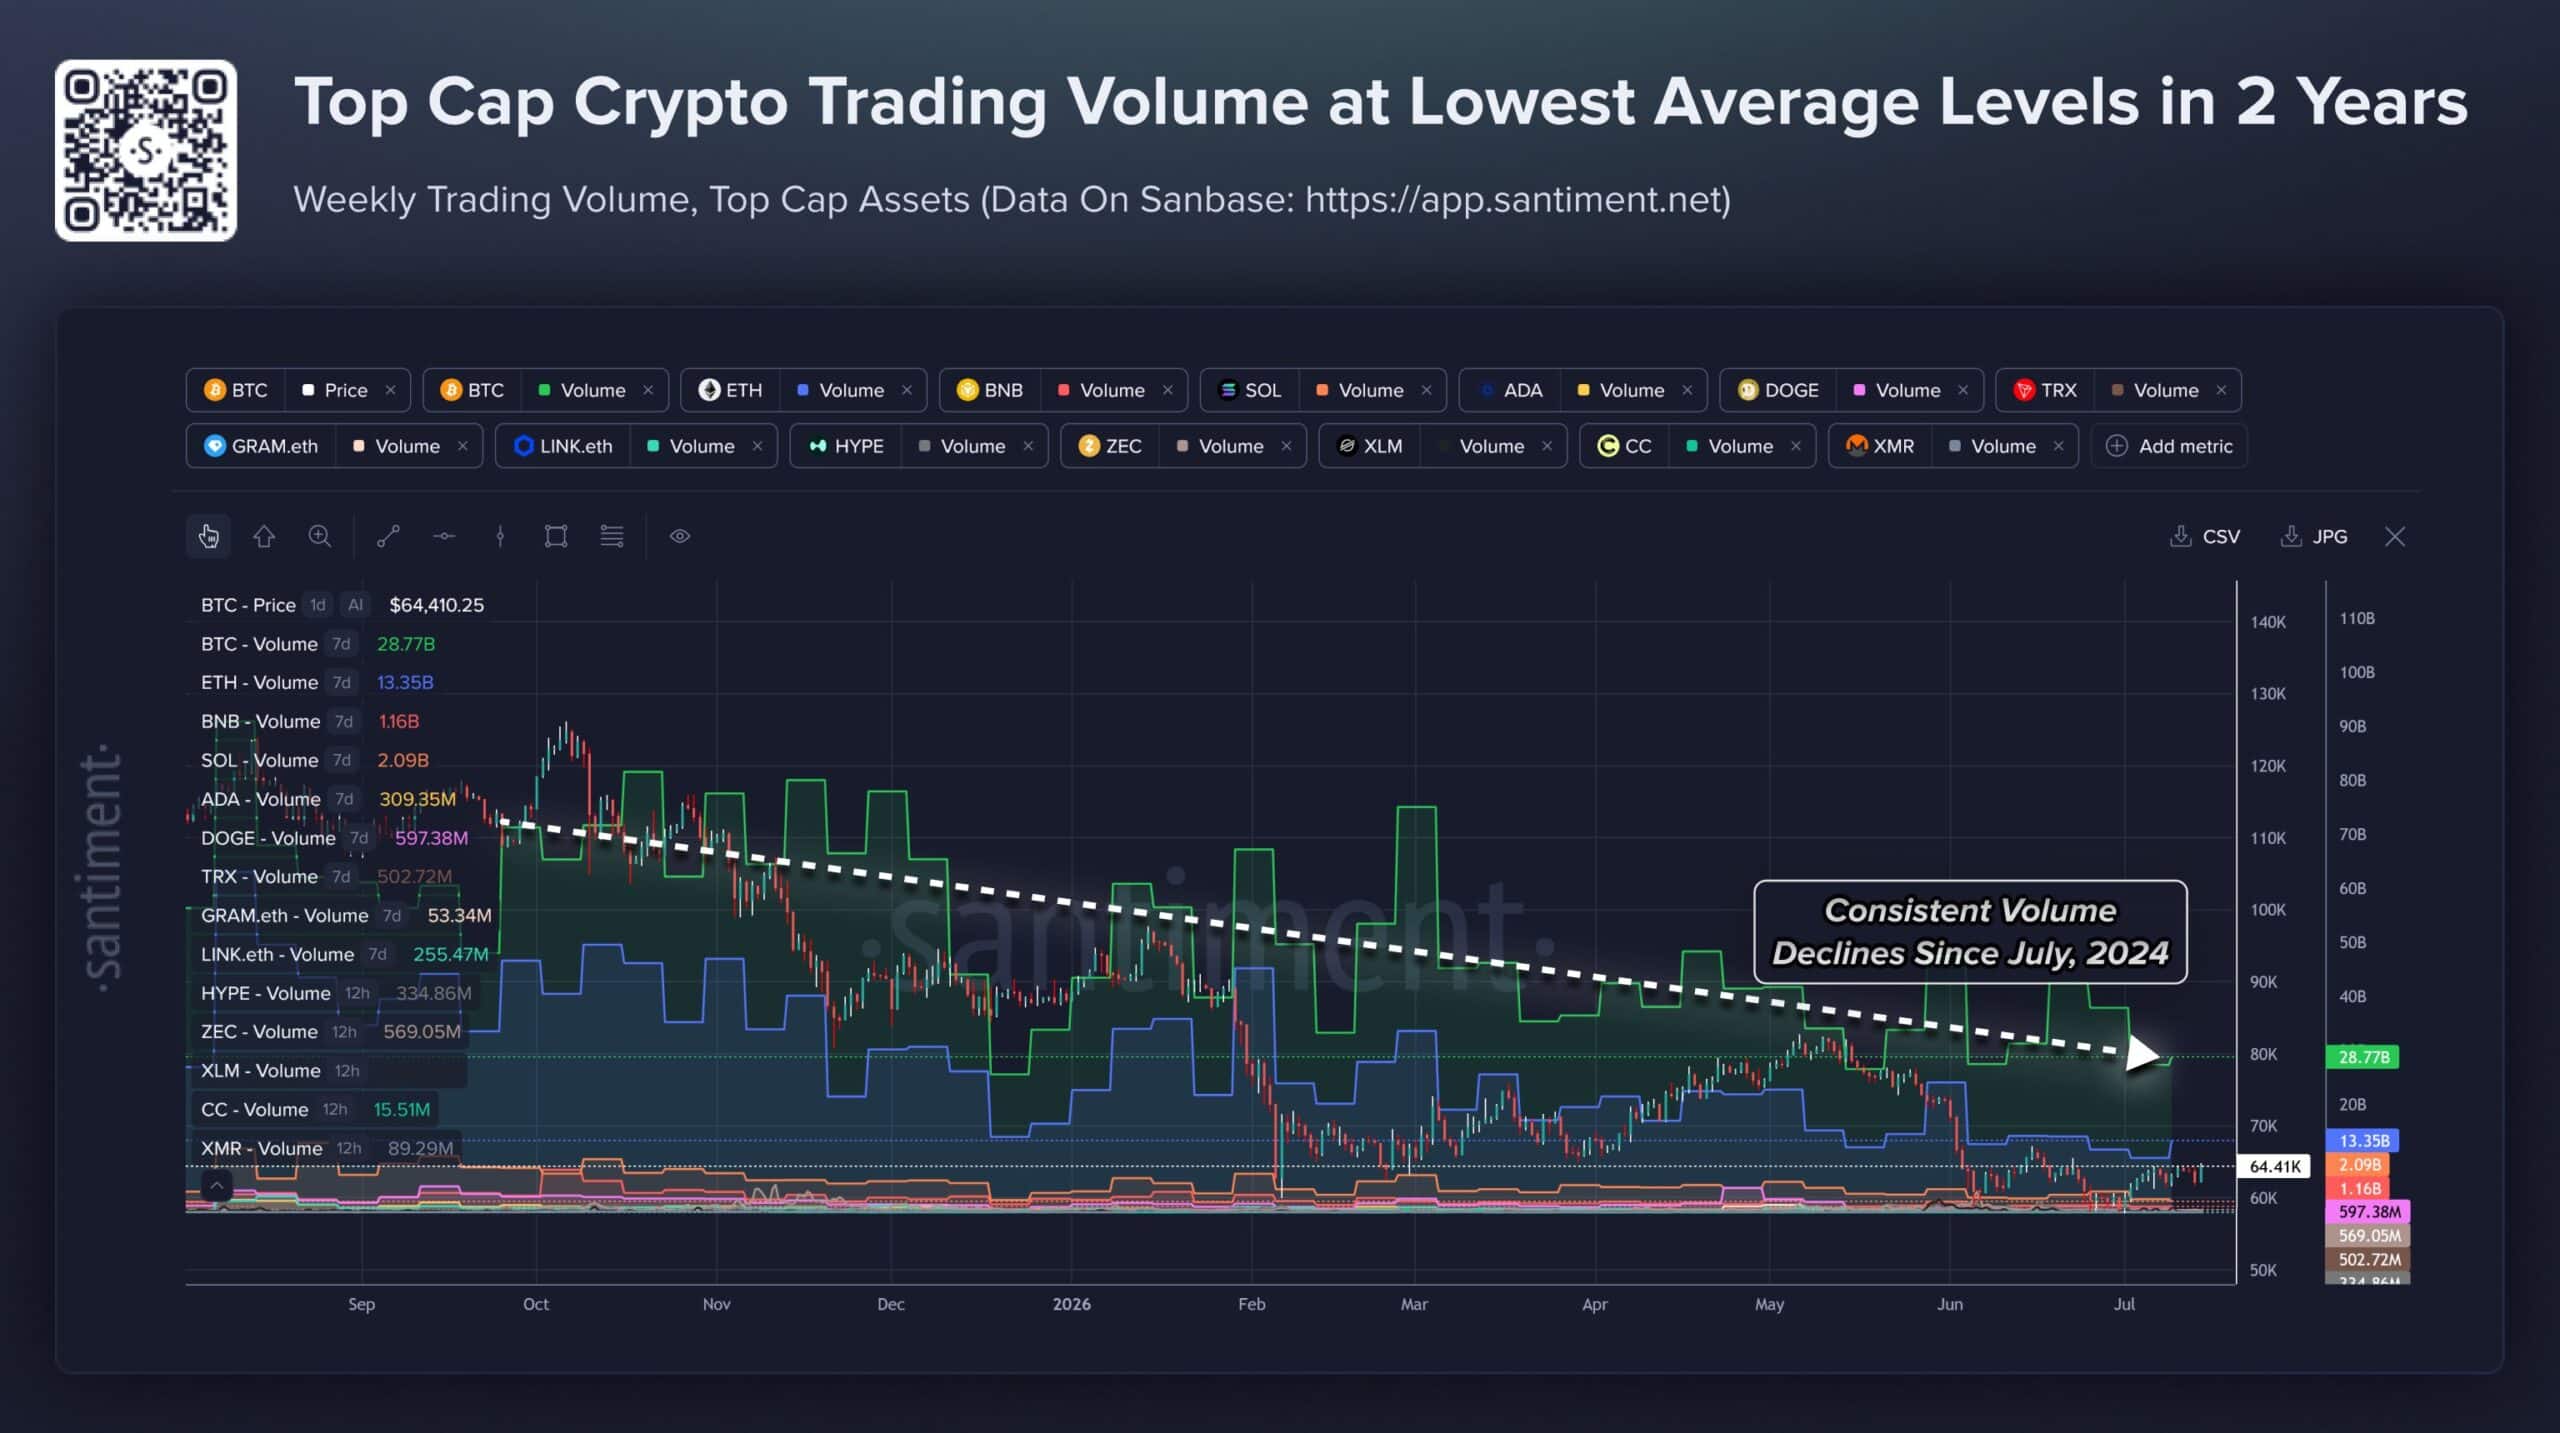
The trading volumes of the top crypto assets have been dwindling since July 2024, wrote the analytics platform Santiment in a post on X.
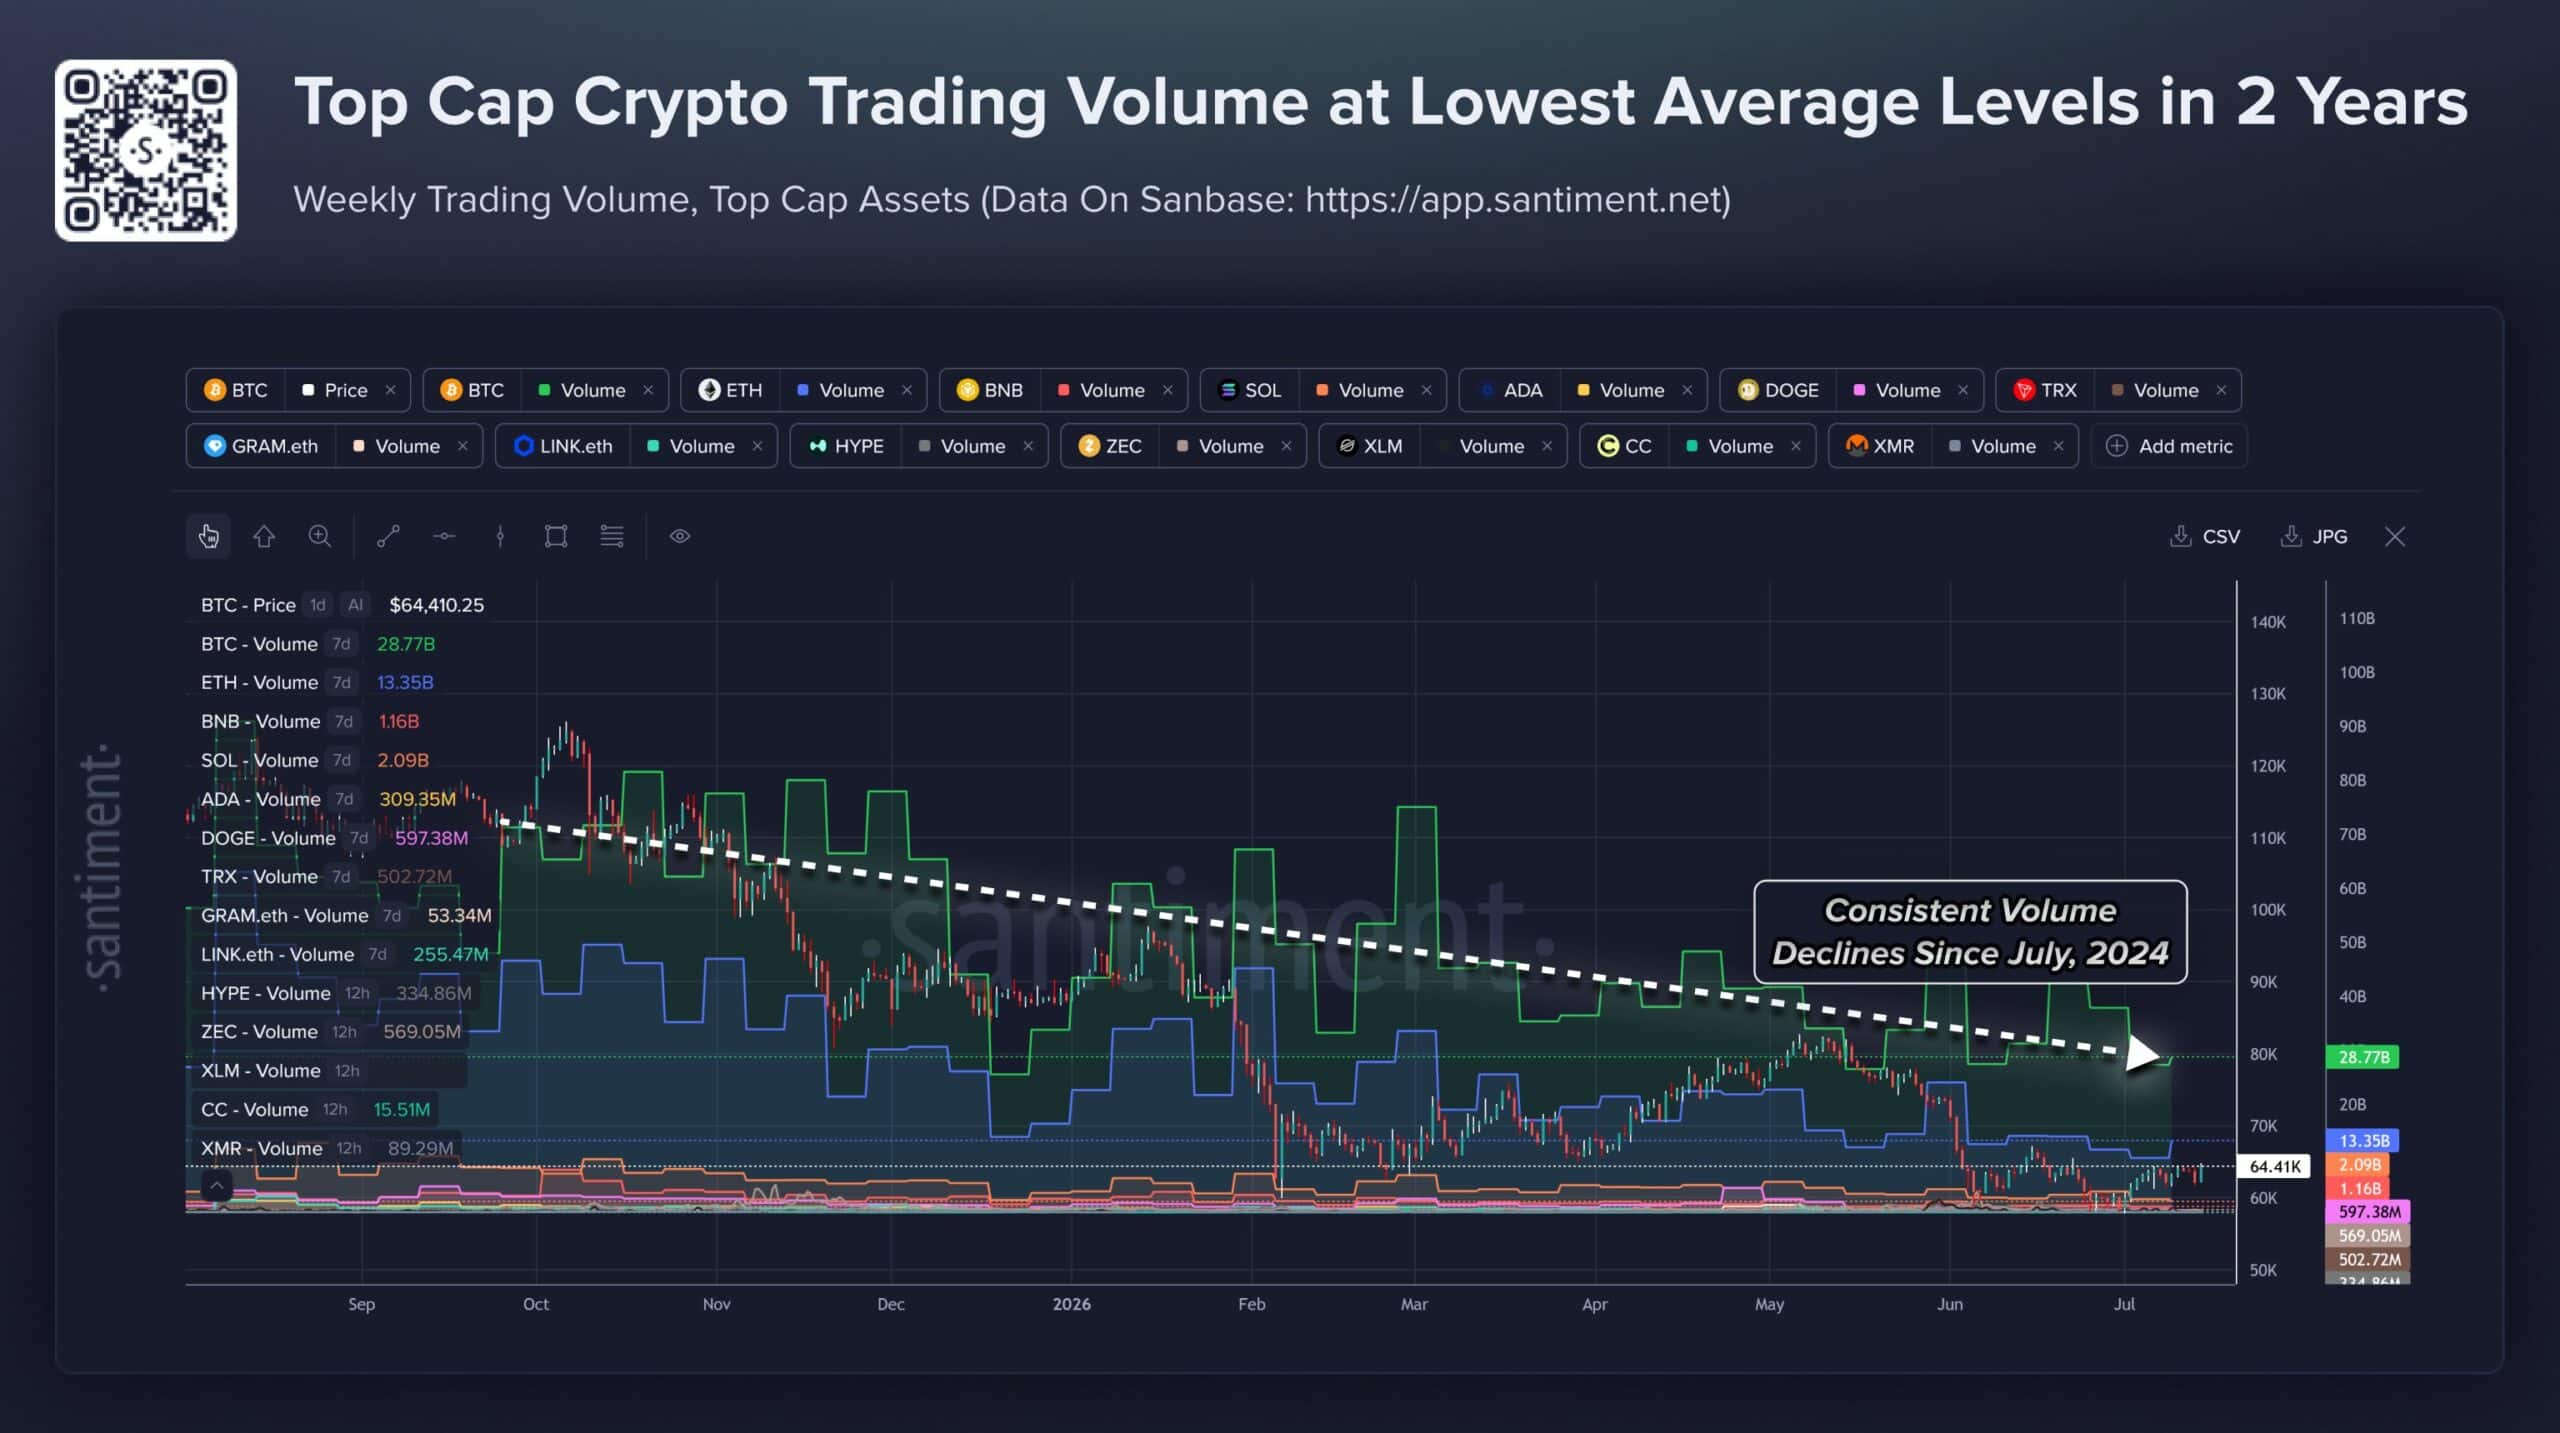
Source: Santiment on X

The trading activity was at its weakest average level in two years. It reflected weak demand and lower market confidence. Market participants are not rotating capital as aggressively, and each sell-off prompts more capital to flee.

Heavy macro pressure, Bitcoin [BTC] spot ETF outflows, and bearish price action since October 2025 for the leading crypto helped explain the dwindling volumes.

Thin liquidity means that reduced demand would mean rallies can be more easily faded. Yet, if seller exhaustion has reached cyclical extremes, a subsequent recovery could be quick, and even modest buying pressure could move prices quickly.

The Solana buying opportunity
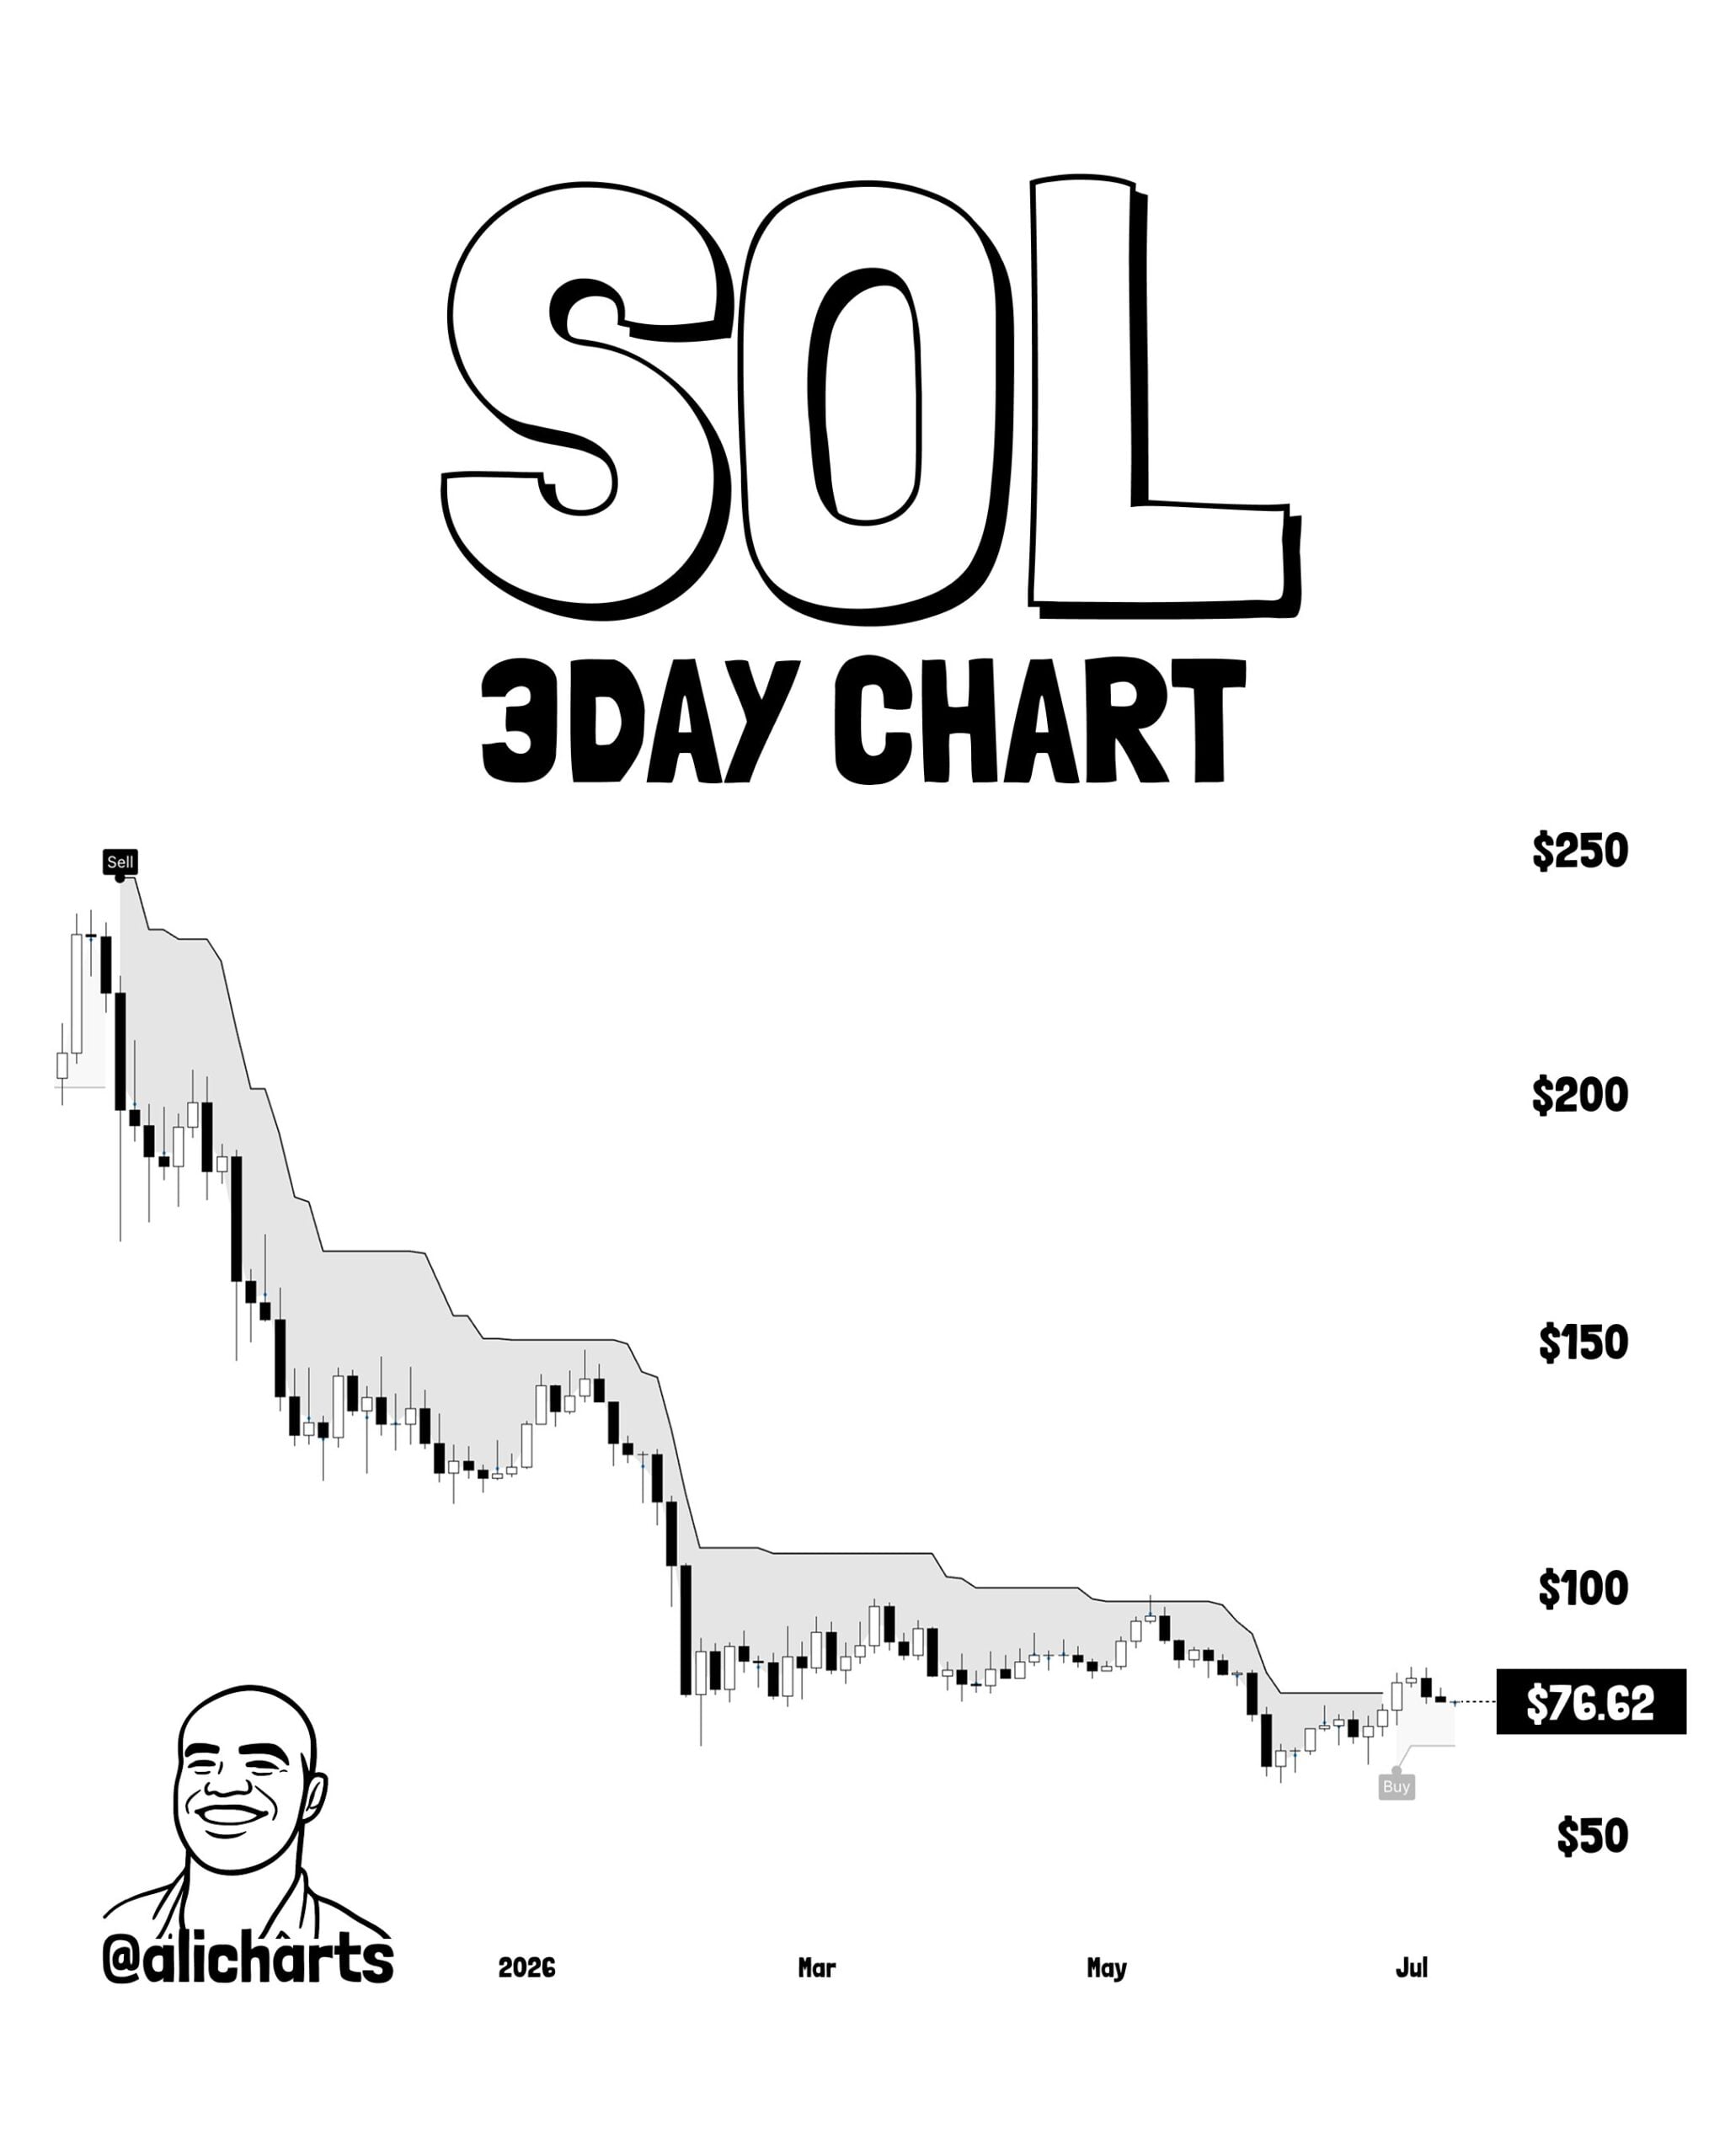
Source: Ali Charts on X

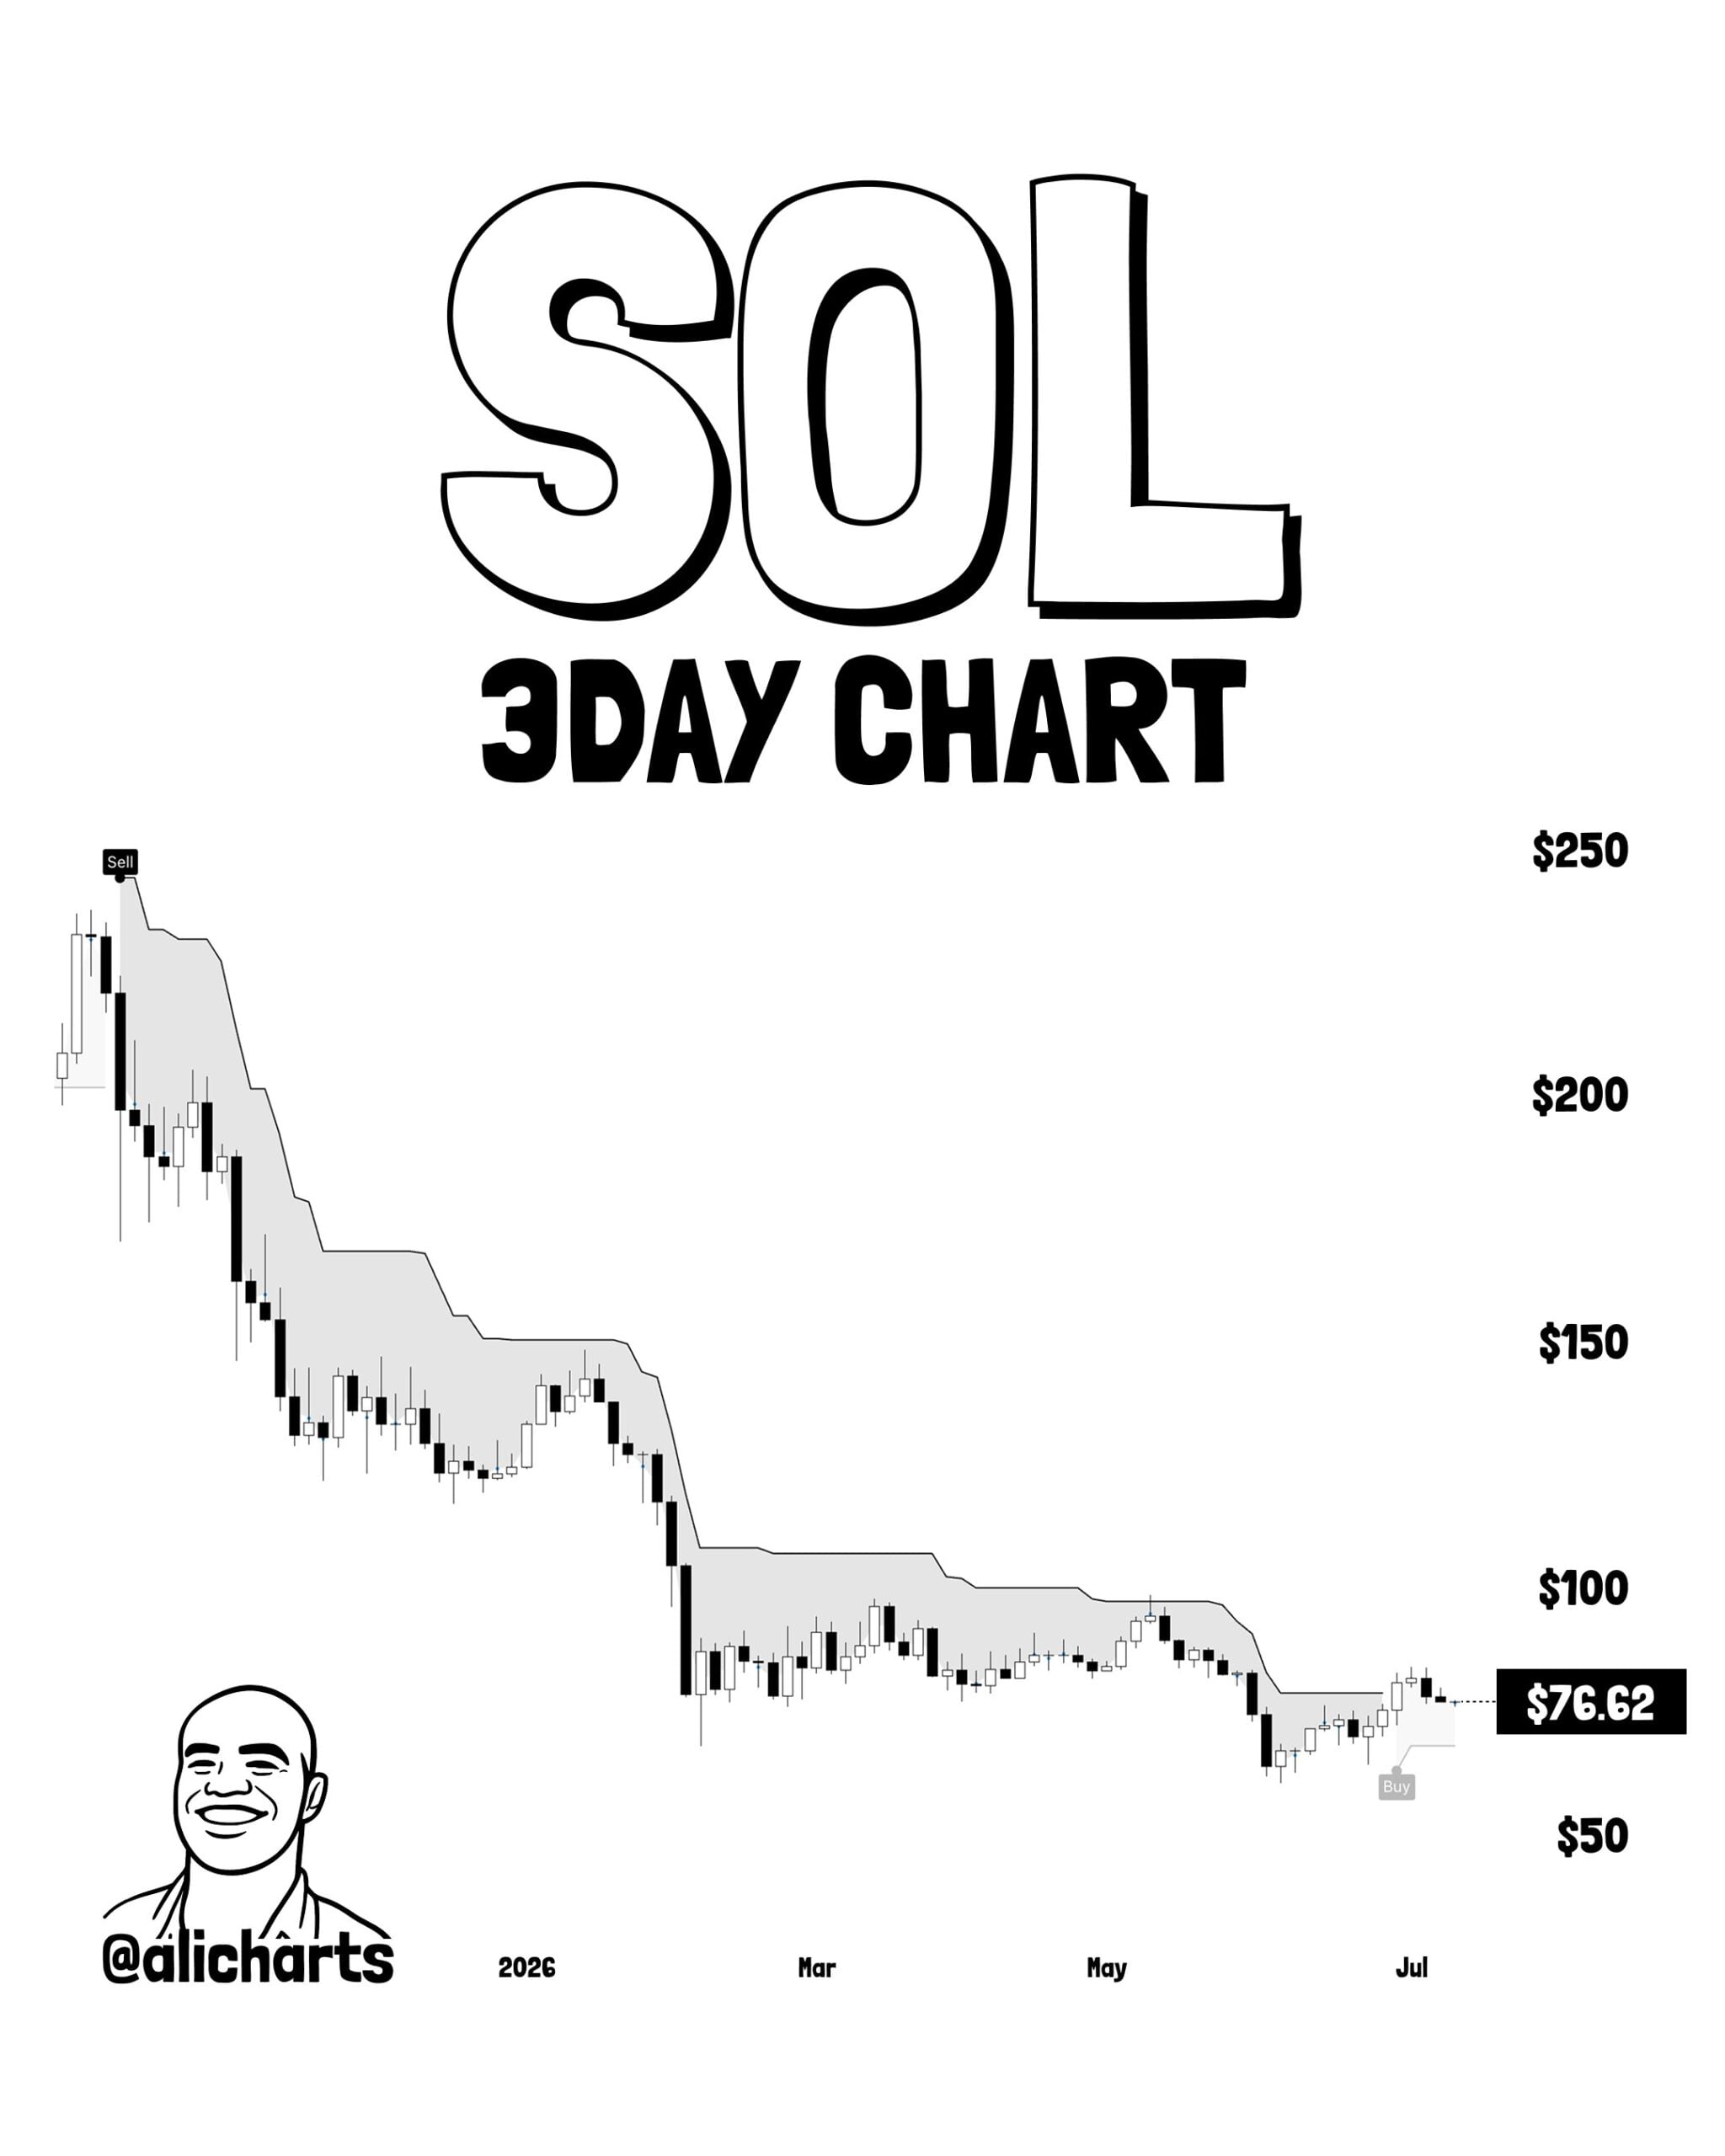
Against this backdrop of reduced volume, Solana [SOL] has turned bullish, according to crypto analyst Ali Martinez. The popular technical analyst used the SuperTrend tool on the 3-day timeframe to show that the ATR trailing stop has flipped bullishly.

This is a buy signal, and the $96 and $121 levels were the next levels to watch out for.

The Hodler Net Position Change metric on Glassnode has been positive throughout 2026. The metric tracks the monthly position change among long-term investors, and positive trends show hodlers were actively adding to their holdings.

SOL still trading within a bearish trend
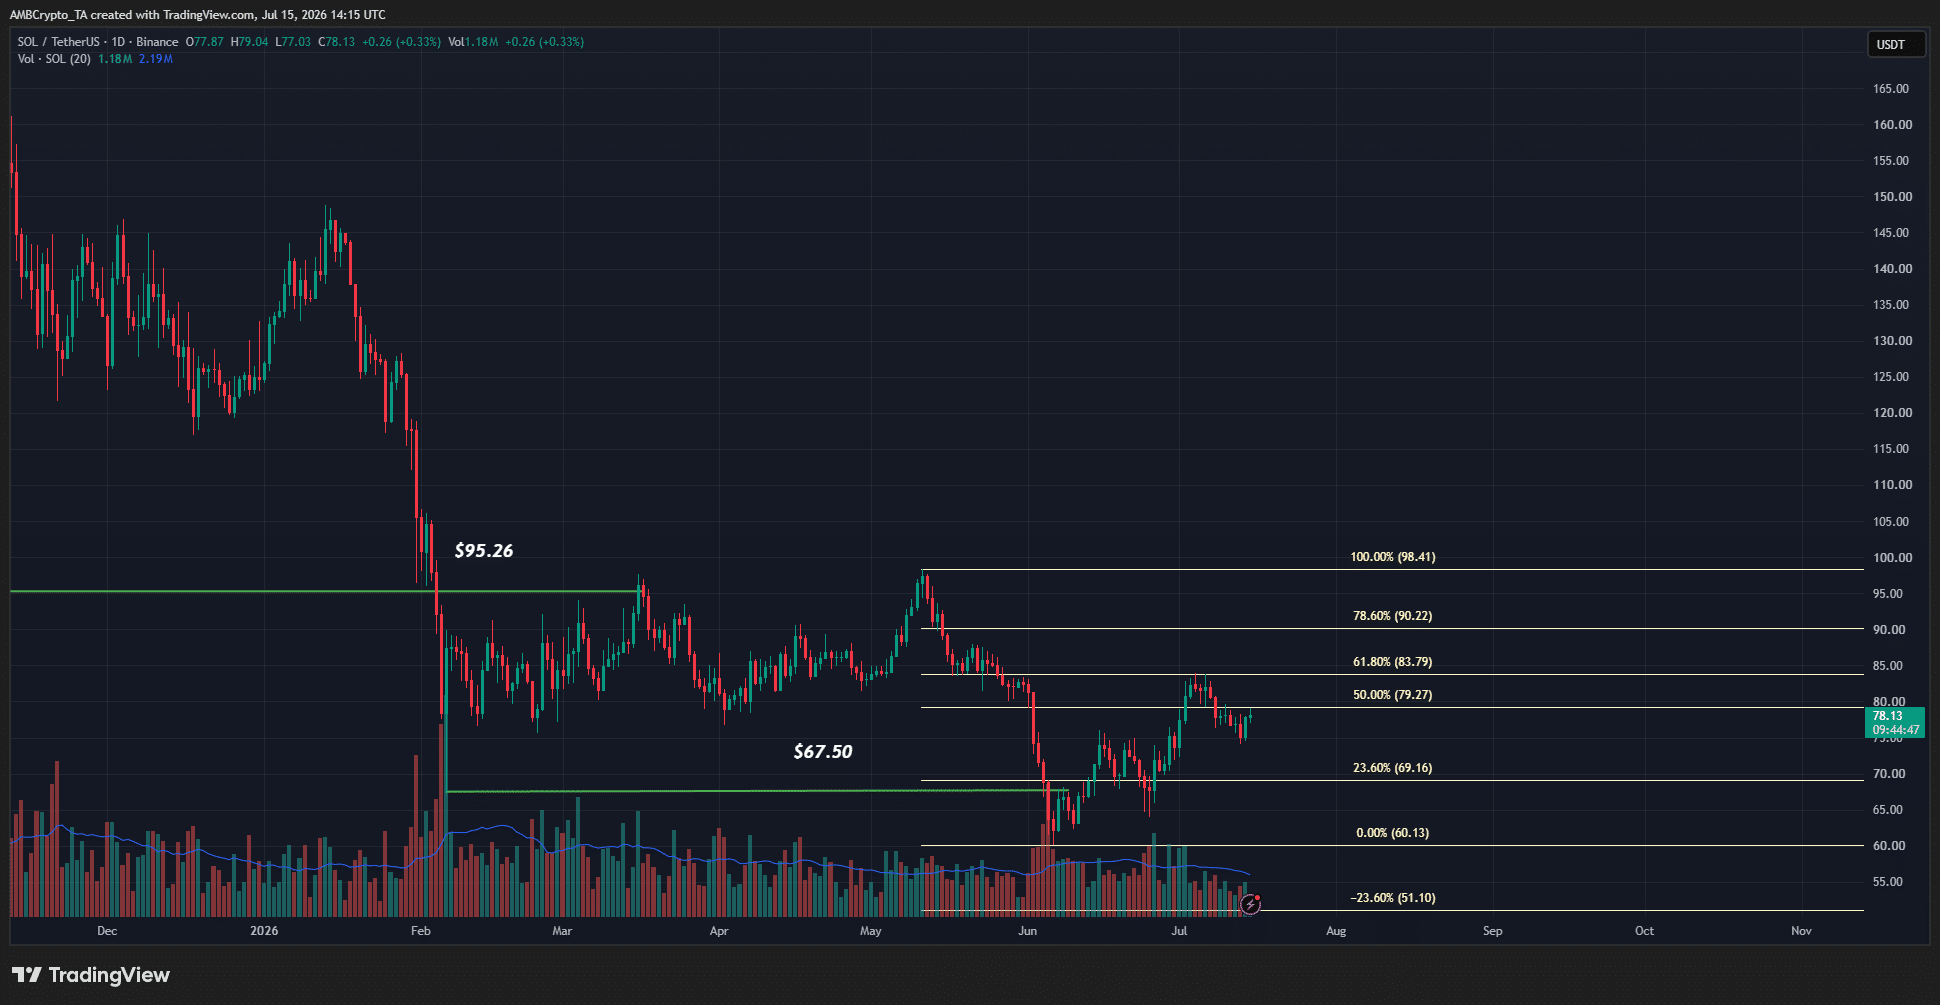
Source: SOL/USDT on TradingView

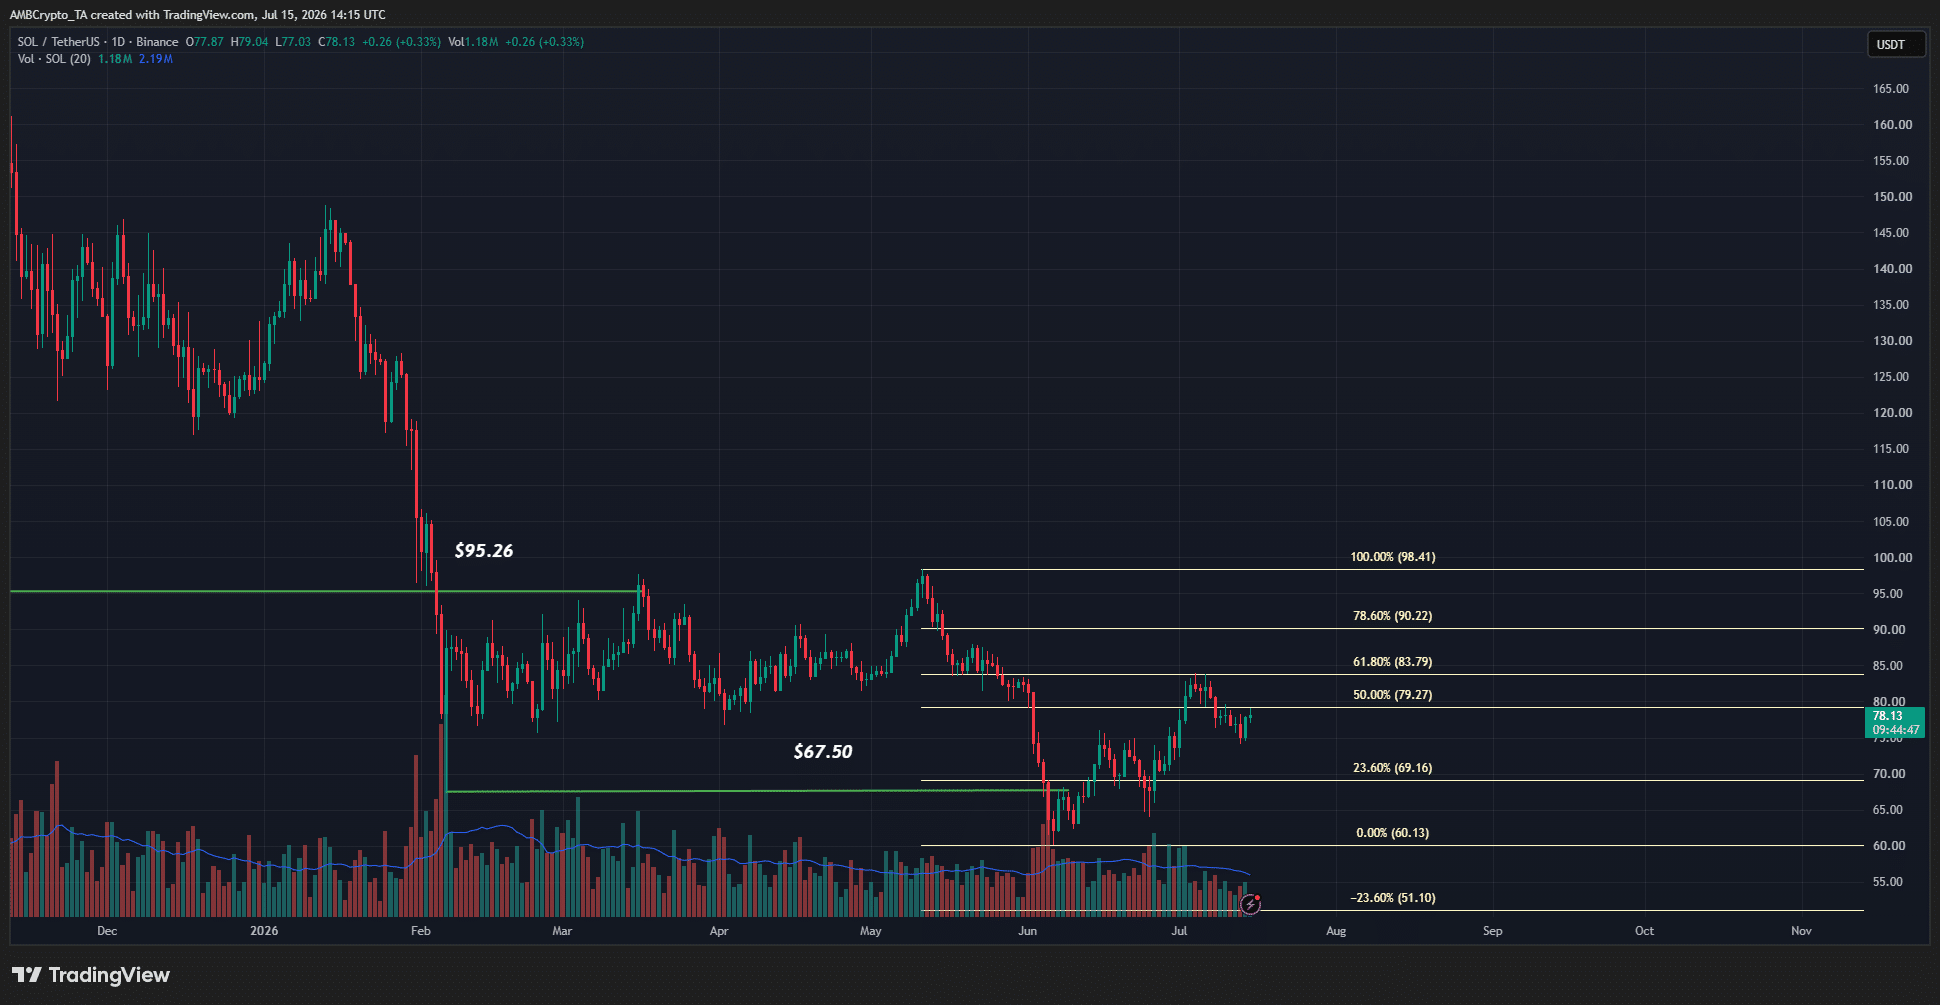
The swing lows at $95.26 and $67.50 were broken earlier this year, keeping the bearish Solana swing structure in place. Based on the drop from $98.41 to $60.13, Fibonacci retracement levels were plotted.

The $83.79 and $90.22 were the key resistance levels to watch out for. Another one was the $116 level, which was the realized price of Solana. Since the market price was well below this level, it showed that the aggregate holder base was facing unrealized losses.

This can prompt a sell-off on subsequent price bounces, making recovery harder until the wider market recovers and attracts greater capital inflows.

Recent selling pressure has also been reinforced by large token movements. A $15.14 million onchain SOL token move from Alameda Research was spotted recently, and the subsequent short-term price move resulted in just over $10 million in long liquidations.


Final Summary

  • The Solana buy signal in recent days and hodler accumulation trends throughout 2026 gave the altcoin a bullish tint.
  • Yet, the price charts and overhead supply zones meant a meaningful recovery would be difficult and requires greater capital inflows.


Criptomoedas em alta

Perguntas relacionadas

QAccording to Ali Martinez, what time frame and indicator were used to identify the bullish buy signal for Solana?

AAccording to crypto analyst Ali Martinez, he used the SuperTrend tool on the 3-day timeframe to identify that the ATR trailing stop had flipped bullishly, signaling a buy signal for Solana.

QWhat are the two key price levels mentioned as next to watch for Solana based on the bullish signal?

ABased on the bullish buy signal, the two key price levels to watch for Solana are $96 and $121.

QWhat does the Hodler Net Position Change metric being positive throughout 2026 indicate about Solana investors?

AThe Hodler Net Position Change metric being positive throughout 2026 indicates that long-term Solana investors (hodlers) were actively adding to their holdings and accumulating throughout that period.

QWhich Fibonacci retracement levels are highlighted as key resistance levels for Solana's price recovery?

AThe Fibonacci retracement levels highlighted as key resistance levels for Solana's price recovery are $83.79, $90.22, and the $116 level (which corresponds to Solana's realized price).

QWhat on-chain event from Alameda Research was mentioned as reinforcing recent selling pressure on Solana?

AA $15.14 million on-chain Solana token move from Alameda Research was mentioned as reinforcing recent selling pressure, which contributed to over $10 million in long liquidations following a short-term price move.

Leituras Relacionadas

Wall Street Unanimously Bullish: ASML's Capacity Surge, The 'Peak Theory' for Memory Can Be Put to Rest

Wall Street is collectively bullish on ASML after the company reported a far-better-than-expected Q2 and significantly raised its full-year guidance, while providing a rare 2027-2028 capacity expansion roadmap. Key financials surpassed consensus: Q2 revenue of €9.3B beat estimates, with gross margin at 54%. The company raised its 2026 revenue outlook to €43-€45B and expects Q3 revenue of €11-€12B. Most notably, management outlined aggressive capacity increases for both Low-NA EUV and immersion DUV systems. EUV capacity is projected to reach ~85 units in 2027 (up ~30% from 2026) and potentially ~110 in 2028. DUV capacity is set to rise to ~169 units in 2027 and ~220 in 2028. These targets exceed prior market expectations, leading analysts to significantly revise up 2028 earnings estimates, with JPMorgan suggesting EPS could surpass €65. Major banks including Goldman Sachs, JPMorgan, and Barclays maintained Buy/Overweight ratings. Analysts view the roadmap as a direct rebuttal to narratives about an AI-driven demand peak or an imminent memory price top. ASML stated that AI demand is accelerating expansion in both logic (for nodes like 2nm) and memory segments (driven by DDR/HBM shortages and the transition to more EUV-intensive nodes like 1c/1d DRAM). This structural shift, alongside the high wafer intensity of HBM production, is seen extending the memory upcycle. While most reactions were positive, some nuance existed on whether the 2027 EUV guidance was sufficiently aggressive versus heightened expectations. Overall, the results are seen as validating sustained AI-driven demand and ASML's unrivaled position as the key beneficiary of the industry's advanced node transition.

链捕手Há 4h

Wall Street Unanimously Bullish: ASML's Capacity Surge, The 'Peak Theory' for Memory Can Be Put to Rest

链捕手Há 4h

Trading

Spot

Artigos em Destaque

Como comprar CHECK

Bem-vindo à HTX.com!Tornámos a compra de Checkmate (CHECK) simples e conveniente.Segue o nosso guia passo a passo para iniciar a tua jornada no mundo das criptos.Passo 1: cria a tua conta HTXUtiliza o teu e-mail ou número de telefone para te inscreveres numa conta gratuita na HTX.Desfruta de um processo de inscrição sem complicações e desbloqueia todas as funcionalidades.Obter a minha contaPasso 2: vai para Comprar Cripto e escolhe o teu método de pagamentoCartão de crédito/débito: usa o teu visa ou mastercard para comprar Checkmate (CHECK) instantaneamente.Saldo: usa os fundos da tua conta HTX para transacionar sem problemas.Terceiros: adicionamos métodos de pagamento populares, como Google Pay e Apple Pay, para aumentar a conveniência.P2P: transaciona diretamente com outros utilizadores na HTX.Mercado de balcão (OTC): oferecemos serviços personalizados e taxas de câmbio competitivas para os traders.Passo 3: armazena teu Checkmate (CHECK)Depois de comprar o teu Checkmate (CHECK), armazena-o na tua conta HTX.Alternativamente, podes enviá-lo para outro lugar através de transferência blockchain ou usá-lo para transacionar outras criptomoedas.Passo 4: transaciona Checkmate (CHECK)Transaciona facilmente Checkmate (CHECK) no mercado à vista da HTX.Acede simplesmente à tua conta, seleciona o teu par de trading, executa as tuas transações e monitoriza em tempo real.Oferecemos uma experiência de fácil utilização tanto para principiantes como para traders experientes.

504 Visualizações TotaisPublicado em {updateTime}Atualizado em 2026.06.02

Como comprar CHECK

Discussões

Bem-vindo à Comunidade HTX. Aqui, pode manter-se informado sobre os mais recentes desenvolvimentos da plataforma e obter acesso a análises profissionais de mercado. As opiniões dos utilizadores sobre o preço de CHECK (CHECK) são apresentadas abaixo.

活动图片