Soaring Oil Prices No Longer Drive Up Interest Rates, What Is the Market Afraid Of?

marsbitPublicado em 2026-03-31Última atualização em 2026-03-31

Resumo

Oil prices surged nearly 60% in March 2026—the steepest monthly rise since Brent crude's inception in 1988—after the Strait of Hormuz closed, cutting off 17.8 million barrels per day of oil flow. Historically, such spikes pushed inflation expectations and bond yields higher, but this time, the 10-year Treasury yield fell sharply from 4.44% to 3.92% in late March, signaling a decoupling. This divergence reflects a market shift: growth risks now outweigh inflation concerns. Bond markets are betting on recession rather than persistent inflation. Historical oil shocks—like those in 1973, 1979, 1990, and 2008—often preceded economic downturns. The sole exception was the 2022 spike, which triggered severe inflation instead. Market expectations pivoted rapidly. Earlier, traders anticipated rate cuts, but by late March, weak consumer confidence and manufacturing data drove bets toward Fed dovishness. Chair Powell emphasized monitoring whether the supply shock is temporary, but the bond market has already priced in recession risks. If stagflation emerges—as during 1973–1982—real assets like gold and commodities may outperform, while stocks and bonds could suffer. The 60/40 portfolio would be particularly vulnerable. Analysts project Brent could average $115–125 in April, with a peak of $150 possible if the Strait remains closed. The bond market’s verdict is clear: fear of recession dominates.

Since the closure of the Strait of Hormuz on March 2, approximately 17.8 million barrels per day of global oil flow have been cut off. In March alone, Brent crude surged nearly 60%, while WTI rose about 53%. This marks the steepest monthly gain for the Brent contract since its inception in 1988, surpassing the 46% record set during the 1990 Gulf War.

Conventionally, soaring oil prices drive up inflation expectations, and bond yields should follow suit. For most of the past two decades, oil prices and the 10-year U.S. Treasury yield have indeed been positively correlated. But this time, they moved in opposite directions.

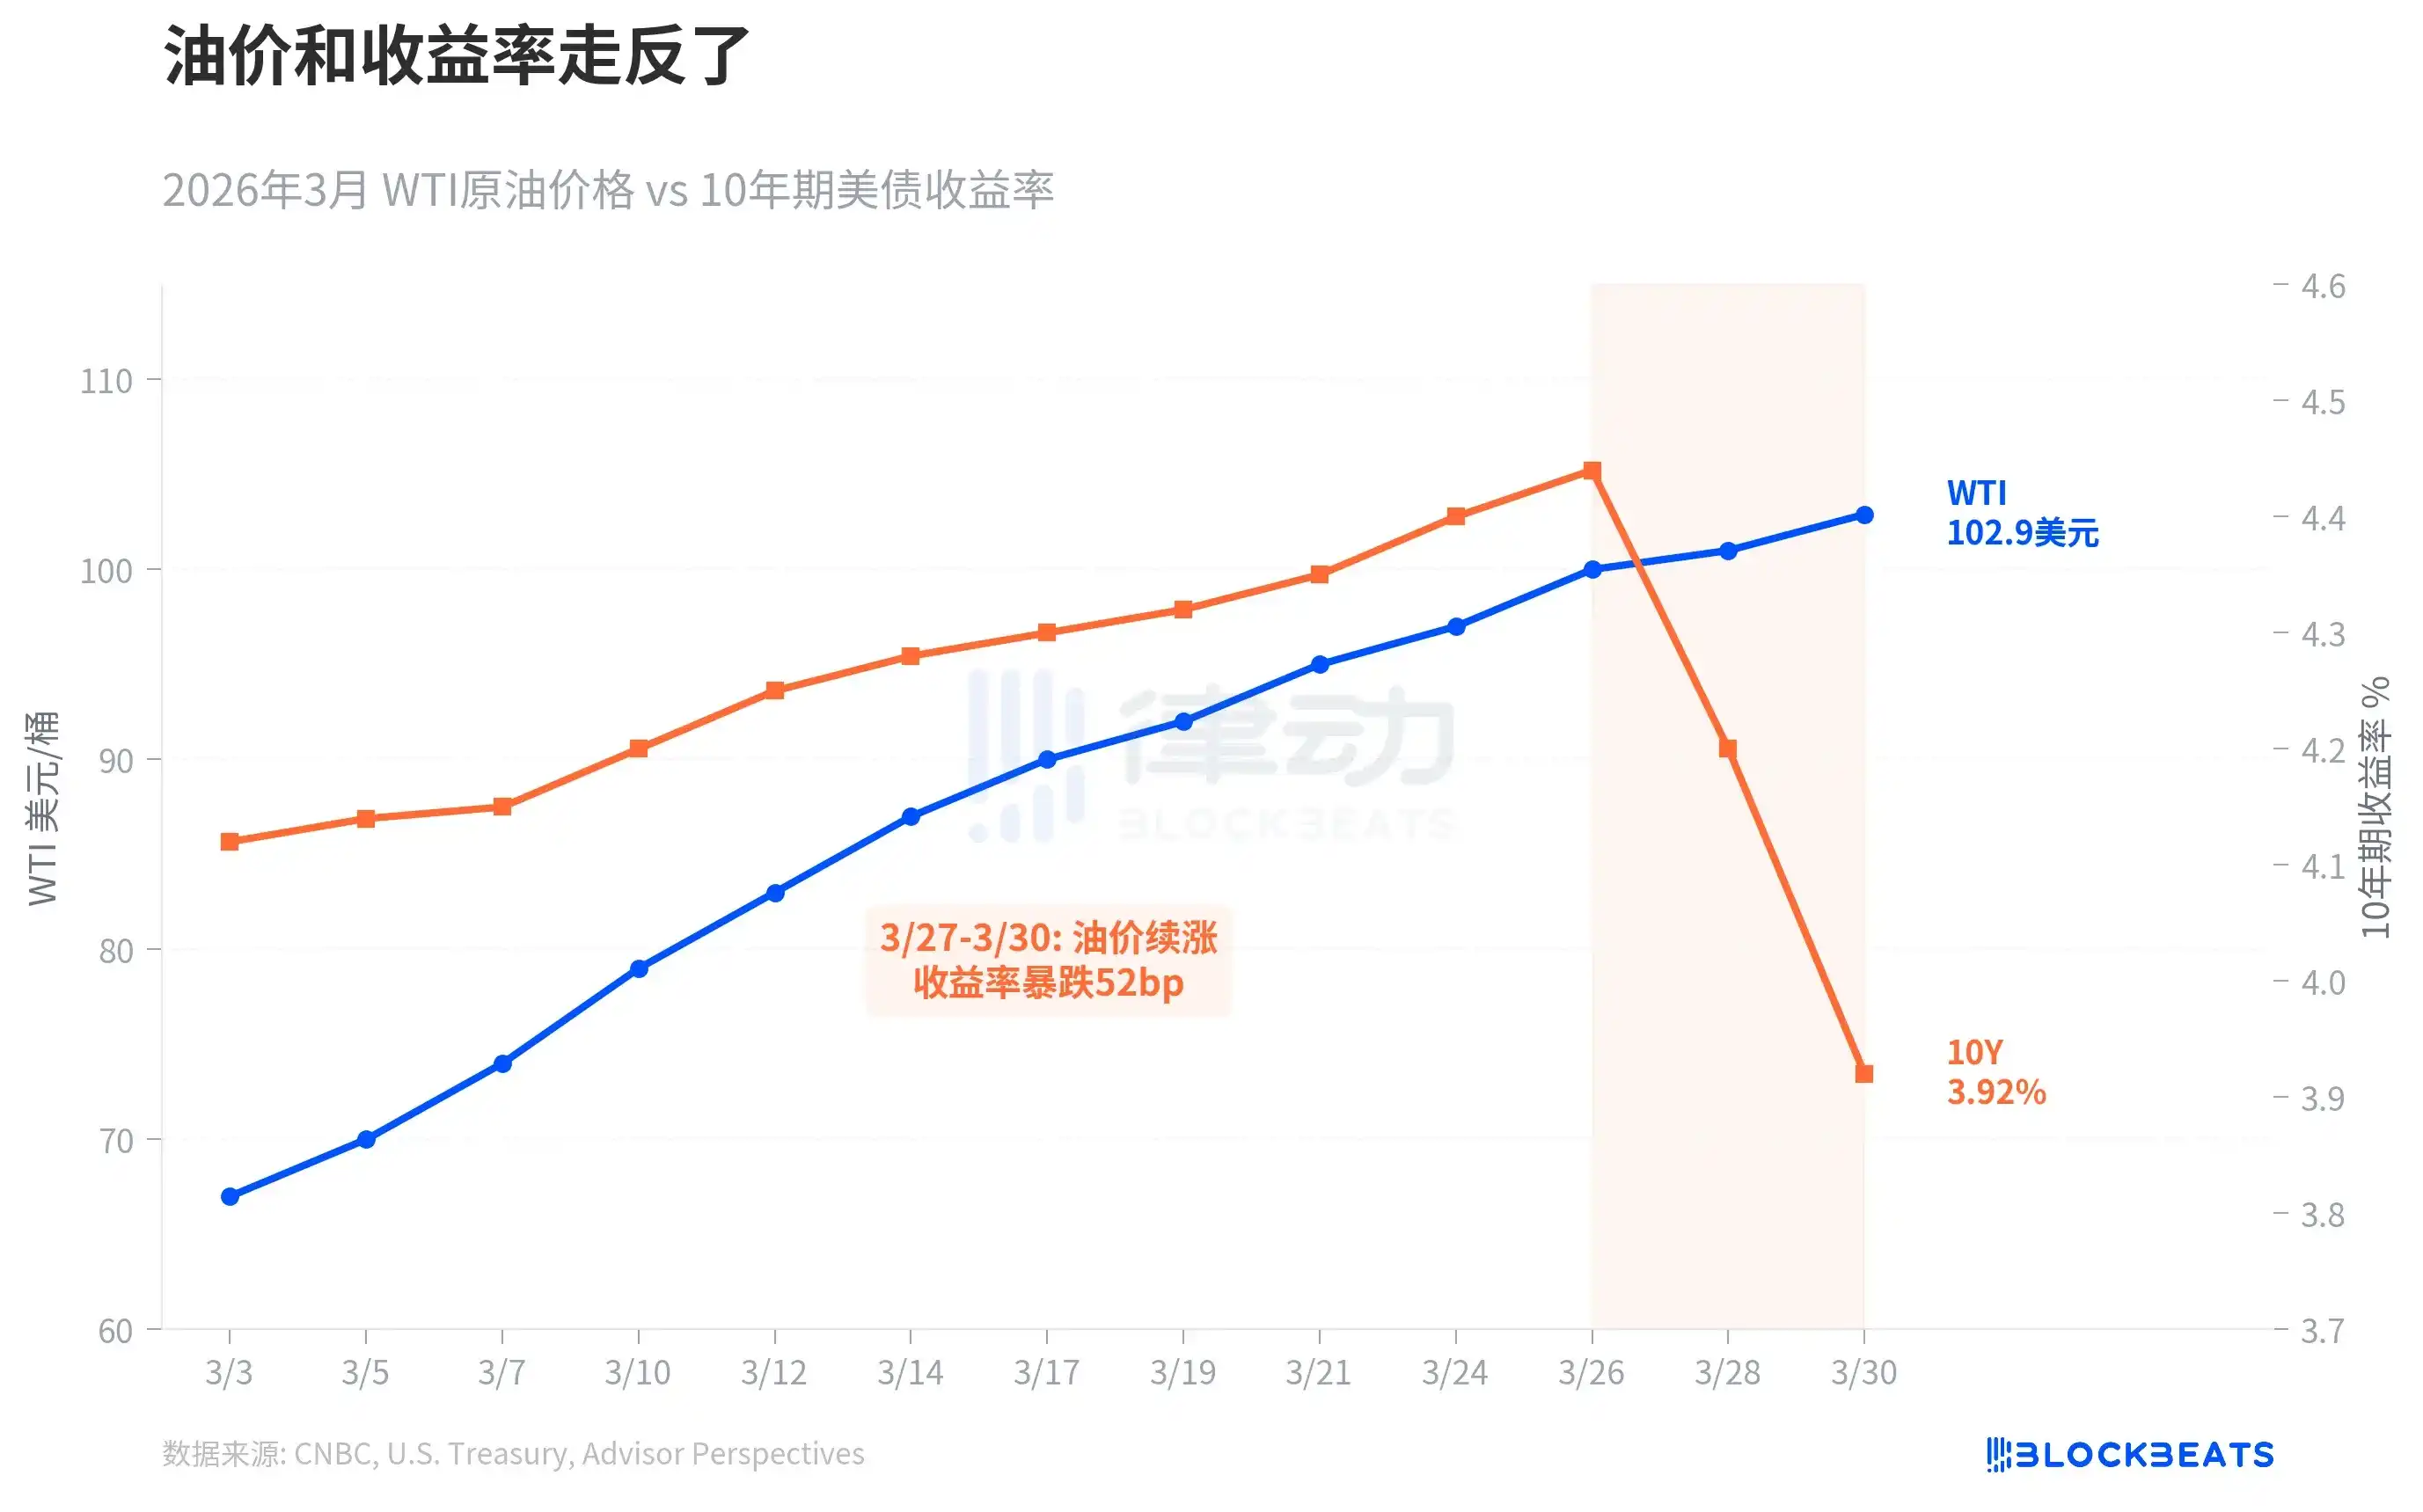
In the first three weeks of March, the two were still moving upward in sync. WTI rose from $67 to $100, while the 10-year yield climbed from 4.15% to 4.44%. The turning point occurred between March 27 and 30: oil prices continued to surge, but the yield plummeted from 4.44% to 3.92%, dropping 52 basis points in three trading sessions and breaking through the psychologically significant 4% level.

This was a classic "flight to safety," with the bond market making a judgment: growth risks have now outweighed inflation risks. As the economic firm Oxford Economics put it, "growth risks began to outweigh inflation risks." In other words, the market is not unafraid of inflation; it is more afraid of a recession.

This decoupling is not common, but whenever it occurs, the subsequent story tends to be unfavorable.

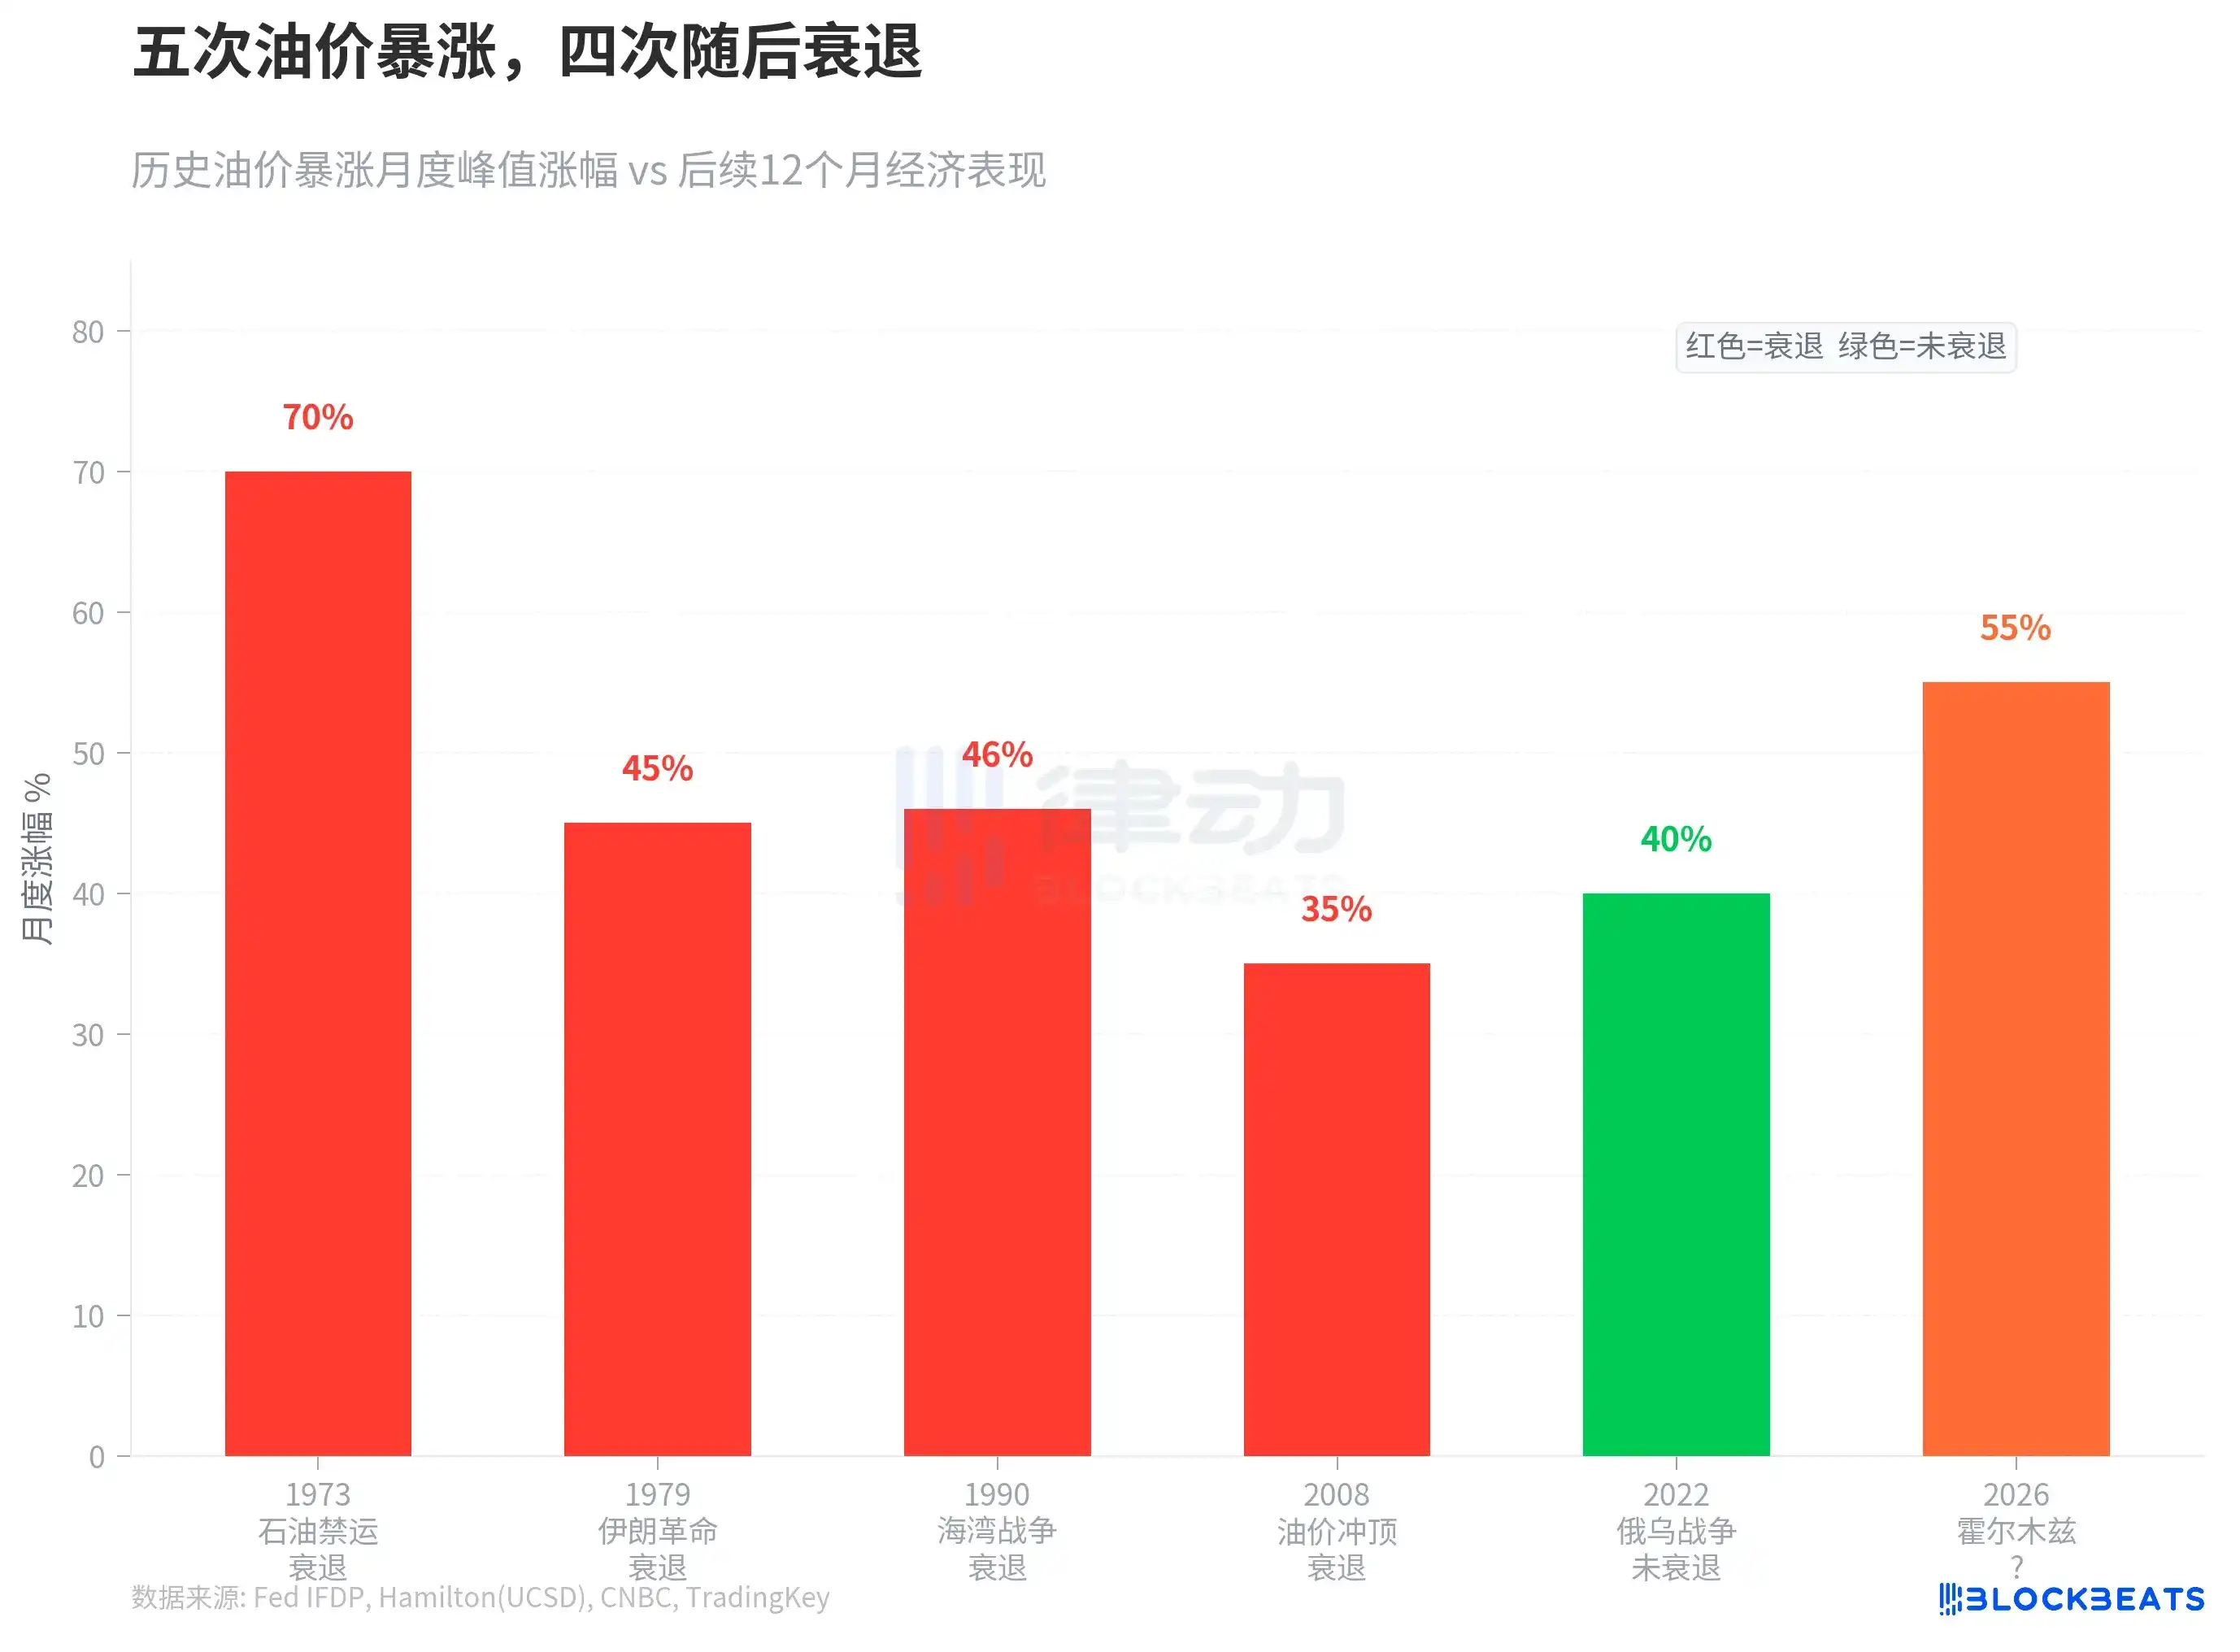
Over the past half-century, there have been five instances where oil prices surged more than 35% in a short period. During the 1973 oil embargo, U.S. GDP subsequently fell by 4.7%. The 1979 Iranian revolution caused global GDP to deviate from trend growth by 3 percentage points. The 1990 Gulf War led to a brief U.S. recession. In 2008, oil prices peaked at $147; although the primary cause of that recession was the financial crisis, the oil price shock accelerated the economic downturn. The only exception was the oil price surge driven by the 2022 Russia-Ukraine war, which did not trigger a recession but came at the cost of the most severe inflation in 40 years.

The surge in March 2026 exceeded all the above cases. According to research by Federal Reserve economist James Hamilton, there is no mechanical link between oil price shocks and recessions, but "the greater the net increase in oil prices, the more significant the suppression of consumption and investment." Goldman Sachs has raised the probability of a U.S. recession to 30%, while consulting firm EY-Parthenon puts the figure at 40%.

The market's reaction speed was also unusually fast.

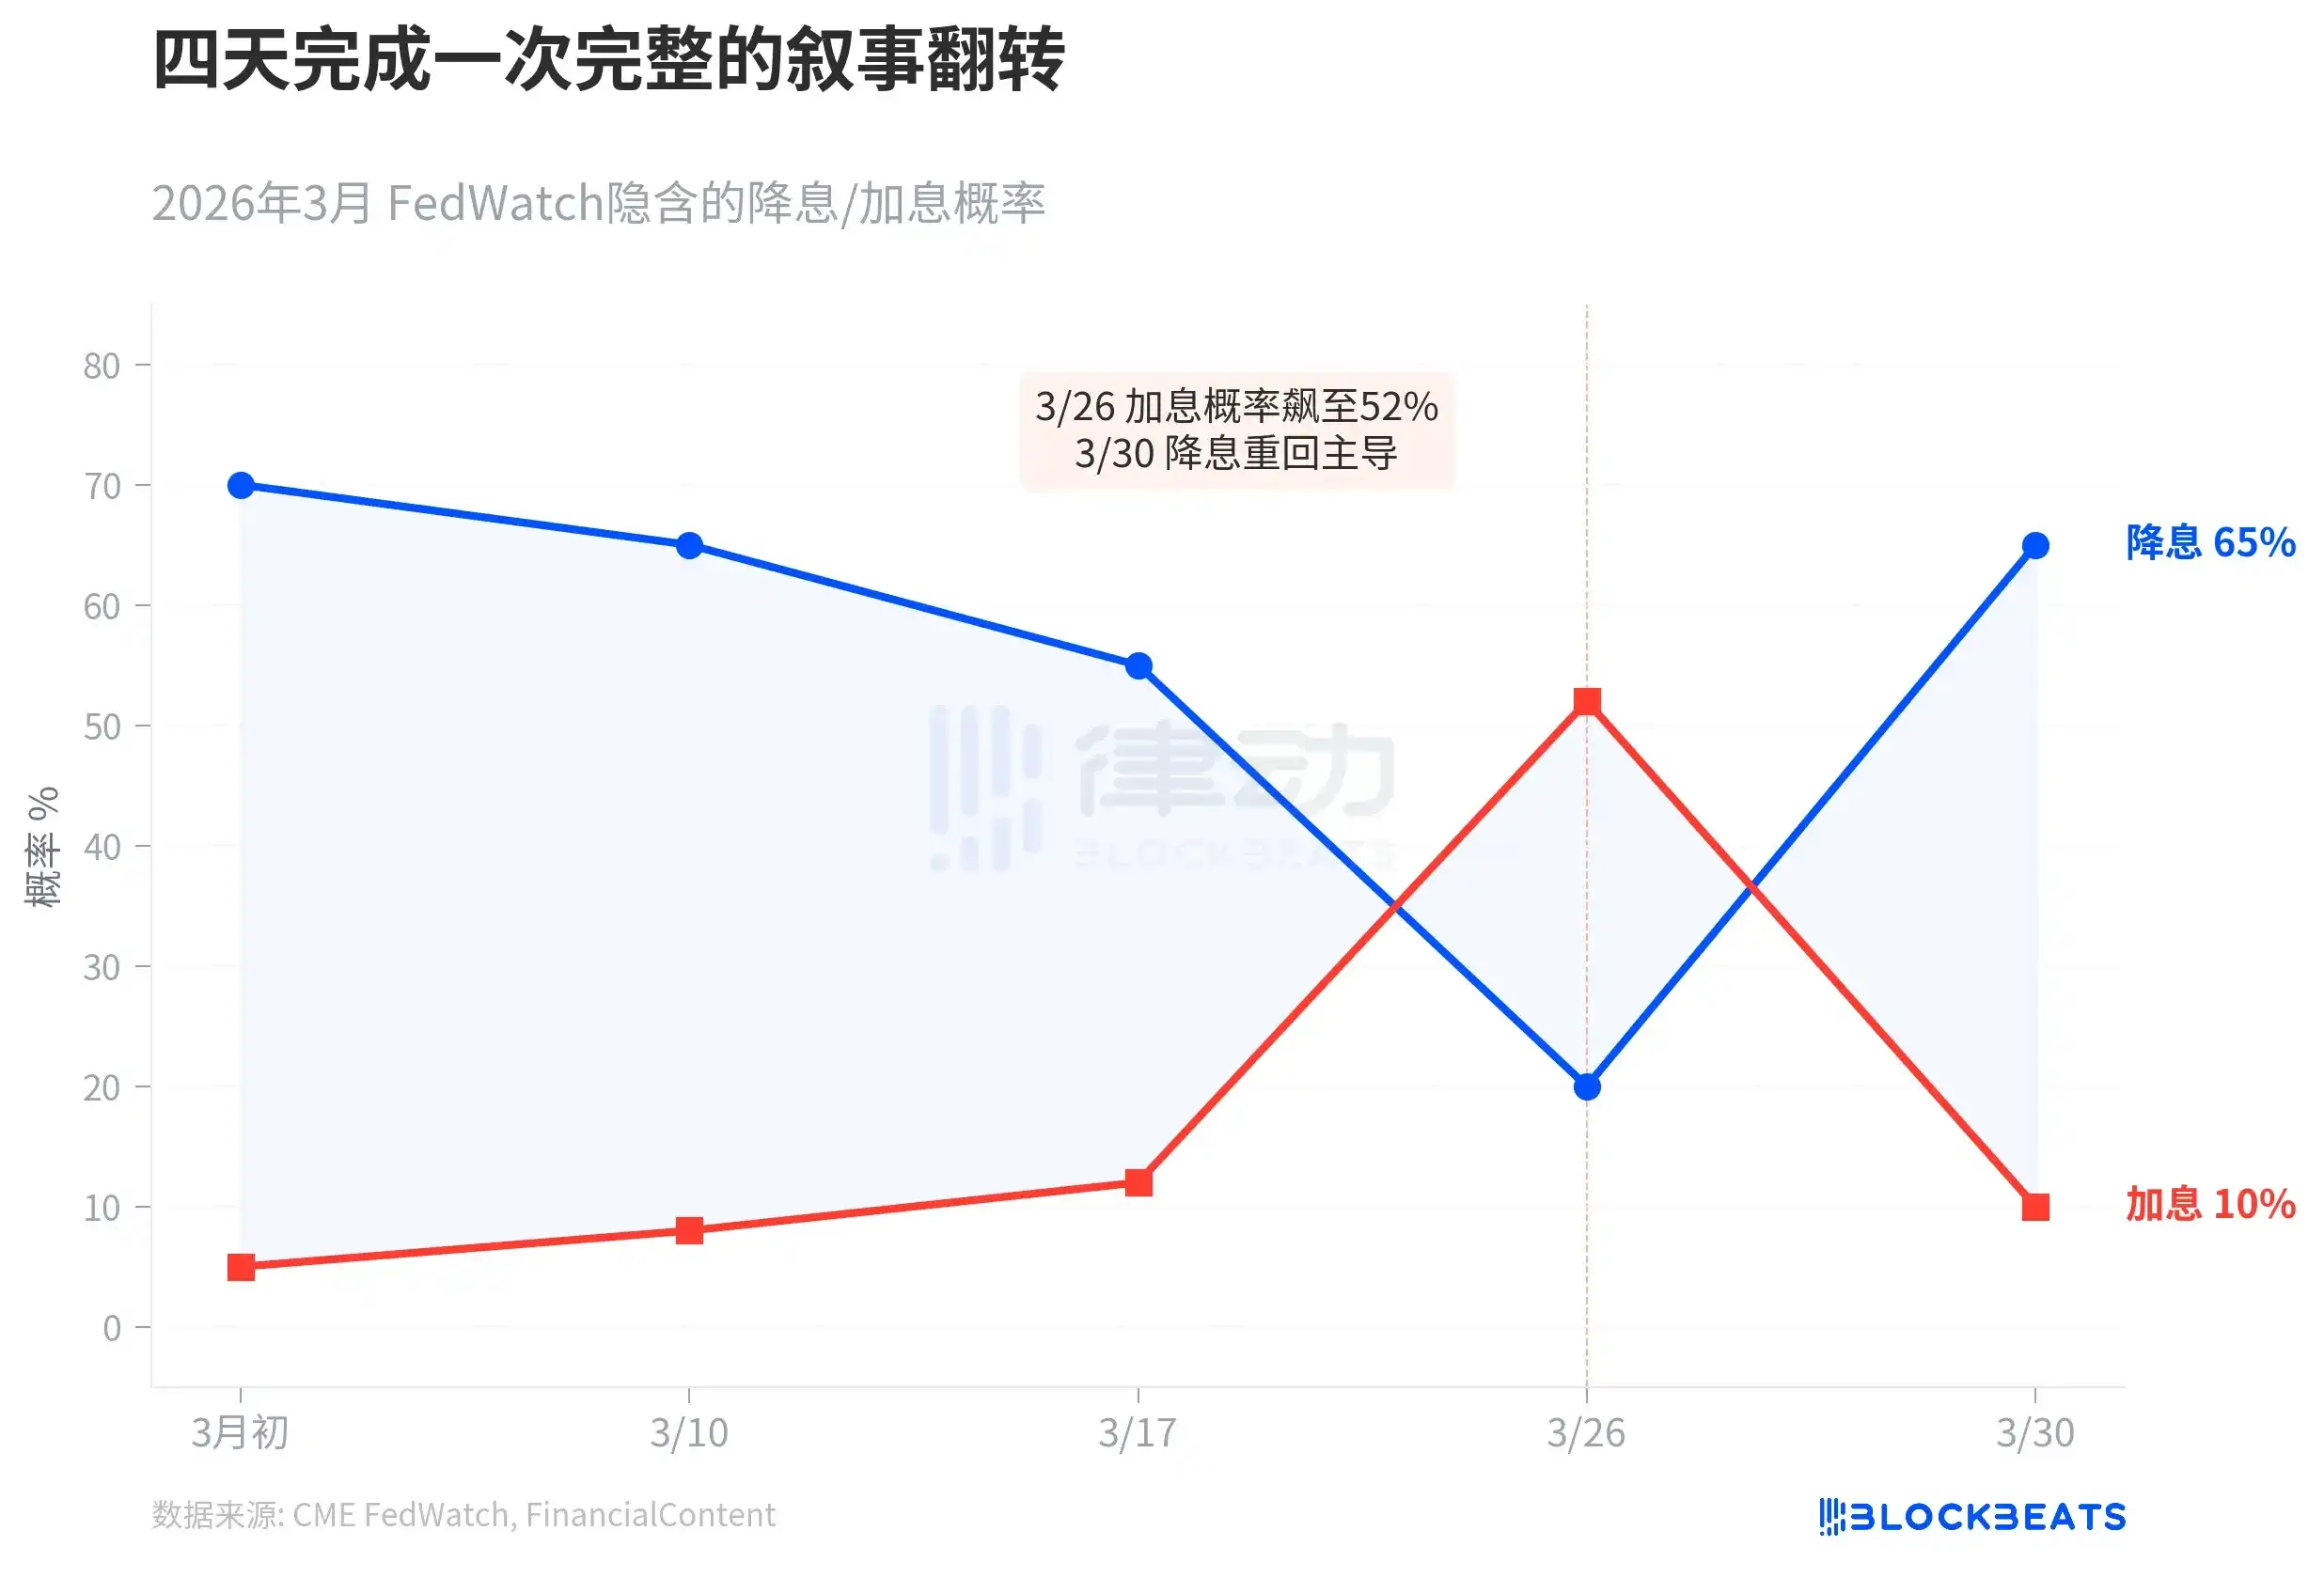
In early March, CME FedWatch showed the market expected three rate cuts for the year, with a 70% probability of a cut in June. Then, as oil prices continued to climb, the U.S. import price index jumped 1.3% on March 26, and incoming Fed Chair Kevin Warsh hinted that the neutral rate might be higher. That day, the probability of a rate hike within the year soared to 52%, and the 10-year yield touched 4.35%. FinancialContent defined this day as "The Great Hawkish Pivot."

Four days later, the narrative completely flipped. On March 30, consumer confidence data fell sharply, manufacturing unexpectedly contracted, and the 10-year yield plummeted to 3.92%. According to FinancialContent, market bets on a dovish pivot by the Fed in May rose to 65%. Goldman Sachs said the market had bet wrong on the direction of rate hikes. That same day, Powell told undergraduates at Harvard that the Fed "has not yet reached the moment where it must decide whether to look through the war shock," but emphasized that "the anchoring of inflation expectations is key."

According to Axios, Powell's remarks were interpreted by the market as: the Fed neither wants to raise rates to fight inflation nor is it in a hurry to cut rates to save the economy. Instead, it is waiting to see whether this supply shock is temporary or persistent. But the bond market can wait no longer.

If history is any guide, Citi strategist McCormick put it most bluntly: what lies ahead is stagflation, which is bad for bonds and bad for stocks.

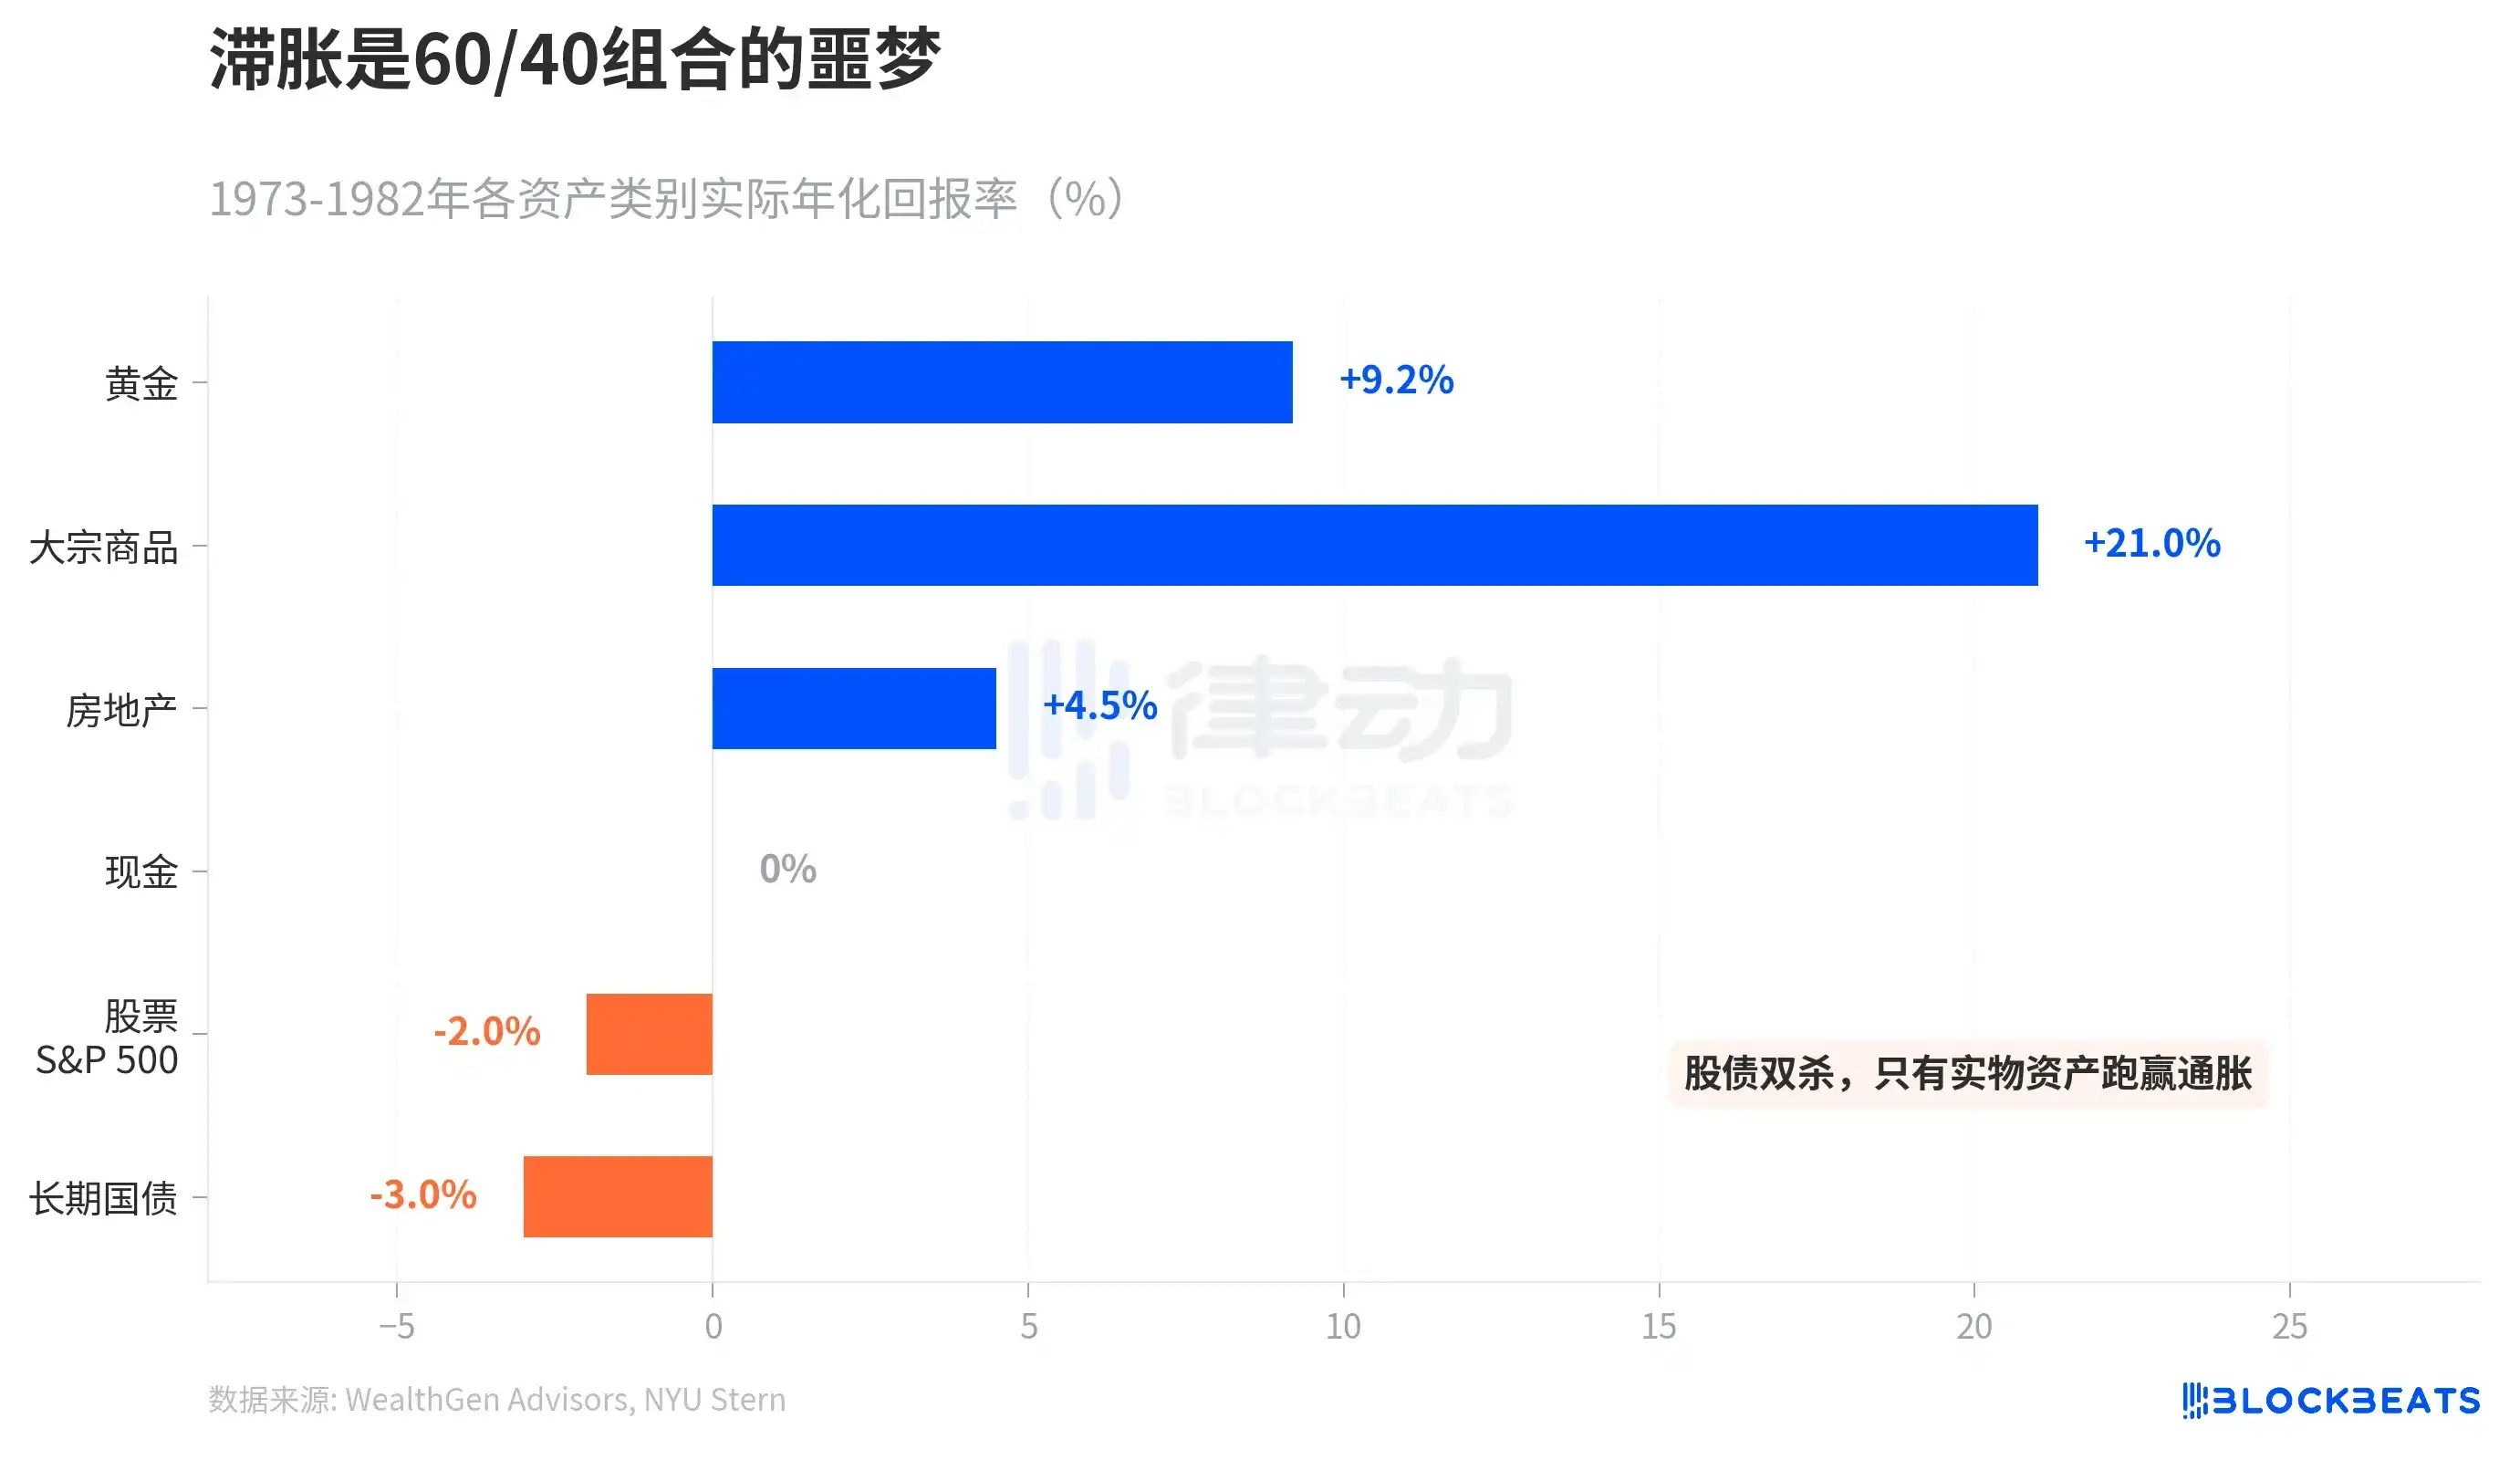
The Great Stagflation from 1973 to 1982 delivered a report card on asset returns. Gold delivered an actual annualized return of +9.2%, the commodities index (S&P GSCI) surged 586% over the decade, and real estate gained +4.5%. In contrast, the S&P 500's actual annualized return was -2%, and long-term Treasuries returned -3%. According to NYU Stern historical data, long-term Treasuries suffered a -8.6% loss in 1979 alone.

The traditional 60/40 investment portfolio (60% stocks + 40% bonds) was caught in a squeeze during stagflation. Only physical assets outperformed inflation. Société Générale predicts Brent will average $125 in April, with a "credible peak" of $150. Goldman Sachs is slightly more moderate, forecasting an April average of $115, but assuming the Strait of Hormuz reopens within six weeks, falling to $80 by year-end.

The bond market has already made a choice for everyone: between inflation and recession, it is betting on recession.

Perguntas relacionadas

QWhy did the 10-year Treasury yield fall sharply despite the surge in oil prices in late March 2026?

AThe bond market experienced a 'flight to safety', with growth risks (fear of recession) beginning to outweigh inflation risks, causing investors to rush into bonds and push yields down.

QWhat historical precedent suggests about the economic outcome following such a sharp oil price increase?

AHistorical cases (1973, 1979, 1990, 2008) show that sharp oil price surges of over 35% were often followed by economic recessions or significant slowdowns, with the exception of the 2022 Ukraine war spike which caused high inflation instead.

QHow did the market's expectation for Federal Reserve policy change dramatically within a few days?

AOn March 26, market pricing indicated a 52% probability of a rate hike due to inflation concerns, but by March 30, it had flipped to a 65% probability of a dovish pivot and rate cuts due to weak consumer confidence and manufacturing data.

QWhat is the potential worst-case macroeconomic scenario feared by the market, according to a Cit strategist?

ACit strategist McCormick stated that the worst-case scenario ahead is stagflation, which is bad for both bonds and stocks.

QWhich asset classes historically performed well during the 1973-1982 stagflation period, according to the article?

ADuring the 1973-1982 stagflation, gold delivered a +9.2% real annualized return, the S&P GSCI commodity index rose 586% cumulatively, and real estate returned +4.5%. In contrast, stocks and long-term bonds had negative real returns.

Leituras Relacionadas

The Essence of AI Layoffs: Why More AI Adoption Leads to More Corporate Anxiety?

The author, awaiting potential inclusion on an 8000-person layoff list, analyzes the true nature of recent "AI-driven" layoffs. They argue that while AI use, particularly tools like Claude for code generation, has skyrocketed and boosted developer output (e.g., 2-5x more code commits), this has not translated into proportional business growth or revenue. The core issue is a misalignment between increased "Input" (code) and tangible "Outcomes" (user value, revenue). AI acts as a costly B2B SaaS, inflating operational expenses without guaranteed returns. Two key problems emerge: 1) The friction that once filtered out bad ideas is gone, as AI allows cheap pursuit of even weak concepts. 2) Organizational "alignment tax"—the difficulty of coordinating across teams—becomes crippling when development velocity outpaces consensus-building. Thus, layoffs serve two immediate purposes: 1) To offset ballooning AI costs (Token consumption) and maintain cash flow, as rising input costs without outcome growth destroys unit economics. 2) To reduce organizational bloat and alignment friction by simply removing teams, thereby speeding up execution in the short term. Therefore, these layoffs are fundamentally caused by AI, even if AI doesn't directly replace roles. They represent a painful correction until companies learn to convert AI-driven productivity into real business outcomes and streamline organizational coordination to match the new pace of work. The cycle will continue until this learning curve is mastered.

marsbitHá 34m

The Essence of AI Layoffs: Why More AI Adoption Leads to More Corporate Anxiety?

marsbitHá 34m

Can the Solana Foundation and Google's Collaboration on Pay.sh Bridge the Payment Link Between Web2 and Web3 in the Agent Economy?

Solana Foundation, in collaboration with Google Cloud, has launched Pay.sh, a payment gateway designed to bridge the gap between AI agents and enterprise-grade service infrastructure. The initiative aims to solve a key bottleneck in the "agent economy": existing payment systems are ill-suited for autonomous AI agents. Traditional methods like credit cards require human verification, while newer on-chain protocols like x402 and MPP create a separate, Web3-native system that raises barriers for service providers. Pay.sh functions as a universal payment layer. It allows users to fund a Solana wallet via credit card or stablecoin, which then acts as an identity and payment proxy for AI agents. When an agent needs to access a paid API service (e.g., Google Cloud, Alibaba Cloud), Pay.sh handles the transaction seamlessly. It leverages the HTTP 402 status code ("Payment Required") to initiate payments, intelligently choosing between one-time transfers (x402-style) or session-based authorizations (MPC-style) based on the service's billing model. This spares agents from manual account registration and API key management. A key feature for service providers is low integration effort. They can adopt Pay.sh by providing a declarative configuration file, enabling features like tiered pricing, free tiers, and automatic revenue splitting to multiple addresses (e.g., for royalties, cloud costs). Providers can also list their APIs in a central Pay Skill Registry for agent discovery. The collaboration with Google Cloud provides crucial infrastructure for API proxying, traffic routing, and compliance logging, aiming to keep agent activities within regulated boundaries. By connecting Web2 services with Web3 payment rails, Pay.sh positions the Solana wallet as a foundational identity and payment tool for AI agents, potentially driving more transaction volume to the Solana ecosystem. However, the report notes challenges. The service registry currently lacks robust vetting, risking exposure to unauthorized or malicious third-party APIs. Pay.sh also inherits security and compatibility risks from its underlying payment protocols (x402, MPC). Furthermore, adoption may be hindered by varying regional data privacy and payment compliance regulations among API providers. Despite these hurdles, Pay.sh represents a significant step towards integrating Web2 and Web3 for autonomous agent commerce.

marsbitHá 41m

Can the Solana Foundation and Google's Collaboration on Pay.sh Bridge the Payment Link Between Web2 and Web3 in the Agent Economy?

marsbitHá 41m

Bitcoin's Bull-Bear Cycle Indicator Turns Positive for the First Time in 7 Months: End of Bear Market or False Breakout?

Bitcoin's "Bull-Bear Market Cycle Indicator" from CryptoQuant has turned positive for the first time since October 2025. This gauge, based on the P&L Index relative to its 365-day moving average, suggests a potential shift from a bear market phase. Concurrently, the Bull Score Index rose to a neutral reading of 50 in late April. The indicator's move into positive territory follows a roughly 35% price rebound from a low near $60,000 in February to above $81,000. The recovery over approximately three months was faster than the 12-month period observed during the 2022 bear market. However, analysts caution against premature optimism, citing a historical precedent from March 2022. Back then, the Bull Score Index briefly hit 50, but it proved to be a false signal as Bitcoin's price subsequently plunged further. Structural differences exist in the current cycle, including consistent inflows into spot Bitcoin ETFs and an increase in large holder addresses. Yet, some models, referencing the four-year halving cycle, suggest a potential deeper bottom near $50,000 might still be possible around late 2026. In summary, while on-chain data shows marked improvement and the worst panic may be over, market participants remain cautious. A convincing trend reversal confirmation likely requires Bitcoin to sustainably break above key resistance, such as the 200-day moving average near $82,000.

marsbitHá 48m

Bitcoin's Bull-Bear Cycle Indicator Turns Positive for the First Time in 7 Months: End of Bear Market or False Breakout?

marsbitHá 48m

How to Automate Any Workflow with Claude Skills (Complete Tutorial)

This is a comprehensive guide to mastering Claude Skills, a feature for creating permanent, reusable instruction sets that automate specific workflows. Unlike simple saved prompts, Skills function like trained employees, delivering consistent, high-quality outputs by defining the entire task process, standards, error handling, and output format. The guide is structured in four phases: **Phase 1: Installation (5 minutes).** Skills are folders containing a `SKILL.md` file. The user is instructed to find a relevant Skill online, install it, test it on a real task, and compare its performance to one-off prompts. **Phase 2: Building Your First Custom Skill.** Start by rigorously defining the Skill's purpose, trigger phrases, and providing a concrete example of perfect output. The `SKILL.md` file has two parts: a YAML frontmatter with a specific name/description/triggers, and a detailed, step-by-step workflow written in natural language with examples and quality standards. **Phase 3: Testing & Optimization for Production.** Test the Skill in three scenarios: 1) a standard, common task; 2) edge cases with missing or conflicting data; and 3) a pressure test with maximum complexity. Any failure indicates a needed instruction. Implement a weekly optimization cycle to continuously refine the Skill based on real usage. **Phase 4: Building a Complete Skill Library.** The goal is to create a team of Skills for all repetitive tasks. Examples are given for industries like real estate, marketing, finance, consulting, and e-commerce. The user should list their tasks, prioritize them, and build one new Skill per week, maintaining a master document to track their library. The conclusion emphasizes the compounding time savings: ten Skills saving 30 minutes each per week reclaims over 260 hours (6.5 work weeks) per year, fundamentally transforming one's work system.

marsbitHá 1h

How to Automate Any Workflow with Claude Skills (Complete Tutorial)

marsbitHá 1h

Trading

Spot
Futuros
活动图片