Oversold Rebound Kicks Off New Year's Market; Reducing Positions at Highs is More Prudent | Special Analysis

Odaily星球日报Publicado em 2026-02-16Última atualização em 2026-02-16

Resumo

The article, titled "Oversold Rebound Kicks Off New Year Rally, Reducing Positions on Highs is More Prudent," is a Bitcoin market analysis by特邀分析师 (specially invited analyst) Cody from Odaily. Cody begins by extending New Year's greetings. The core analysis posits that Bitcoin's current price action is part of a larger corrective A-B-C wave structure. The market is currently experiencing a C-2 wave rebound (an upward correction) after completing the C-1 wave decline, which bottomed near $60,000. This rebound is expected to face significant resistance in the $72,000-$74,500 and, more importantly, the $79,500-$80,600 zones. The analyst reviews recent trading performance, noting successful short-term leveraged trades yielding a ~4.01% return and a profitable medium-term short position initiated near $89,000. Technical indicators from proprietary momentum and sentiment models suggest the weekly trend remains bearish (a "downtrend pause"), while daily charts show signs of a short-term oversold rebound. The outlook for the coming week anticipates the C-2 rebound continuing. The key strategy advice for all investors is to "reduce positions on highs to lock in profits" and manage risk." Specific trading plans (Plan A and Plan B) are outlined for entering short positions if the price reaches the mentioned resistance levels. The article concludes with strong risk disclaimers, emphasizing that the analysis is for informational purposes only and not investment advice.

Hello everyone, I'm your old friend, Cody, a special market analyst for Odaily. Before we begin today's Bitcoin market analysis, I'd like to say:

Tomorrow is the first day of the Lunar New Year. I'd like to take this opportunity to wish all our readers a happy and prosperous New Year in advance.

The past year has seen constant market fluctuations, with periods of smooth sailing and tests of repeated volatility. Regardless of your investment results this year, I hope that in the new year, all readers can maintain a stable mindset, clear rhythm, and controlled risks.

Cody also sends his most sincere wishes:

Wishing you all immediate success, immediate blessings, ever-green portfolios, and peace for your families in the new year.

Holidays are brief, but the market never stops.

Returning to the market itself, during this special time window of the Spring Festival, some noteworthy changes are emerging in Bitcoin's price structure, capital behavior, and market sentiment that deserve close attention.
Trading Weekly Report Core Summary:

• Updated Trend Structure: Analysis of the internal C-2 wave movement within Bitcoin's declining C wave, and interpretation of the future C-3 wave decline structure after the rebound ends. (Details in Figure 1)

• Strategy Execution (Short-term) Results Verification: Last week's trading strictly followed the established short-term strategy, completing two short-term operations (1x leverage), successfully achieving a cumulative return of approximately 4.01%. (Details in Table 1)

• Strategy Execution (Medium-term) Results Verification: Last week followed the established medium-term strategy, continuing to hold the short position established at $89,000 (1x leverage). As of last week's close, the profit was approximately 22.71%, with a maximum profit during the period of about 32.58%.

• Core View (Short-term) Verification: Last week, Bitcoin found support near $65,000 and transitioned into a volatile rebound. Multiple technical signals collectively indicated that this level could be the low point of the C-1 wave. The current price action aligns with the previous expectation of an oversold rebound in the C-2 wave, with the market structure gradually transitioning into a repair phase.

The following will provide a detailed review of the market forecast, strategy execution, and specific trading process.

I. Detailed Explanation of Bitcoin's C Wave Internal Three-Stage Correction Structure

Bitcoin Daily K-Line Chart
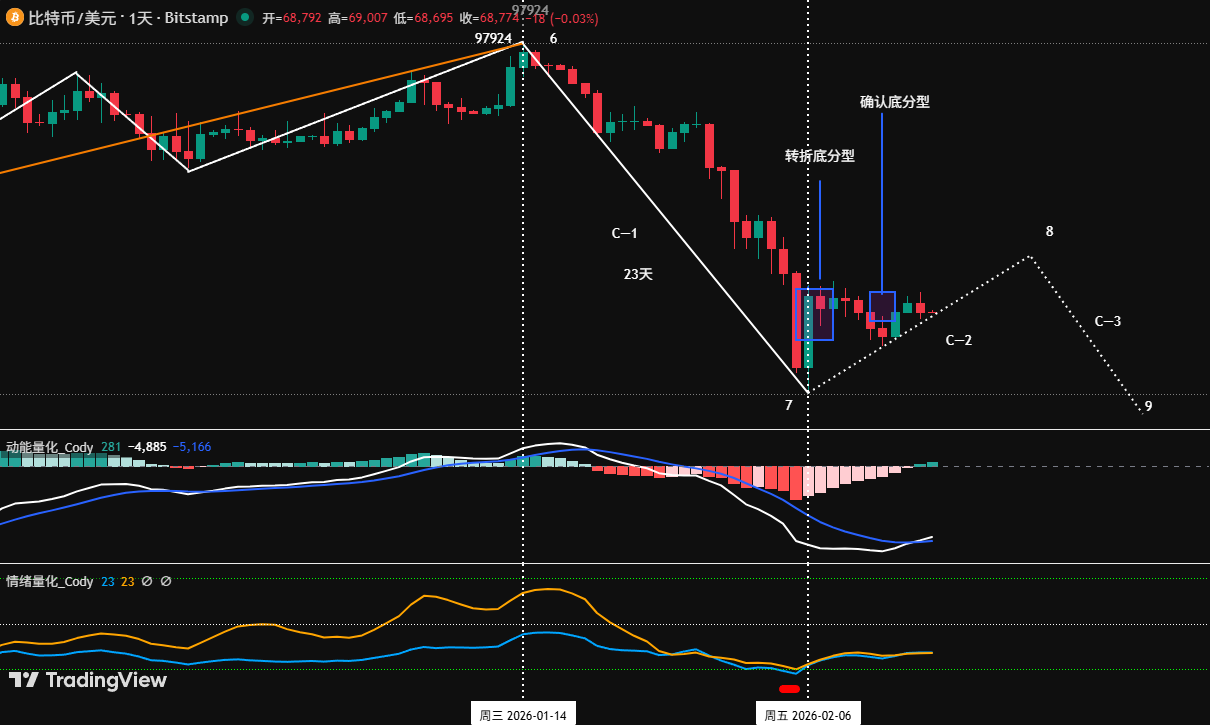
Figure 1

In the weekly review on February 8th, I clearly pointed out that Bitcoin's correction since the high on October 6, 2025, follows the classic A-B-C three-wave structure, and I projected several possible internal movement structures for the subsequent C wave. Currently, given that both the A and B waves internally show clear three-subwave structures, according to the principles of alternation and consistency in Elliott Wave Theory, the probability is highest that the C wave will also complete its correction internally with a three-stage structure (i.e., C-1, C-2, C-3).

Below, we will provide a detailed analysis of the possible three-stage correction structure within the C wave:

1. C Wave Main Decline Segment Overview

• Time and Magnitude: The C wave began on January 14, 2026, and has run for about 32 days as of the time of analysis, with a maximum decline of 38.7%. This conforms to the characteristic of the C wave as the "main declining wave," usually having the largest magnitude and fierce movements.

2. C-1 Wave: Segment 6–7 in the chart, the first driving decline (Completed)

This decline lasted from January 14th to February 6th, spanning 23 days. The target was achieved, driving the price down to near $60,000, forming the first "leg" of the C wave.

3. C-2 Wave: Segment 7–8 in the chart (dashed part), the rebound correction segment (Ongoing)

• Current Stage: The rebound starting from the low on February 6th can currently be defined as the C-2 wave.

• Technical Pattern Confirmation: On the daily chart, the K-line combination formed from February 5th to 8th constitutes a "reversal bottom candlestick pattern", initially hinting at waning downward momentum. Subsequently, the K-lines from February 11th to 13th further formed a "confirmed bottom candlestick pattern", enhancing the validity of February 6th as a short-term bottom. Currently, the price is oscillating upward along the short-term rising trendline connecting the lows of February 6th and 12th. If the market's trajectory changes later, I will share updates with everyone.

• Key Resistance Zone: Based on historical price action, the primary pressure zone for the C-2 rebound is near $74,500. This area is not only the lower edge of the previous震荡中枢 (consolidation center) but also resonates with technical key points like the 50% Fibonacci retracement level of the A wave decline. A more significant pressure zone is located near $79,500. This area is the dense trading zone (震荡中枢) formed during the previous C-1 decline and is expected to pose strong resistance.

4. C-3 Wave: Segment 8–9 in the chart (dashed part), the final decline segment (May occur in the future)

• Technical Pattern Confirmation: On the daily chart, a future effective break below the short-term rising trendline connecting the February 6th and 12th lows by the coin price might be a key condition for judging the formation of the C-3 wave.

• This correction segment will need to break below the February 6th low (approx. $60,000) to achieve wave pattern completeness. The timing and extent of the final decline will be determined by the strength and height of the C-2 wave rebound.

5. Core View Summary:

The market is currently in the expected C-2 wave rebound stage. The strength and height of this rebound, particularly whether it effectively breaks through the core resistance band of $74,500~$79,500, will be a key observation window for judging the subsequent force and target of the C-3 wave decline. Traders should closely monitor the market reaction near the aforementioned price levels.

II. Review of Last Week's Bitcoin Operation Strategy and Key Levels: (02.09~02.15)

1. Short-term Operation Strategy Review: As shown in (Figure 2)

We strictly followed the trading signals issued by our self-constructed spread trading model and momentum quantitative model, combined with market trend forecasts, to complete two short-term operations, achieving a cumulative profit of 4.01%.
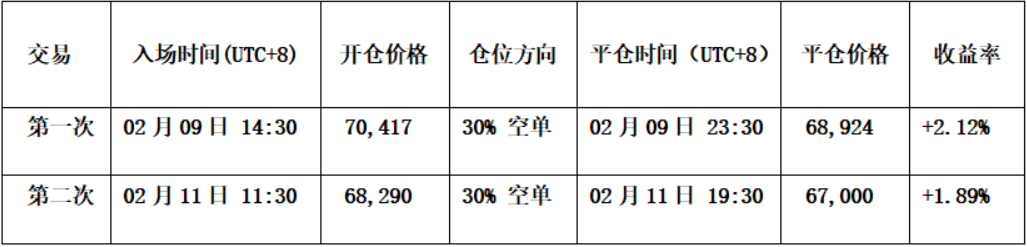
Figure 2

• First Trade (Profit 2.12%):

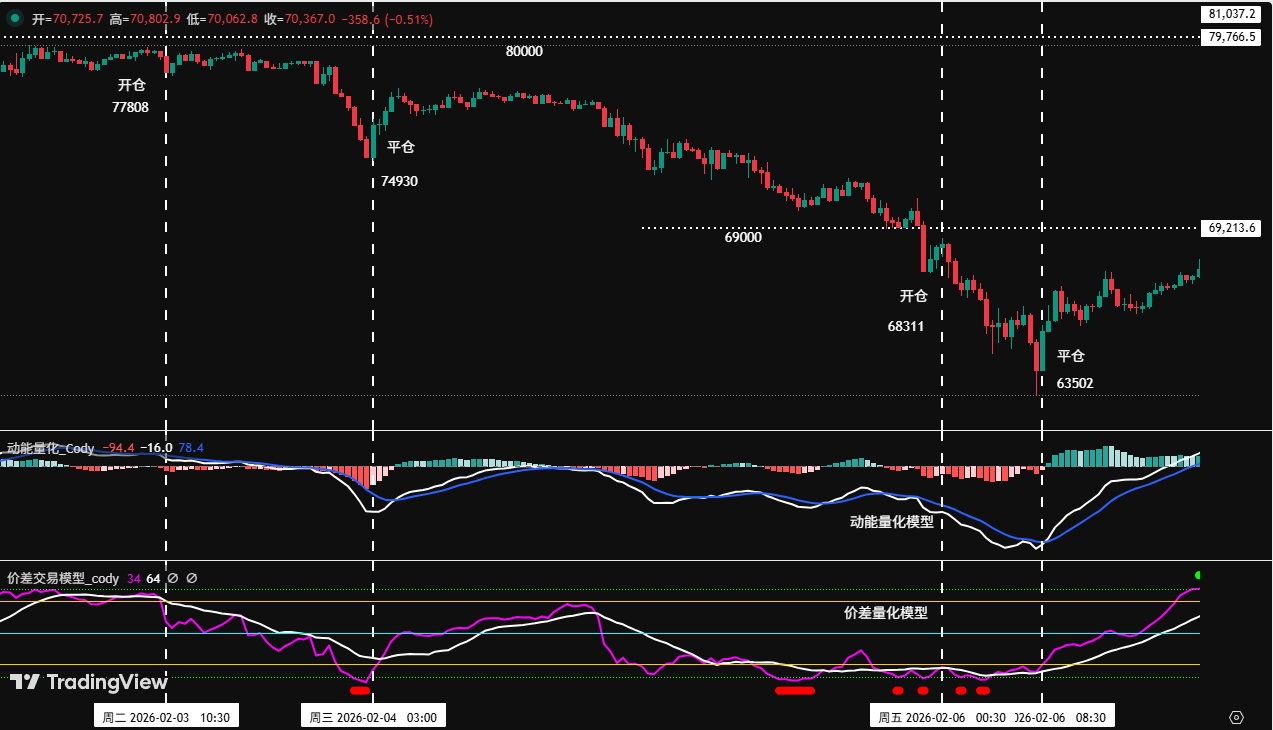
• Entry: The coin price encountered resistance near the $72,500 pressure line during its rebound. Simultaneously, the Spread Quantitative Model triggered a top warning signal (Green Dot), and the Momentum Quantitative Model issued a "bullish to bearish" signal. Therefore, a 30% short position was established at $70,417.

• Risk Control: Initial stop-loss for the short position was set at $74,500.

• Exit: When the price fell to near $68,000, the K-line combination showed bottoming signals,叠加 resonance bottom signals from both models. We closed all positions at $68,924.

• Second Trade (Profit 1.89%):

• Entry: The coin price showed resistance signals near the short-term descending trendline, and the momentum line of the Momentum Quantitative Model formed another "death cross" turning bearish below the zero axis. A 30% short position was established at $68,290.

• Risk Control: Initial stop-loss for the short position was set at $70,000.

• Exit: Upon encountering resistance near $66,500,叠加 resonance bottom signals from both models, all positions were closed at $67,000.

Bitcoin 30-minute K-Line Chart: (Momentum Quantitative Model + Spread Trading Model)
2. Medium-term Operation Strategy Review:

Medium-term Strategy: Continued holding the 60% short position established near $89,000 as planned. As of last week's close, the profit was 22.71%.

3. Core Level Review:

Resistance levels watched the $72,000~$74,500 area;

Support levels watched the $60,000~$62,500 area.

III. Analysis of Current Bitcoin Market Technical Indicators: Comprehensive Judgment Based on Multiple Models and Dimensions

Combining market movements, I conducted an in-depth analysis of multiple technical indicators for Bitcoin from perspectives such as multiple models and multiple dimensions, based on my self-constructed trading system.

1. As shown in (Figure 3), analysis from the weekly chart:

Bitcoin Weekly K-Line Chart: (Momentum Quantitative Model + Sentiment Quantitative Model)
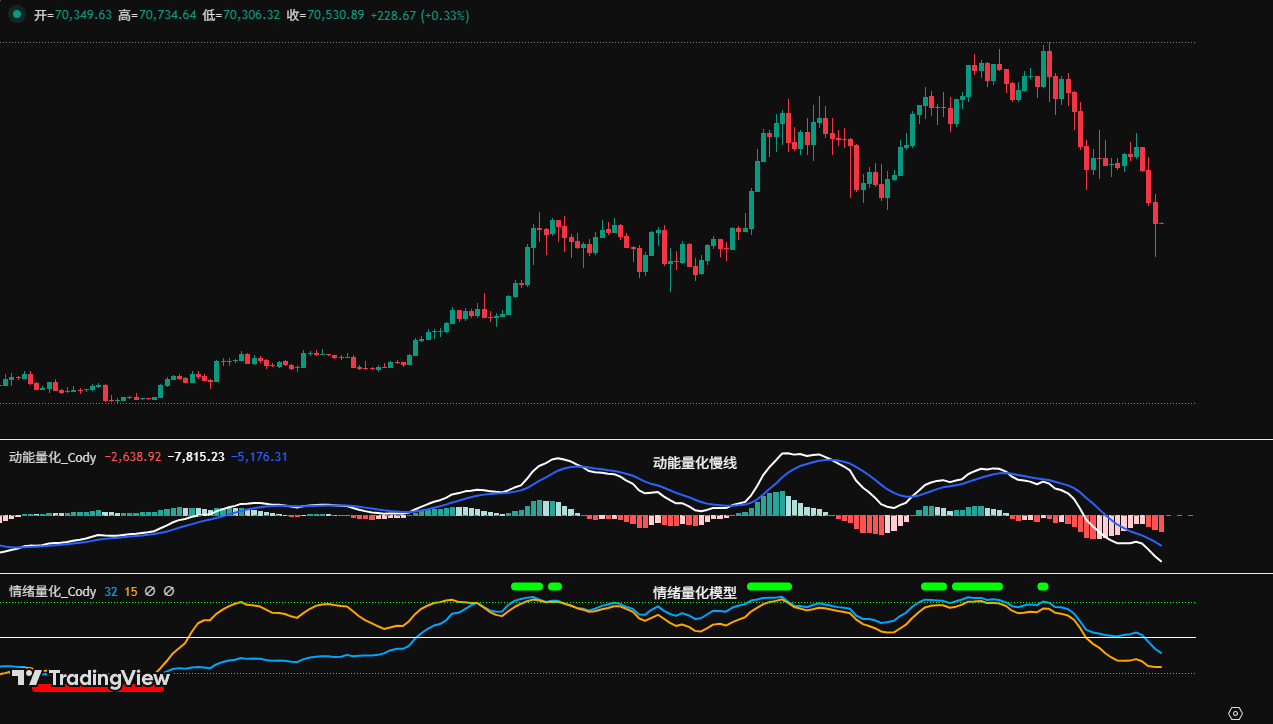
Figure 3

• Momentum Quantitative Model: Technical indicators show the momentum line declining synchronously. The negative energy bars are still expanding, but the expansion force is weakening, with no divergence signal appearing.

Momentum Quantitative Model indicates: High probability of coin price decline

• Sentiment Quantitative Model: Blue sentiment line value 34, intensity zero; Yellow sentiment line value 10, intensity zero; peak value is 0.

Sentiment Quantitative Model indicates: Neutral coin price bottom support index

• Digital Monitoring Model: Bottom digital monitoring signal has not appeared.

Digital Monitoring Model indicates: Digital bottom signal not appeared; Weekly K-line closed as a small bearish candle with upper and lower shadows, down about 2.15%.

The above data suggests: Bitcoin weekly trend is bearish, with narrowing declines. Currently, it is in a下跌中继形态 (falling continuation pattern).

2. As shown in (Figure 4), analysis from the daily chart:

Bitcoin Daily K-Line Chart: (Momentum Quantitative Model + Sentiment Quantitative Model)
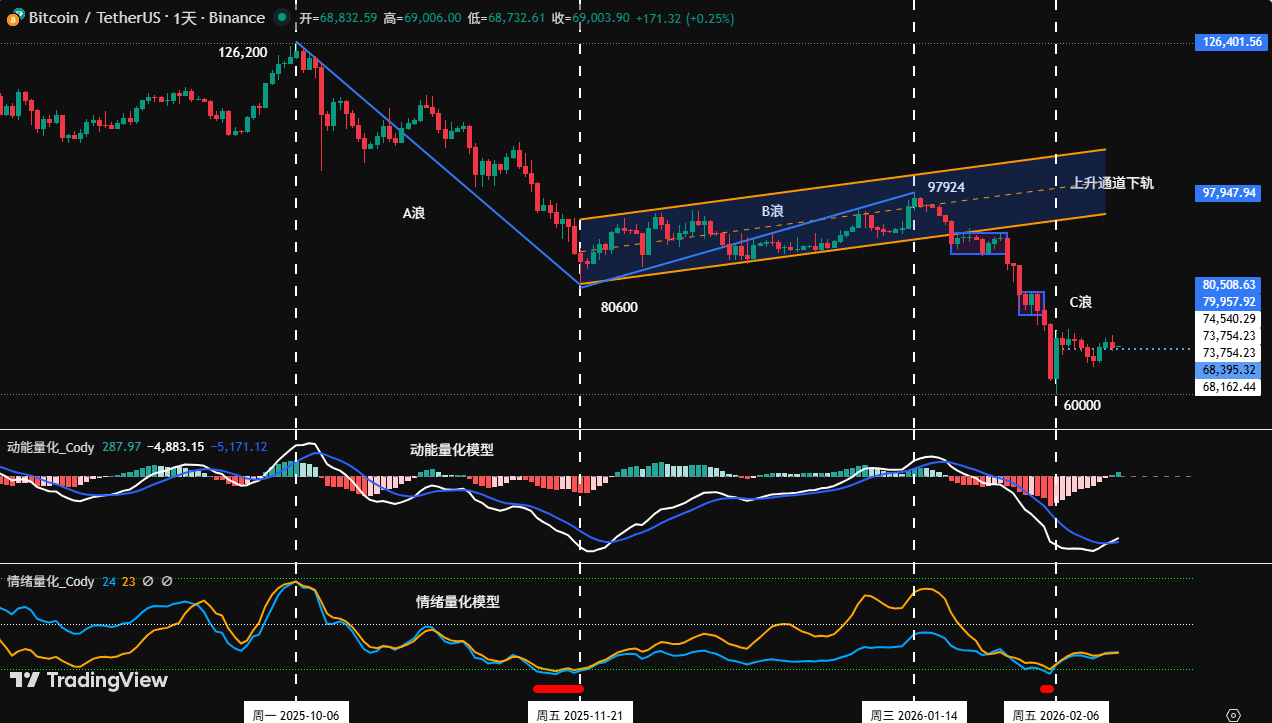
Figure 4

• Momentum Quantitative Model: Last week's overall行情 (market performance) showed a "first suppress then rise" pattern. Post-session on Sunday, the momentum line formed its first "golden cross" below the zero axis, while the volume bars "turned from negative to positive".

Momentum Quantitative Model indicates: Bullish momentum is beginning to accumulate; short-term trend is expected to gradually strengthen.

• Sentiment Quantitative Model: After the sentiment model triggered a bottom warning signal (Red Dot), the two sentiment lines began to拐头向上 (turn upward). Post-session last Sunday, the sentiment lines left the oversold area and turned to a slow ascent.

Sentiment Quantitative Model indicates: The timeliness of the bottom warning signal has been verified by the market. Sentiment lines are slowly turning upward, indicating repaired oversold market sentiment.

The above data提示 (suggests): The daily level bearish trend has not changed. The current movement is of an oversold rebound nature. A minor rebound can currently be observed; please control the size of short-term long positions.

IV. This Week's Market Forecast: (02.16~02.22)

1. This Week's Core View: The C-2 wave rebound行情 (market) has most likely formed. Pay attention to the performance of the bull-bear struggle when the coin price rebounds to the core pressure zone.

• For investors who participated in this short-term rebound, the strategy should be to "reduce positions at highs, lock in profits";

• For investors trapped in positions earlier, they should resolutely execute "reduce positions at highs, trade滚动操作 (rolling operations), control risks".

2. Core Resistance Levels:

• First Resistance Area: $72,000-$74,500 area (near last April's low)

• Second Resistance Area: $79,500-$80,600 area (near the B wave starting point)

3. Core Support Levels:

• First Support Level: Near $65,000 (low point of the previous K-line bottom candlestick pattern)

• Second Support Level: $60,000-$62,500 area (near the February 6th low)

• Third Support Level: Near $57,400 (near the 210-week moving average)

V. This Week's Operation Strategy (Excluding Impact of Sudden News): (02.16~02.22)

1. Medium-term Strategy: Maintain 60% short position. If the rebound effectively breaks through $74,500, reduce the position to 40%.

2. Short-term Strategy: Use 30% of capital, set stop-loss points, and look for "spread" opportunities based on support and resistance levels. (Use 30/60 minutes as the operation cycle).

3. Since the medium-term market direction is bearish, short-term operations should follow the principle of "go with the trend, go short at highs". To dynamically respond to the market's complex evolution and combine signals from the self-built trading model, we have formulated A/B two sets of short-term operation plans:

Plan A: If the coin price encounters resistance in the $72,500~$74,500 area during its rebound:

• Entry: When the rebound encounters resistance in this area and triggers a signal combined with the model's top signal, a 15% short position can be established.

• Risk Control: Initial stop-loss for the short position is set 1.5% above the entry price (i.e., 1.015 * entry price).

• Exit: When the price falls near important support levels combined with model signals, gradually close positions to take profits.

Plan B: If the coin price encounters resistance in the $79,500~$80,600 area during its rebound:

• Entry: When the rebound encounters resistance in this area combined with the model's top signal, a 30% short position can be established.

• Risk Control: Initial stop-loss for the short position is set 1.5% above the entry price (i.e., 1.015 * entry price).

• Exit: When the price falls to support levels combined with model signals, gradually close positions to take profits.

VI. Special Notes:

1. When opening a position: Immediately set the initial stop-loss level.

2. When profit reaches 1%: Move the stop-loss to the entry cost price (breakeven point) to ensure capital safety.

3. When profit reaches 2%: Move the stop-loss to the position of 1% profit.

4. Continuous Tracking: Thereafter, for every additional 1% profit the coin price makes, move the stop-loss up by 1%同步移动 (synchronously), dynamically protecting and locking in profits.

Financial markets change rapidly. All market analysis and trading strategies require dynamic adjustment. All views, analytical models, and operational strategies involved in this article are derived from personal technical analysis, intended solely for personal trading log purposes, and do not constitute any investment advice or operational basis. The market involves risks, investment requires caution. Please do not make decisions based solely on this.


Criptomoedas em alta

Perguntas relacionadas

QWhat is the current wave structure of Bitcoin's price movement according to the analyst, and which sub-wave is currently in progress?

AAccording to the analyst, Bitcoin's price adjustment follows a classic A-B-C three-wave structure. The C wave is the main declining wave, and its internal structure is unfolding in three sub-waves: C-1, C-2, and C-3. The C-1 wave (the first driving decline) is already complete. The market is currently in the expected C-2 wave, which is a rebound correction phase.

QWhat are the key resistance levels identified for the ongoing C-2 rebound?

AThe key resistance area for the C-2 rebound is between 74,500 USD and 79,500 USD. The 74,500 USD level is the first pressure zone, near the lower edge of a previous震荡中枢 (consolidation zone) and aligns with the 50% Fibonacci retracement of the A wave decline. The more important pressure area is around 79,500 USD, which was a dense trading area formed during the previous C-1 decline.

QWhat was the outcome of the short-term trading strategy executed in the previous week?

AThe short-term strategy, which followed signals from the proprietary Spread Trading Model and Momentum Quant Model, was executed twice with 30% position size each time (using 1x leverage). The first trade resulted in a profit of 2.12%, and the second trade resulted in a profit of 1.89%, yielding a cumulative return of approximately 4.01% for the week.

QWhat is the core weekly trading advice for investors who participated in the short-term rebound or are holding losing positions?

AThe core advice for the week is to 'sell on rallies to lock in profits' for those who participated in the short-term rebound, and to 'resolutely reduce positions on rallies, operate dynamically, and control risks' for investors who are holding losing positions from earlier.

QWhat are the two proposed short-term trading plans (Plan A and Plan B) for the upcoming week?

APlan A: If the price rebounds to the 72,500 - 74,500 USD area and shows signs of resistance, combined with a model top signal, establish a 15% short position. Plan B: If the price rebounds to the 79,500 - 80,600 USD area and shows signs of resistance, combined with a model top signal, establish a 30% short position. Both plans include initial stop-losses set 1.5% above the entry cost and taking profits near support levels based on model signals.

Leituras Relacionadas

After Three Consecutive Quarters of Decline, Can the Crypto Market Find a Window for Stabilization in Q3?

The cryptocurrency market has just concluded its worst-performing quarter since 2022, with total capitalization dropping 12.6% to $2.1 trillion. All core metrics indicate capital is leaving the sector, not just rotating within it. Bitcoin fell 14.2% and Ethereum dropped 25.4% in Q2, breaking their previous correlation with US tech stocks. A key driver is the reversal in US spot Bitcoin ETF flows, which saw a net outflow of approximately $4.67 billion in Q2, including a record monthly outflow near $4.5 billion in June. While recent data suggests long-term holders are accumulating again, sustained ETF outflows mean continued selling pressure. Market focus is now singularly on the Federal Reserve. The upcoming July FOMC meeting is seen as the most critical event for Q3. A dovish signal could support Bitcoin reclaiming a $68,000-$84,000 range, while a hawkish stance might establish a new trading band around $50,000-$56,000. Additionally, regulatory uncertainty persists, with the progress of the crucial *CLARITY Act* stalling in the Senate, reducing its perceived 2026 passage probability to 40-45%. Despite the broad downturn, a few sectors showed growth. Prediction markets saw nominal volume surge 48.7% year-over-year to $113.8 billion, and tokenized collectibles transaction volume rose 143% quarterly to $1.4 billion. The Real-World Asset (RWA) tokenization sector also continued steady growth, now representing ~$28.1 billion in on-chain value. The market's foundation for an extreme crash appears limited, with Bitcoin price hovering near its 200-week moving average. However, the trading paradigm has shifted from narrative-driven speculation to decisions based on price action, policy developments, and interest rate expectations, making a broad sentiment-driven rally unlikely in the near term.

marsbitHá 15h

After Three Consecutive Quarters of Decline, Can the Crypto Market Find a Window for Stabilization in Q3?

marsbitHá 15h

BIT Trading Moment: BTC Still Suppressed by Weekly 200 EMA, Rejection May Restart Decline; Storage and Semiconductors that Surged Last Night Begin Falling in Evening Trading

**Crypto & Stock Market Wrap: Bitcoin Tests Resistance, Stocks Retreat After AI Surge** Bitcoin consolidates around $66,000, facing key resistance near $68,000—an area seen as a major psychological and technical hurdle where previous rallies have failed. Analysts note the cryptocurrency is caught between its 200-week moving average (~$63,333) and 200-week EMA (~$68,328). A clear break above $68k is needed to signal a stronger bullish trend, while a rejection could lead to a retest of $63k support. Market sentiment remains cautious, with low futures open interest pointing to a low-liquidity rebound rather than a full bull market. Bitcoin spot ETFs saw another $203 million inflow. US stock futures pointed lower after a strong Tuesday session led by a massive rebound in semiconductors and memory stocks. The rally was fueled by renewed optimism about AI-driven hardware demand, with Micron, SanDisk, and SK Hynix surging. However, those gains reversed in pre-market trading. Super Micro Computer (SMCI) soared over 20% after hours on strong guidance and a record backlog. Other standouts included Rocket Lab and nuclear energy plays Oklo and X-Energy. Rising oil prices (Brent above $91) and climbing Treasury yields (10-year near 4.64%), however, are reigniting inflation concerns and acting as a headwind for equities. In Asia, markets were mixed. South Korea's KOSPI pared early gains to close slightly higher as semiconductor stocks like SK Hynix gave back initial surges. Japan's Nikkei edged lower as the yen hit a fresh 38-year low against the dollar, raising fears of potential market intervention. Key events to watch include the Samsung Galaxy launch, AMD's AI event, and a slew of major tech earnings from Alphabet, Tesla, and IBM after the close on Wednesday, followed by the ECB meeting and Intel's earnings on Thursday.

marsbitHá 15h

BIT Trading Moment: BTC Still Suppressed by Weekly 200 EMA, Rejection May Restart Decline; Storage and Semiconductors that Surged Last Night Begin Falling in Evening Trading

marsbitHá 15h

Former CFTC Chairman, Circle President Tarbert: Preaching Long-Termism While Cashing Out $30 Million Himself

Former CFTC Chairman and Circle President Heath Tarbert has consistently advocated for a long-term vision in public, urging patience from investors as Circle’s stock price has fallen significantly from its peak. However, it has been revealed that since Circle’s IPO, Tarbert has continuously sold his CRCL shares through pre-arranged trading plans, cashing out approximately $30 million, without making any public market purchases. This contrast between his public messaging and personal actions has drawn criticism. Tarbert joined Circle in July 2023 as Chief Legal Officer, leveraging his regulatory experience to help guide the company through its IPO and expansion. Despite promoting stablecoins as long-term infrastructure, he established a 10b5-1 trading plan just before Circle went public, leading to substantial stock sales over the following year. In March 2026, he initiated another plan to sell more shares. His career trajectory highlights a pattern of moving between high-level regulatory roles and influential positions in the financial sector. After resigning as CFTC Chairman in early 2021, he joined Citadel Securities as Chief Legal Officer just 27 days later, during a period of intense regulatory scrutiny for the firm. He later joined Circle, aiding its efforts to navigate regulatory challenges for its public listing. While Tarbert's expertise in policy and compliance is valuable to companies like Circle, his actions—advocating long-term confidence while personally divesting—raise questions about the alignment between his public statements and his private financial decisions, leaving investors who followed his advice to bear the market risks.

marsbitHá 15h

Former CFTC Chairman, Circle President Tarbert: Preaching Long-Termism While Cashing Out $30 Million Himself

marsbitHá 15h

Gate Research Institute: The 'Wall Street-ization' Wave of Crypto Financial Products – Competition or Integration?

The article titled "Gate Research Institute: Are Crypto Financial Products Sparking a 'Wall Street' Wave—Competition or Convergence?" explores the evolving relationship between the crypto ecosystem and traditional finance (TradFi). The piece begins by reflecting on Bitcoin's original 2009 vision of decentralization, disintermediation, and moving away from banks. It then contrasts this with the 2024 landscape, where key crypto assets like Bitcoin are increasingly held through Wall Street products like ETFs issued by giants like BlackRock. The article questions whether this signifies that TradFi is systematically taking over the rights to issue, price, custody, and distribute crypto financial assets. The core argument is that this is not a zero-sum takeover but rather a bidirectional convergence where each side addresses the other's weaknesses. Crypto offers 24/7 global markets, programmable settlement, and open access but lacks compliant channels, institutional-grade custody, deep fiat liquidity, and mainstream distribution. TradFi possesses these but is constrained by legacy systems, limited operating hours, and slow settlement. Two primary convergence paths are highlighted: * **Path A (CEX to TradFi):** Exemplified by Gate, which has progressed from offering tokenized stocks and CFDs to providing direct, real stock trading (US, Hong Kong, South Korea) within its platform, using USDT. * **Path B (TradFi to Crypto):** Exemplified by Robinhood, which has integrated crypto trading, acquired exchanges like Bitstamp, and is moving traditional assets like stocks onto the blockchain via tokenization and its own Layer 2. Both paths are ultimately competing to become the next-generation, unified financial account—a "super account" where users can seamlessly trade cryptocurrencies, stocks, ETFs, RWA (Real World Assets), and tokenized treasury products in one interface. The growth of RWA and tokenized treasuries (e.g., BlackRock's BUIDL) is presented as the asset-layer fusion, providing stable, yield-bearing assets on-chain and acting as a bridge between the two worlds. In conclusion, the "Wall Street-ization" of crypto is framed as a mutual transformation. Decentralized ideals persist in the protocol layer, while at the application layer, a more efficient, global, and accessible unified capital market is emerging from this convergence. The future competition lies not between crypto exchanges and stockbrokers, but between platforms vying to offer the most comprehensive asset coverage, liquidity, and user experience within a single account.

marsbitHá 15h

Gate Research Institute: The 'Wall Street-ization' Wave of Crypto Financial Products – Competition or Integration?

marsbitHá 15h

Trading

Spot

Artigos em Destaque

O que é $S$

Compreender o SPERO: Uma Visão Abrangente Introdução ao SPERO À medida que o panorama da inovação continua a evoluir, o surgimento de tecnologias web3 e projetos de criptomoeda desempenha um papel fundamental na formação do futuro digital. Um projeto que tem atraído atenção neste campo dinâmico é o SPERO, denotado como SPERO,$$s$. Este artigo tem como objetivo reunir e apresentar informações detalhadas sobre o SPERO, para ajudar entusiastas e investidores a compreender as suas bases, objetivos e inovações nos domínios web3 e cripto. O que é o SPERO,$$s$? O SPERO,$$s$ é um projeto único dentro do espaço cripto que procura aproveitar os princípios da descentralização e da tecnologia blockchain para criar um ecossistema que promove o envolvimento, a utilidade e a inclusão financeira. O projeto é concebido para facilitar interações peer-to-peer de novas maneiras, proporcionando aos utilizadores soluções e serviços financeiros inovadores. No seu núcleo, o SPERO,$$s$ visa capacitar indivíduos ao fornecer ferramentas e plataformas que melhoram a experiência do utilizador no espaço das criptomoedas. Isso inclui a possibilidade de métodos de transação mais flexíveis, a promoção de iniciativas impulsionadas pela comunidade e a criação de caminhos para oportunidades financeiras através de aplicações descentralizadas (dApps). A visão subjacente do SPERO,$$s$ gira em torno da inclusão, visando fechar lacunas dentro das finanças tradicionais enquanto aproveita os benefícios da tecnologia blockchain. Quem é o Criador do SPERO,$$s$? A identidade do criador do SPERO,$$s$ permanece algo obscura, uma vez que existem recursos publicamente disponíveis limitados que fornecem informações detalhadas sobre o(s) seu(s) fundador(es). Esta falta de transparência pode resultar do compromisso do projeto com a descentralização—uma ética que muitos projetos web3 partilham, priorizando contribuições coletivas em vez de reconhecimento individual. Ao centrar as discussões em torno da comunidade e dos seus objetivos coletivos, o SPERO,$$s$ incorpora a essência do empoderamento sem destacar indivíduos específicos. Assim, compreender a ética e a missão do SPERO é mais importante do que identificar um criador singular. Quem são os Investidores do SPERO,$$s$? O SPERO,$$s$ é apoiado por uma diversidade de investidores que vão desde capitalistas de risco a investidores-anjo dedicados a promover a inovação no setor cripto. O foco desses investidores geralmente alinha-se com a missão do SPERO—priorizando projetos que prometem avanço tecnológico social, inclusão financeira e governança descentralizada. Essas fundações de investidores estão tipicamente interessadas em projetos que não apenas oferecem produtos inovadores, mas que também contribuem positivamente para a comunidade blockchain e os seus ecossistemas. O apoio desses investidores reforça o SPERO,$$s$ como um concorrente notável no domínio em rápida evolução dos projetos cripto. Como Funciona o SPERO,$$s$? O SPERO,$$s$ emprega uma estrutura multifacetada que o distingue de projetos de criptomoeda convencionais. Aqui estão algumas das características-chave que sublinham a sua singularidade e inovação: Governança Descentralizada: O SPERO,$$s$ integra modelos de governança descentralizada, capacitando os utilizadores a participar ativamente nos processos de tomada de decisão sobre o futuro do projeto. Esta abordagem promove um sentido de propriedade e responsabilidade entre os membros da comunidade. Utilidade do Token: O SPERO,$$s$ utiliza o seu próprio token de criptomoeda, concebido para servir várias funções dentro do ecossistema. Esses tokens permitem transações, recompensas e a facilitação de serviços oferecidos na plataforma, melhorando o envolvimento e a utilidade gerais. Arquitetura em Camadas: A arquitetura técnica do SPERO,$$s$ suporta modularidade e escalabilidade, permitindo a integração contínua de funcionalidades e aplicações adicionais à medida que o projeto evolui. Esta adaptabilidade é fundamental para manter a relevância no panorama cripto em constante mudança. Envolvimento da Comunidade: O projeto enfatiza iniciativas impulsionadas pela comunidade, empregando mecanismos que incentivam a colaboração e o feedback. Ao nutrir uma comunidade forte, o SPERO,$$s$ pode melhor atender às necessidades dos utilizadores e adaptar-se às tendências do mercado. Foco na Inclusão: Ao oferecer taxas de transação baixas e interfaces amigáveis, o SPERO,$$s$ visa atrair uma base de utilizadores diversificada, incluindo indivíduos que anteriormente podem não ter participado no espaço cripto. Este compromisso com a inclusão alinha-se com a sua missão abrangente de empoderamento através da acessibilidade. Cronologia do SPERO,$$s$ Compreender a história de um projeto fornece insights cruciais sobre a sua trajetória de desenvolvimento e marcos. Abaixo está uma cronologia sugerida que mapeia eventos significativos na evolução do SPERO,$$s$: Fase de Conceituação e Ideação: As ideias iniciais que formam a base do SPERO,$$s$ foram concebidas, alinhando-se de perto com os princípios de descentralização e foco na comunidade dentro da indústria blockchain. Lançamento do Whitepaper do Projeto: Após a fase conceitual, um whitepaper abrangente detalhando a visão, os objetivos e a infraestrutura tecnológica do SPERO,$$s$ foi lançado para atrair o interesse e o feedback da comunidade. Construção da Comunidade e Primeiros Envolvimentos: Esforços ativos de divulgação foram feitos para construir uma comunidade de primeiros adotantes e investidores potenciais, facilitando discussões em torno dos objetivos do projeto e angariando apoio. Evento de Geração de Tokens: O SPERO,$$s$ realizou um evento de geração de tokens (TGE) para distribuir os seus tokens nativos a apoiantes iniciais e estabelecer liquidez inicial dentro do ecossistema. Lançamento da dApp Inicial: A primeira aplicação descentralizada (dApp) associada ao SPERO,$$s$ foi lançada, permitindo que os utilizadores interagissem com as funcionalidades principais da plataforma. Desenvolvimento Contínuo e Parcerias: Atualizações e melhorias contínuas nas ofertas do projeto, incluindo parcerias estratégicas com outros players no espaço blockchain, moldaram o SPERO,$$s$ em um jogador competitivo e em evolução no mercado cripto. Conclusão O SPERO,$$s$ é um testemunho do potencial do web3 e das criptomoedas para revolucionar os sistemas financeiros e capacitar indivíduos. Com um compromisso com a governança descentralizada, o envolvimento da comunidade e funcionalidades inovadoras, abre caminho para um panorama financeiro mais inclusivo. Como em qualquer investimento no espaço cripto em rápida evolução, potenciais investidores e utilizadores são incentivados a pesquisar minuciosamente e a envolver-se de forma ponderada com os desenvolvimentos em curso dentro do SPERO,$$s$. O projeto demonstra o espírito inovador da indústria cripto, convidando a uma exploração mais aprofundada das suas inúmeras possibilidades. Embora a jornada do SPERO,$$s$ ainda esteja a desenrolar-se, os seus princípios fundamentais podem, de facto, influenciar o futuro de como interagimos com a tecnologia, as finanças e uns com os outros em ecossistemas digitais interconectados.

121 Visualizações TotaisPublicado em {updateTime}Atualizado em 2024.12.17

O que é $S$

O que é AGENT S

Agent S: O Futuro da Interação Autónoma no Web3 Introdução No panorama em constante evolução do Web3 e das criptomoedas, as inovações estão constantemente a redefinir a forma como os indivíduos interagem com plataformas digitais. Um projeto pioneiro, o Agent S, promete revolucionar a interação humano-computador através do seu framework aberto e agente. Ao abrir caminho para interações autónomas, o Agent S visa simplificar tarefas complexas, oferecendo aplicações transformadoras em inteligência artificial (IA). Esta exploração detalhada irá aprofundar-se nas complexidades do projeto, nas suas características únicas e nas implicações para o domínio das criptomoedas. O que é o Agent S? O Agent S é um framework aberto e agente, especificamente concebido para abordar três desafios fundamentais na automação de tarefas computacionais: Aquisição de Conhecimento Específico de Domínio: O framework aprende inteligentemente a partir de várias fontes de conhecimento externas e experiências internas. Esta abordagem dupla capacita-o a construir um rico repositório de conhecimento específico de domínio, melhorando o seu desempenho na execução de tarefas. Planeamento ao Longo de Longos Horizontes de Tarefas: O Agent S emprega planeamento hierárquico aumentado por experiência, uma abordagem estratégica que facilita a decomposição e execução eficientes de tarefas intrincadas. Esta característica melhora significativamente a sua capacidade de gerir múltiplas subtarefas de forma eficiente e eficaz. Gestão de Interfaces Dinâmicas e Não Uniformes: O projeto introduz a Interface Agente-Computador (ACI), uma solução inovadora que melhora a interação entre agentes e utilizadores. Utilizando Modelos de Linguagem Multimodais de Grande Escala (MLLMs), o Agent S pode navegar e manipular diversas interfaces gráficas de utilizador de forma fluida. Através destas características pioneiras, o Agent S fornece um framework robusto que aborda as complexidades envolvidas na automação da interação humana com máquinas, preparando o terreno para uma infinidade de aplicações em IA e além. Quem é o Criador do Agent S? Embora o conceito de Agent S seja fundamentalmente inovador, informações específicas sobre o seu criador permanecem elusivas. O criador é atualmente desconhecido, o que destaca ou o estágio nascente do projeto ou a escolha estratégica de manter os membros fundadores em anonimato. Independentemente da anonimidade, o foco permanece nas capacidades e no potencial do framework. Quem são os Investidores do Agent S? Como o Agent S é relativamente novo no ecossistema criptográfico, informações detalhadas sobre os seus investidores e financiadores não estão explicitamente documentadas. A falta de informações disponíveis publicamente sobre as fundações de investimento ou organizações que apoiam o projeto levanta questões sobre a sua estrutura de financiamento e roteiro de desenvolvimento. Compreender o apoio é crucial para avaliar a sustentabilidade do projeto e o seu impacto potencial no mercado. Como Funciona o Agent S? No núcleo do Agent S reside uma tecnologia de ponta que lhe permite funcionar eficazmente em diversos ambientes. O seu modelo operacional é construído em torno de várias características-chave: Interação Humano-Computador Semelhante: O framework oferece planeamento avançado em IA, esforçando-se para tornar as interações com computadores mais intuitivas. Ao imitar o comportamento humano na execução de tarefas, promete elevar as experiências dos utilizadores. Memória Narrativa: Utilizada para aproveitar experiências de alto nível, o Agent S utiliza memória narrativa para acompanhar os históricos de tarefas, melhorando assim os seus processos de tomada de decisão. Memória Episódica: Esta característica fornece aos utilizadores orientações passo a passo, permitindo que o framework ofereça suporte contextual à medida que as tarefas se desenrolam. Suporte para OpenACI: Com a capacidade de funcionar localmente, o Agent S permite que os utilizadores mantenham o controlo sobre as suas interações e fluxos de trabalho, alinhando-se com a ética descentralizada do Web3. Fácil Integração com APIs Externas: A sua versatilidade e compatibilidade com várias plataformas de IA garantem que o Agent S possa integrar-se perfeitamente em ecossistemas tecnológicos existentes, tornando-o uma escolha apelativa para desenvolvedores e organizações. Estas funcionalidades contribuem coletivamente para a posição única do Agent S no espaço cripto, à medida que automatiza tarefas complexas e em múltiplos passos com mínima intervenção humana. À medida que o projeto evolui, as suas potenciais aplicações no Web3 podem redefinir a forma como as interações digitais se desenrolam. Cronologia do Agent S O desenvolvimento e os marcos do Agent S podem ser encapsulados numa cronologia que destaca os seus eventos significativos: 27 de Setembro de 2024: O conceito de Agent S foi lançado num artigo de pesquisa abrangente intitulado “Um Framework Agente Aberto que Usa Computadores como um Humano”, mostrando a base para o projeto. 10 de Outubro de 2024: O artigo de pesquisa foi disponibilizado publicamente no arXiv, oferecendo uma exploração aprofundada do framework e da sua avaliação de desempenho com base no benchmark OSWorld. 12 de Outubro de 2024: Uma apresentação em vídeo foi lançada, proporcionando uma visão visual das capacidades e características do Agent S, envolvendo ainda mais potenciais utilizadores e investidores. Estes marcos na cronologia não apenas ilustram o progresso do Agent S, mas também indicam o seu compromisso com a transparência e o envolvimento da comunidade. Pontos-Chave Sobre o Agent S À medida que o framework Agent S continua a evoluir, várias características-chave destacam-se, sublinhando a sua natureza inovadora e potencial: Framework Inovador: Concebido para proporcionar um uso intuitivo de computadores semelhante à interação humana, o Agent S traz uma abordagem nova à automação de tarefas. Interação Autónoma: A capacidade de interagir autonomamente com computadores através de GUI significa um avanço em direção a soluções computacionais mais inteligentes e eficientes. Automação de Tarefas Complexas: Com a sua metodologia robusta, pode automatizar tarefas complexas e em múltiplos passos, tornando os processos mais rápidos e menos propensos a erros. Melhoria Contínua: Os mecanismos de aprendizagem permitem que o Agent S melhore a partir de experiências passadas, aprimorando continuamente o seu desempenho e eficácia. Versatilidade: A sua adaptabilidade em diferentes ambientes operacionais, como OSWorld e WindowsAgentArena, garante que pode servir uma ampla gama de aplicações. À medida que o Agent S se posiciona no panorama do Web3 e das criptomoedas, o seu potencial para melhorar as capacidades de interação e automatizar processos significa um avanço significativo nas tecnologias de IA. Através do seu framework inovador, o Agent S exemplifica o futuro das interações digitais, prometendo uma experiência mais fluida e eficiente para os utilizadores em diversas indústrias. Conclusão O Agent S representa um ousado avanço na união da IA e do Web3, com a capacidade de redefinir a forma como interagimos com a tecnologia. Embora ainda esteja nas suas fases iniciais, as possibilidades para a sua aplicação são vastas e cativantes. Através do seu framework abrangente que aborda desafios críticos, o Agent S visa trazer interações autónomas para o primeiro plano da experiência digital. À medida que avançamos mais profundamente nos domínios das criptomoedas e da descentralização, projetos como o Agent S desempenharão, sem dúvida, um papel crucial na formação do futuro da tecnologia e da colaboração humano-computador.

735 Visualizações TotaisPublicado em {updateTime}Atualizado em 2025.01.14

O que é AGENT S

Como comprar S

Bem-vindo à HTX.com!Tornámos a compra de Sonic (S) simples e conveniente.Segue o nosso guia passo a passo para iniciar a tua jornada no mundo das criptos.Passo 1: cria a tua conta HTXUtiliza o teu e-mail ou número de telefone para te inscreveres numa conta gratuita na HTX.Desfruta de um processo de inscrição sem complicações e desbloqueia todas as funcionalidades.Obter a minha contaPasso 2: vai para Comprar Cripto e escolhe o teu método de pagamentoCartão de crédito/débito: usa o teu visa ou mastercard para comprar Sonic (S) instantaneamente.Saldo: usa os fundos da tua conta HTX para transacionar sem problemas.Terceiros: adicionamos métodos de pagamento populares, como Google Pay e Apple Pay, para aumentar a conveniência.P2P: transaciona diretamente com outros utilizadores na HTX.Mercado de balcão (OTC): oferecemos serviços personalizados e taxas de câmbio competitivas para os traders.Passo 3: armazena teu Sonic (S)Depois de comprar o teu Sonic (S), armazena-o na tua conta HTX.Alternativamente, podes enviá-lo para outro lugar através de transferência blockchain ou usá-lo para transacionar outras criptomoedas.Passo 4: transaciona Sonic (S)Transaciona facilmente Sonic (S) no mercado à vista da HTX.Acede simplesmente à tua conta, seleciona o teu par de trading, executa as tuas transações e monitoriza em tempo real.Oferecemos uma experiência de fácil utilização tanto para principiantes como para traders experientes.

1.3k Visualizações TotaisPublicado em {updateTime}Atualizado em 2026.06.02

Como comprar S

Discussões

Bem-vindo à Comunidade HTX. Aqui, pode manter-se informado sobre os mais recentes desenvolvimentos da plataforma e obter acesso a análises profissionais de mercado. As opiniões dos utilizadores sobre o preço de S (S) são apresentadas abaixo.

活动图片













