It's Time to Start Making Money Again: The Breakout of the Russell 2000 Index May Sound the Charge for Crypto

marsbitPublicado em 2026-01-13Última atualização em 2026-01-13

Resumo

The Russell 2000 Index, a key benchmark for US small-cap stocks, has broken out to a new all-time high above 2600 points—a move that has preceded major "altcoin seasons" in the past, such as those in 2017 and 2021. This breakout, supported by strong volume and broad participation, signals a return of risk-on sentiment and suggests capital is moving down the risk curve in search of higher returns. Small-cap stocks are highly sensitive to liquidity conditions. Their outperformance indicates that underlying macro liquidity is improving, driven by Federal Reserve actions, Treasury cash deployment, and marginally easier fiscal policy. This liquidity typically flows first into bonds and equities, then into higher-beta assets like small-caps, and finally into alternative assets like cryptocurrencies. The current crypto market—with thin order books, low leverage, and improved infrastructure (such as ETFs and clearer regulation)—is positioned to absorb this incoming liquidity. Historical patterns suggest a 1-3 month lag between Russell breakouts and significant crypto rallies. While each cycle has unique narratives, the underlying mechanism of liquidity-driven risk appetite remains consistent. The Russell 2000’s breakout should not be ignored by crypto traders, as it has historically marked the beginning of a broader altcoin recovery and a potential "super-cycle" characterized by structural support, absorbed pullbacks, and capital rotation into high-beta crypto assets.

Author: Our Crypto Talk

Compiled by: Yuliya, PANews

This article is not about a cryptocurrency chart, nor is it about the narrative of a meme coin, and it doesn't even concern Bitcoin for the moment. What we need to focus on is that the Russell 2000 Index is quietly accomplishing a feat that has only happened twice in its history: achieving a breakout, and thereby driving the return of risk appetite.

If you've been in the market long enough, then you've seen this "movie" more than once.

A Pattern That the Majority Continues to Overlook

History always repeats itself; even if you don't believe in cycles, you should respect this repetitiveness.

  • In 2017, the Russell 2000 Index broke out, and subsequently, the "altcoin season" arrived.

  • In 2021, the Russell 2000 Index broke out again, and subsequently, the "altcoin season" played out once more.

Although the market narratives and the popular tokens were different each time, the underlying driving mechanism was the same.

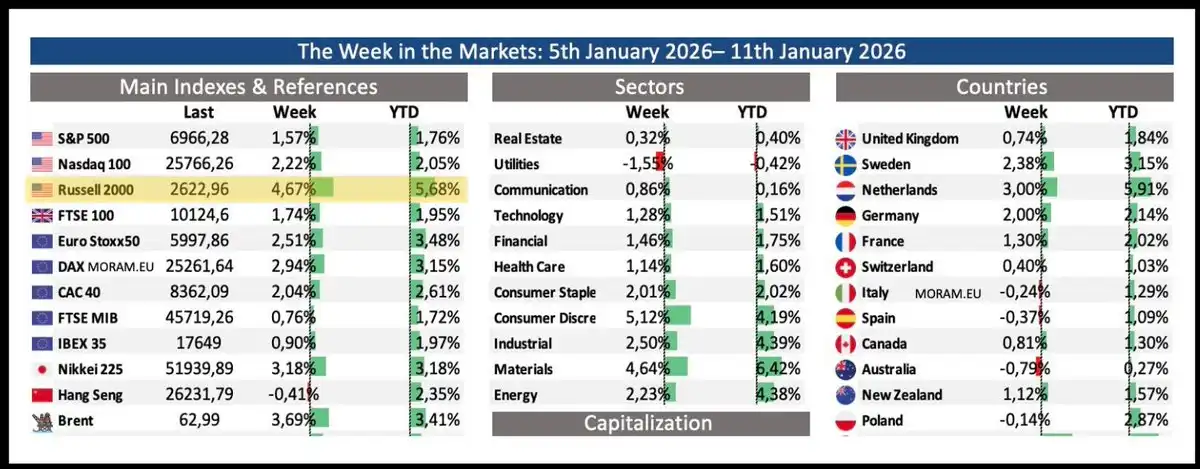
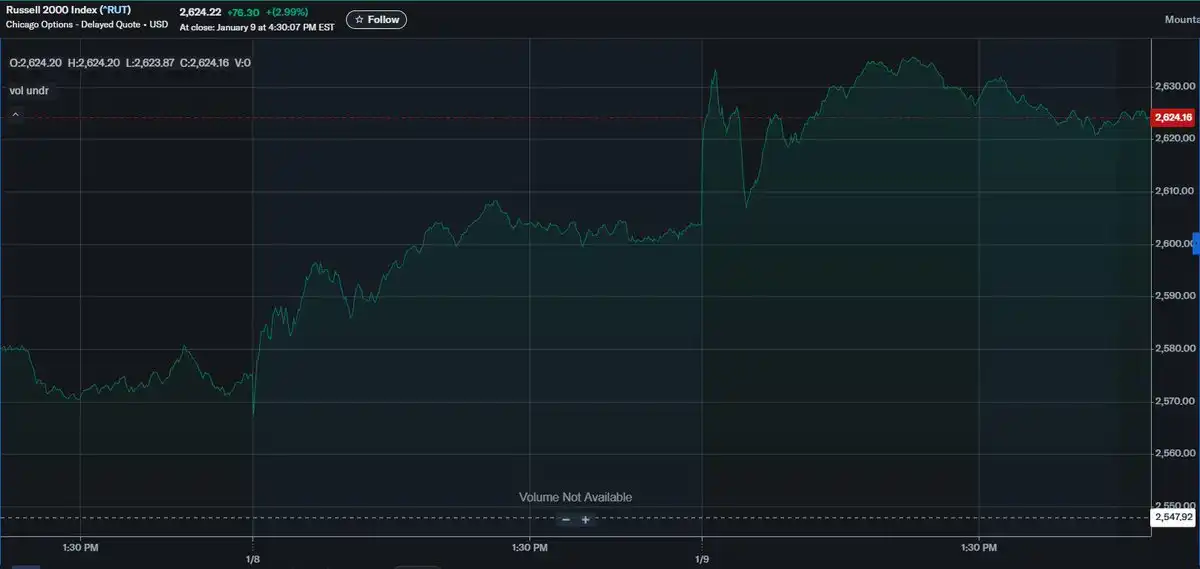
Now, in January 2026, the Russell Index has broken through the 2600-point mark for the first time in history.

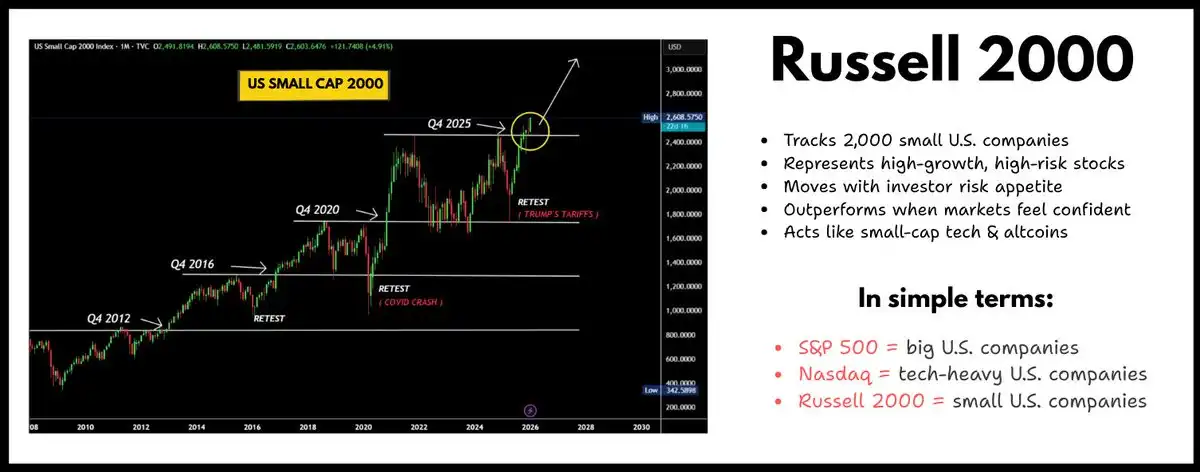
This breakout is not an illusion, nor is it a false fluctuation caused by thin trading during the holidays; it is a comprehensive breakout with huge trading volume and a broad base. The index has risen by approximately 15% year-to-date.

What Does the Russell Index Truly Represent?

Small-cap stocks are not traded based on market sentiment or feeling; it's a trade about liquidity.

The Russell Index tracks about 2000 smaller US companies, including regional banks, industrial enterprises, biotech companies, etc. The survival and development of these enterprises are closely related to the lending environment and growth expectations.

  • When liquidity tightens, these companies are hit hard.

  • When liquidity is loose, they lead the entire market.

This is why in defensive markets, the Russell Index never takes the lead; but when risk appetite returns, it often becomes the frontrunner. Therefore, the breakout of this index is not a simple technical phenomenon; it is a clear signal: capital is moving down the risk curve, seeking higher returns.

This Is Not an Isolated Event: Macro Backdrop Support

Zooming out, you will find that the current macro backdrop fits this movement in a strikingly congruent way.

  • The Federal Reserve is quietly supporting market reserves by purchasing Treasury bills. This is not full-blown quantitative easing (QE), but it is enough to ease funding pressures and inject lubricant into the credit market.

  • The U.S. Treasury is reducing the balance of its General Account (TGA), which means pushing cash back into market circulation rather than withdrawing it.

  • Fiscal policy is gradually easing at the margins, such as larger tax refunds, potential consumer subsidies, and lowering interest rates by purchasing mortgage bonds, thereby releasing the balance sheets of households and businesses.

Individually, none of these measures is a strong "stimulus" signal. But when they converge, they form a powerful liquidity waterfall. And liquidity never stands still.

The True Transmission Path of Liquidity

This is the part people often misunderstand. Liquidity doesn't magically "teleport" from cash to altcoins; it flows in a certain sequence and hierarchy:

  • First, it stabilizes the bond and financing markets.

  • Then, it pushes up the stock market.

  • Next, it seeks higher-beta (higher risk, higher return) assets within the stock market.

  • Only after that does it spill over into alternative assets.

Small-cap stocks are in the middle of this chain. They are riskier than mega-cap stocks, but their logic is clear and easy to understand for institutional investors. When small caps start to outperform, it usually means that capital's gaze has moved beyond "safety" and started chasing "growth".

This is why the breakout of the Russell Index has historically presaged a broader expansion of risk assets. This is not a coincidence, but a mechanical, inevitable transmission process.

Cryptocurrency's Place in This

The cryptocurrency market is not the leader of the liquidity cycle, but an amplifier.

When the Russell Index enters a sustained uptrend, higher-beta assets tend to follow with a lag. Historical data has repeatedly shown that ETH and altcoins typically react one to three months later.

This is not because traders are staring intently at the Russell Index on their trading software (like TradingView), but because the same liquidity that pushes capital into small caps will eventually go looking for assets with higher "convexity" (Convexity, meaning seeking huge potential returns with relatively small risk).

And cryptocurrency, especially a crypto market that has experienced capitulation selling, has thin order book depth, and exhausted selling pressure, is precisely the endpoint of that search. This is exactly the landscape the crypto market faces in early 2026.

Why Does It Feel Different This Time, But the Essence Remains Unchanged?

Every cycle has its reasons for "this time is different".

  • In 2017, it was the excessive bubble of ICOs.

  • In 2021, it was excessive leverage and market froth.

  • In 2026, it's regulatory uncertainty, macroeconomic doubts, and market fatigue.

These surface explanations change, but the rules of capital flow do not.

What is different from the past is that the market's "plumbing system" (i.e., infrastructure) has greatly improved: clearer regulatory frameworks, institutional-grade custody standards, spot ETFs continuously absorbing market supply, and reduced excessive speculative leverage at the market's edges.

Even industry insiders have begun to talk openly about views that were once kept secret. When CZ talks about a potential "super cycle," he is pointing not to hype, but to the synergy of multiple factors: liquidity, regulation, and market structure finally beginning to move in the same direction. This synergy is extremely rare.

The Mistake Crypto-Native Traders Are Making

Most cryptocurrency traders are still staring at crypto charts, waiting for confirmation signals from the market itself. But this is usually too late.

By the time altcoin prices start to spike, the capital rotation has already been completed in other markets. The signal for the return of risk appetite,

first appears in markets that can rise without relying on hype. Small-cap stocks are one such market. They don't pump on memes; they rise because borrowing becomes easier and capital regains confidence.

Therefore, ignoring the Russell Index breakout because "this has nothing to do with crypto" completely misses the point.

The True Meaning of a "Super Cycle"

A "super cycle" does not mean that all assets will rise forever. It means:

  • Structural Support: The rally lasts longer than people expect because it is driven by market structure rather than fleeting狂热情绪 (feverish sentiment).

  • Pullbacks Are Absorbed: Market pullbacks are absorbed by buying interest and do not turn into cascading crashes.

  • Capital Rotation, Not Exit: Capital rotates between different sectors rather than completely exiting the market.

  • High-Beta Assets Come to Life: After years of suppression, high-risk, high-return assets finally get breathing room and room to rise.

This is precisely the environment where altcoins historically stop "bleeding" and begin to re-rate. Not all altcoins will rise, and the gains will not be uniform, but the trend will be decisive.

The Signal Is on the Table

The Russell Index breaking to new all-time highs is no accident. It happens when liquidity is easing, risk tolerance is returning, and capital decides to move out.

  • It did so in 2017.

  • It did so in 2021.

  • It is doing so now.

You don't need to predict specific price targets, nor precisely time the exact moment of rotation. You just need to recognize that when small caps lead the market, it's telling you what comes next.

The crypto market has ignored this signal before, often regretting it months later.

Perguntas relacionadas

QWhat is the significance of the Russell 2000 Index breaking through 2600 points in January 2026, as mentioned in the article?

AThe Russell 2000 Index breaking through 2600 points is significant because it represents a major breakthrough, historically high trading volume, and broad-based participation. This indicates a return of risk appetite, with capital moving down the risk curve in search of higher returns, which has preceded 'altcoin seasons' in the past, such as in 2017 and 2021.

QAccording to the article, what does the Russell 2000 Index primarily represent in the market?

AThe Russell 2000 Index tracks around 2,000 smaller U.S. companies, such as regional banks, industrial firms, and biotech companies. Its performance is a liquidity trade, reflecting the borrowing environment and growth expectations. It leads the market's risk-on sentiment, as capital flows into higher-risk assets when liquidity is ample.

QHow does liquidity flow through the market according to the article, and where do cryptocurrencies fit in this process?

ALiquidity flows in a specific sequence: it first stabilizes bond and financing markets, then pushes up the stock market, seeks higher-beta assets within equities, and finally spills over into alternative assets like cryptocurrencies. Cryptocurrencies act as amplifiers in this cycle, typically reacting one to three months after small-cap stocks like those in the Russell 2000 begin to outperform.

QWhat macro background factors support the Russell 2000 Index's breakout, as outlined in the article?

AKey macro factors include the Federal Reserve's support through Treasury bill purchases, the U.S. Treasury reducing its TGA balance to inject cash into the market, and marginally easier fiscal policies like larger tax refunds and potential consumer subsidies. Together, these create a powerful liquidity flow that benefits risk assets.

QWhat does the term 'super cycle' mean in the context of this article, and how does it relate to current market conditions?

AA 'super cycle' refers to a structurally supported uptrend driven by market infrastructure rather than short-term hype. It features longer duration rallies, buy-side absorption of pullbacks, capital rotation between sectors instead of withdrawal, and revitalization of high-beta assets. This environment allows cryptocurrencies, especially altcoins, to stop bleeding and begin revaluation after years of suppression.

Leituras Relacionadas

The Essence of AI Layoffs: Why More AI Adoption Leads to More Corporate Anxiety?

The author, awaiting potential inclusion on an 8000-person layoff list, analyzes the true nature of recent "AI-driven" layoffs. They argue that while AI use, particularly tools like Claude for code generation, has skyrocketed and boosted developer output (e.g., 2-5x more code commits), this has not translated into proportional business growth or revenue. The core issue is a misalignment between increased "Input" (code) and tangible "Outcomes" (user value, revenue). AI acts as a costly B2B SaaS, inflating operational expenses without guaranteed returns. Two key problems emerge: 1) The friction that once filtered out bad ideas is gone, as AI allows cheap pursuit of even weak concepts. 2) Organizational "alignment tax"—the difficulty of coordinating across teams—becomes crippling when development velocity outpaces consensus-building. Thus, layoffs serve two immediate purposes: 1) To offset ballooning AI costs (Token consumption) and maintain cash flow, as rising input costs without outcome growth destroys unit economics. 2) To reduce organizational bloat and alignment friction by simply removing teams, thereby speeding up execution in the short term. Therefore, these layoffs are fundamentally caused by AI, even if AI doesn't directly replace roles. They represent a painful correction until companies learn to convert AI-driven productivity into real business outcomes and streamline organizational coordination to match the new pace of work. The cycle will continue until this learning curve is mastered.

marsbitHá 1m

The Essence of AI Layoffs: Why More AI Adoption Leads to More Corporate Anxiety?

marsbitHá 1m

Can the Solana Foundation and Google's Collaboration on Pay.sh Bridge the Payment Link Between Web2 and Web3 in the Agent Economy?

Solana Foundation, in collaboration with Google Cloud, has launched Pay.sh, a payment gateway designed to bridge the gap between AI agents and enterprise-grade service infrastructure. The initiative aims to solve a key bottleneck in the "agent economy": existing payment systems are ill-suited for autonomous AI agents. Traditional methods like credit cards require human verification, while newer on-chain protocols like x402 and MPP create a separate, Web3-native system that raises barriers for service providers. Pay.sh functions as a universal payment layer. It allows users to fund a Solana wallet via credit card or stablecoin, which then acts as an identity and payment proxy for AI agents. When an agent needs to access a paid API service (e.g., Google Cloud, Alibaba Cloud), Pay.sh handles the transaction seamlessly. It leverages the HTTP 402 status code ("Payment Required") to initiate payments, intelligently choosing between one-time transfers (x402-style) or session-based authorizations (MPC-style) based on the service's billing model. This spares agents from manual account registration and API key management. A key feature for service providers is low integration effort. They can adopt Pay.sh by providing a declarative configuration file, enabling features like tiered pricing, free tiers, and automatic revenue splitting to multiple addresses (e.g., for royalties, cloud costs). Providers can also list their APIs in a central Pay Skill Registry for agent discovery. The collaboration with Google Cloud provides crucial infrastructure for API proxying, traffic routing, and compliance logging, aiming to keep agent activities within regulated boundaries. By connecting Web2 services with Web3 payment rails, Pay.sh positions the Solana wallet as a foundational identity and payment tool for AI agents, potentially driving more transaction volume to the Solana ecosystem. However, the report notes challenges. The service registry currently lacks robust vetting, risking exposure to unauthorized or malicious third-party APIs. Pay.sh also inherits security and compatibility risks from its underlying payment protocols (x402, MPC). Furthermore, adoption may be hindered by varying regional data privacy and payment compliance regulations among API providers. Despite these hurdles, Pay.sh represents a significant step towards integrating Web2 and Web3 for autonomous agent commerce.

marsbitHá 8m

Can the Solana Foundation and Google's Collaboration on Pay.sh Bridge the Payment Link Between Web2 and Web3 in the Agent Economy?

marsbitHá 8m

Bitcoin's Bull-Bear Cycle Indicator Turns Positive for the First Time in 7 Months: End of Bear Market or False Breakout?

Bitcoin's "Bull-Bear Market Cycle Indicator" from CryptoQuant has turned positive for the first time since October 2025. This gauge, based on the P&L Index relative to its 365-day moving average, suggests a potential shift from a bear market phase. Concurrently, the Bull Score Index rose to a neutral reading of 50 in late April. The indicator's move into positive territory follows a roughly 35% price rebound from a low near $60,000 in February to above $81,000. The recovery over approximately three months was faster than the 12-month period observed during the 2022 bear market. However, analysts caution against premature optimism, citing a historical precedent from March 2022. Back then, the Bull Score Index briefly hit 50, but it proved to be a false signal as Bitcoin's price subsequently plunged further. Structural differences exist in the current cycle, including consistent inflows into spot Bitcoin ETFs and an increase in large holder addresses. Yet, some models, referencing the four-year halving cycle, suggest a potential deeper bottom near $50,000 might still be possible around late 2026. In summary, while on-chain data shows marked improvement and the worst panic may be over, market participants remain cautious. A convincing trend reversal confirmation likely requires Bitcoin to sustainably break above key resistance, such as the 200-day moving average near $82,000.

marsbitHá 15m

Bitcoin's Bull-Bear Cycle Indicator Turns Positive for the First Time in 7 Months: End of Bear Market or False Breakout?

marsbitHá 15m

How to Automate Any Workflow with Claude Skills (Complete Tutorial)

This is a comprehensive guide to mastering Claude Skills, a feature for creating permanent, reusable instruction sets that automate specific workflows. Unlike simple saved prompts, Skills function like trained employees, delivering consistent, high-quality outputs by defining the entire task process, standards, error handling, and output format. The guide is structured in four phases: **Phase 1: Installation (5 minutes).** Skills are folders containing a `SKILL.md` file. The user is instructed to find a relevant Skill online, install it, test it on a real task, and compare its performance to one-off prompts. **Phase 2: Building Your First Custom Skill.** Start by rigorously defining the Skill's purpose, trigger phrases, and providing a concrete example of perfect output. The `SKILL.md` file has two parts: a YAML frontmatter with a specific name/description/triggers, and a detailed, step-by-step workflow written in natural language with examples and quality standards. **Phase 3: Testing & Optimization for Production.** Test the Skill in three scenarios: 1) a standard, common task; 2) edge cases with missing or conflicting data; and 3) a pressure test with maximum complexity. Any failure indicates a needed instruction. Implement a weekly optimization cycle to continuously refine the Skill based on real usage. **Phase 4: Building a Complete Skill Library.** The goal is to create a team of Skills for all repetitive tasks. Examples are given for industries like real estate, marketing, finance, consulting, and e-commerce. The user should list their tasks, prioritize them, and build one new Skill per week, maintaining a master document to track their library. The conclusion emphasizes the compounding time savings: ten Skills saving 30 minutes each per week reclaims over 260 hours (6.5 work weeks) per year, fundamentally transforming one's work system.

marsbitHá 39m

How to Automate Any Workflow with Claude Skills (Complete Tutorial)

marsbitHá 39m

Trading

Spot
Futuros
活动图片