Is This The Bitcoin Price Bottom Or A Fakeout? Analyst Reveals When You Shouldn’t Be Excited

bitcoinistPublicado em 2026-03-20Última atualização em 2026-03-20

Resumo

Bitcoin's recent rally above $75,000 has sparked optimism, but analyst Ardi warns this may be a typical bear market fakeout rather than a true bottom. He argues that such breakouts often form lower highs in downtrends, citing five relief rallies during the 2022 bear market that ultimately led to further declines. Ardi emphasizes that bear markets aren't solely tied to four-year cycles but follow structural patterns—typically 3 years of gains followed by 9-12 months of consolidation. For a genuine bullish reversal, Bitcoin must reclaim $85,000 and surpass $96,000 by over 3%. Until then, he considers this bounce insufficient evidence of a sustained upward move, cautioning that short-term strength often precedes more downside in macro bear markets.

The recent Bitcoin price rebound has reignited optimism, but not everyone is convinced the market has turned around. While price has shown signs of a breakout, a crypto analyst notes that BTC’s macro setup still resembles a typical bear market structure. The key question remains whether the recent upside move signals a true price bottom or simply another temporary rally before further downside.

Why The Bitcoin Price Breakout Is Not A Bullish Reversal

In an X post on Tuesday, March 17, crypto analyst Ardi argued that traders are misinterpreting Bitcoin’s recent rally above $75,000 by assuming that any breakout automatically signals the end of a bear market. He explained that these types of price spikes are part of how bear markets typically function.

The analyst noted that breakouts usually form macro lower highs during a downtrend. He emphasized that these price rallies can appear strong at first, but they usually don’t last and tend to set the stage for the next downward move.

Backing this up, Ardi pointed to Bitcoin’s price action in 2018 and 2022 as a clear example. After reaching all-time highs in both years, the market entered a steady decline, creating a series of lower highs. He noted that in both bear market cycles, there were approximately five relief rallies.

Source: Chart from Ardi on X

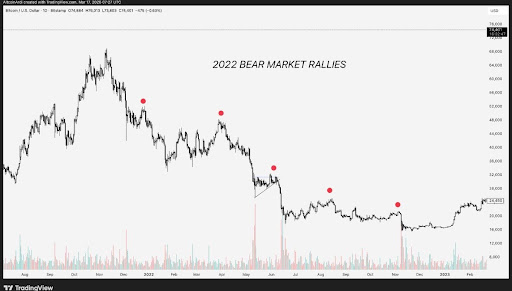
Sharing a chart showing Bitcoin’s rebounds during the 2022 bear market, the analyst showed that the cryptocurrency experienced sharp spikes in January, April, June, August, and November. Each of these rebounds had temporarily pushed the price up, but none reversed the overall downtrend. He added that at every bounce, selling pressure returned, driving the market even lower.

Ardi noted that this recent spike is the first bounce Bitcoin has experienced in five months, so its timing is not unexpected. He also highlighted that many traders have already adjusted their outlook, closing bearish positions after just one green run. In his view, this reaction shows a lack of a well-grounded trading thesis.

Analyst Reveals What Actually Confirms A Bottom

When asked about the basis for his bearish outlook, Ardi rejected the idea that Bitcoin’s behavior is only tied to the four-year cycle theory. The analyst said that bear markets are not dependent on this cyclical concept and would exist regardless of the narrative. He emphasized that market structure and time-based patterns carry more weight.

Ardi explained that a typical market includes roughly three years of upward movement, followed by a shorter phase of decline or consolidation. This period generally lasts 9 to 12 months and is characterized by lower volatility and sideways price action. During this period, the market develops the conditions necessary for a longer-term reversal.

The crypto analyst also outlined specific levels that Bitcoin would need to reclaim before he would consider a bottom and a subsequent bullish shift. He noted that the cryptocurrency would have to move above $85,000 and then surpass $96,000 by more than 3% to indicate a genuine change in momentum.

Without meeting at least one of these conditions, he believes the market has not provided enough evidence to support a sustained upward move. Until that happens, Ardi maintains that Bitcoin’s price bounce does not confirm a market bottom. The 2022 bear market chart demonstrates that multiple rallies can occur within a broader downtrend, and that short-term strength alone isn’t enough to signal a lasting price reversal.

BTC trading at $70,128 on the 1D chart | Source: BTCUSDT on Tradingview.com

Perguntas relacionadas

QAccording to the analyst Ardi, why is the recent Bitcoin price breakout not necessarily a bullish reversal?

ABecause breakouts that form macro lower highs are a normal part of bear market structure, often appearing strong at first but not lasting and tending to set the stage for the next downward move.

QHow many relief rallies did the analyst note occurred in the 2018 and 2022 Bitcoin bear market cycles?

AApproximately five relief rallies occurred in both the 2018 and 2022 bear market cycles.

QWhat two specific price levels does the analyst say Bitcoin must reclaim to confirm a genuine bottom and bullish shift?

ABitcoin would need to move above $85,000 and then surpass $96,000 by more than 3%.

QWhat does the analyst argue is more important than the four-year cycle theory in determining a bear market?

AMarket structure and time-based patterns carry more weight than the four-year cycle theory.

QWhat is the typical duration and characteristic of the decline/consolidation phase that follows three years of upward movement, according to the analyst?

AThe decline or consolidation phase typically lasts 9 to 12 months and is characterized by lower volatility and sideways price action.

Leituras Relacionadas

Trading

Spot
Futuros

Artigos em Destaque

Como comprar T

Bem-vindo à HTX.com!Tornámos a compra de Threshold Network Token (T) simples e conveniente.Segue o nosso guia passo a passo para iniciar a tua jornada no mundo das criptos.Passo 1: cria a tua conta HTXUtiliza o teu e-mail ou número de telefone para te inscreveres numa conta gratuita na HTX.Desfruta de um processo de inscrição sem complicações e desbloqueia todas as funcionalidades.Obter a minha contaPasso 2: vai para Comprar Cripto e escolhe o teu método de pagamentoCartão de crédito/débito: usa o teu visa ou mastercard para comprar Threshold Network Token (T) instantaneamente.Saldo: usa os fundos da tua conta HTX para transacionar sem problemas.Terceiros: adicionamos métodos de pagamento populares, como Google Pay e Apple Pay, para aumentar a conveniência.P2P: transaciona diretamente com outros utilizadores na HTX.Mercado de balcão (OTC): oferecemos serviços personalizados e taxas de câmbio competitivas para os traders.Passo 3: armazena teu Threshold Network Token (T)Depois de comprar o teu Threshold Network Token (T), armazena-o na tua conta HTX.Alternativamente, podes enviá-lo para outro lugar através de transferência blockchain ou usá-lo para transacionar outras criptomoedas.Passo 4: transaciona Threshold Network Token (T)Transaciona facilmente Threshold Network Token (T) no mercado à vista da HTX.Acede simplesmente à tua conta, seleciona o teu par de trading, executa as tuas transações e monitoriza em tempo real.Oferecemos uma experiência de fácil utilização tanto para principiantes como para traders experientes.

378 Visualizações TotaisPublicado em {updateTime}Atualizado em 2025.03.21

Como comprar T

Discussões

Bem-vindo à Comunidade HTX. Aqui, pode manter-se informado sobre os mais recentes desenvolvimentos da plataforma e obter acesso a análises profissionais de mercado. As opiniões dos utilizadores sobre o preço de T (T) são apresentadas abaixo.

活动图片