For most of its history, Bitcoin price discovery was dominated by spot exchanges, offshore perpetual futures, and crypto-native derivatives venues. That is no longer the full story.
Since the approval of U.S. spot Bitcoin ETFs in 2024, Bitcoin has increasingly moved into traditional financial rails, where advisors, asset managers, hedge funds, banks, and structured product desks can access exposure through familiar instruments.
This progression is not accidental. Equity markets, FX, commodities, rates, every mature financial market has progressed along this path: spot markets first, followed by futures, and ultimately options. Options are the last layer to scale because they require the deepest liquidity, the most sophisticated risk management, and the broadest base of end-users (hedgers, overwriters, dealers, vol arbs). When options open interest rivals or exceeds futures notional, the asset has graduated.
At Glassnode, we've now expanded our options coverage to IBIT, bringing the same institutional-grade volatility intelligence used across crypto-native options markets to the largest U.S. spot Bitcoin ETF.
View the new metrics in Glassnode Studio. Available to all Professional plan users.
Understanding IBIT Options
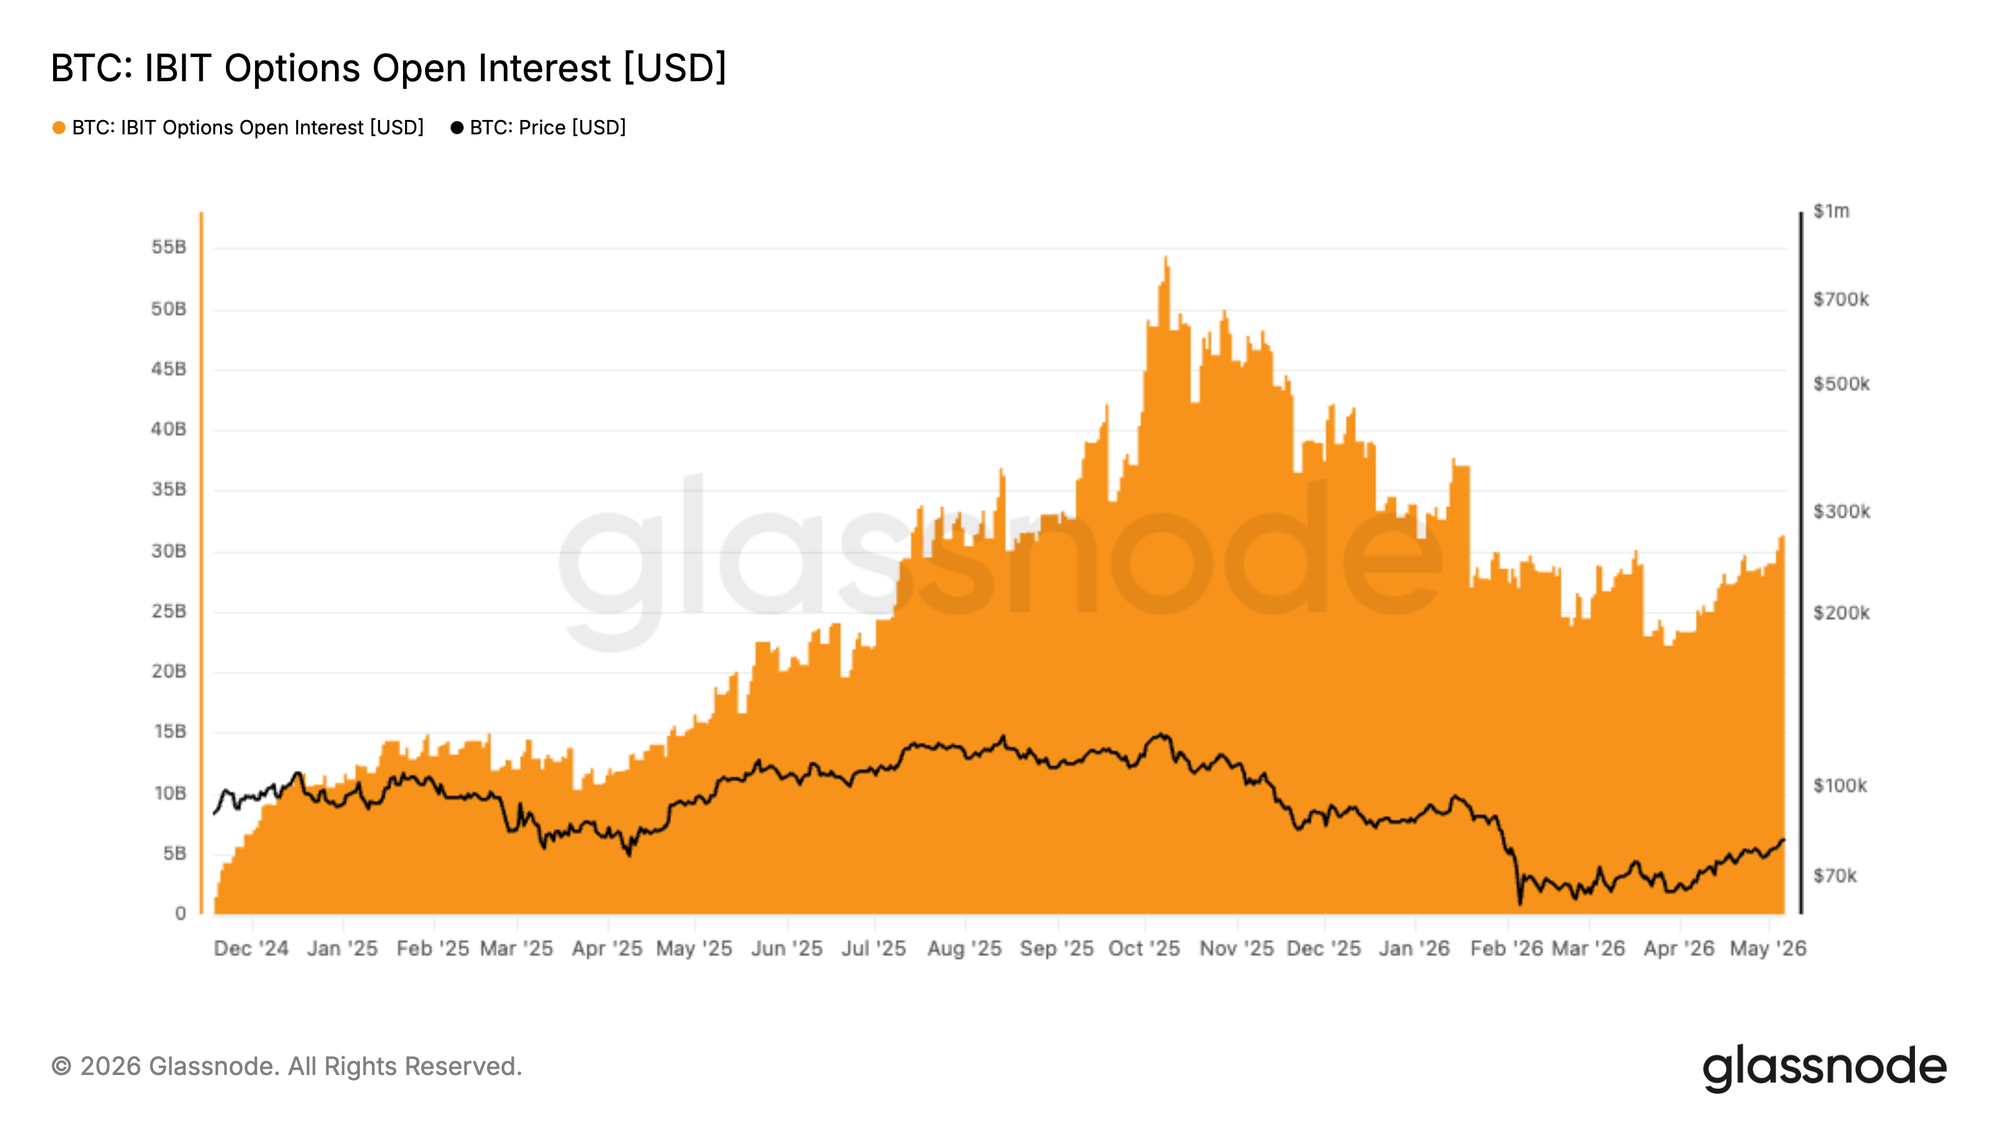
The approval of U.S. spot Bitcoin ETFs in 2024 was a watershed moment for crypto markets. Reuters described the decision as a major step for crypto’s mainstream acceptance, giving investors a regulated ETF wrapper for Bitcoin exposure. Since then, professional investors have increasingly used ETFs as the access layer for Bitcoin. BlackRock’s iShares Bitcoin Trust ETF, IBIT, has become the largest and most liquid U.S. spot Bitcoin ETF. As of April 29, 2026, IBIT reported more than $61.1B in net assets and a 30-day average daily volume above 41M shares.
Options are the next logical step.
Once an asset reaches sufficient scale in spot markets, participants require tools to hedge exposure, monetize volatility, structure positions, and express views across different time horizons. That is exactly what IBIT options enable.
- For asset managers, IBIT options can support hedging and portfolio overlays.
- For volatility traders, they create a listed U.S. market for Bitcoin-linked implied volatility.
- For structured-product desks, they provide inputs for payoff construction.
- For analysts, they offer a new source of information about institutional positioning and risk appetite.
Recent market data illustrates how quickly this market is maturing. IBIT options open interest was reported at around $27.6B, briefly surpassing Deribit’s Bitcoin options open interest of around $26.9B — a major milestone for U.S.-listed, regulated Bitcoin derivatives.
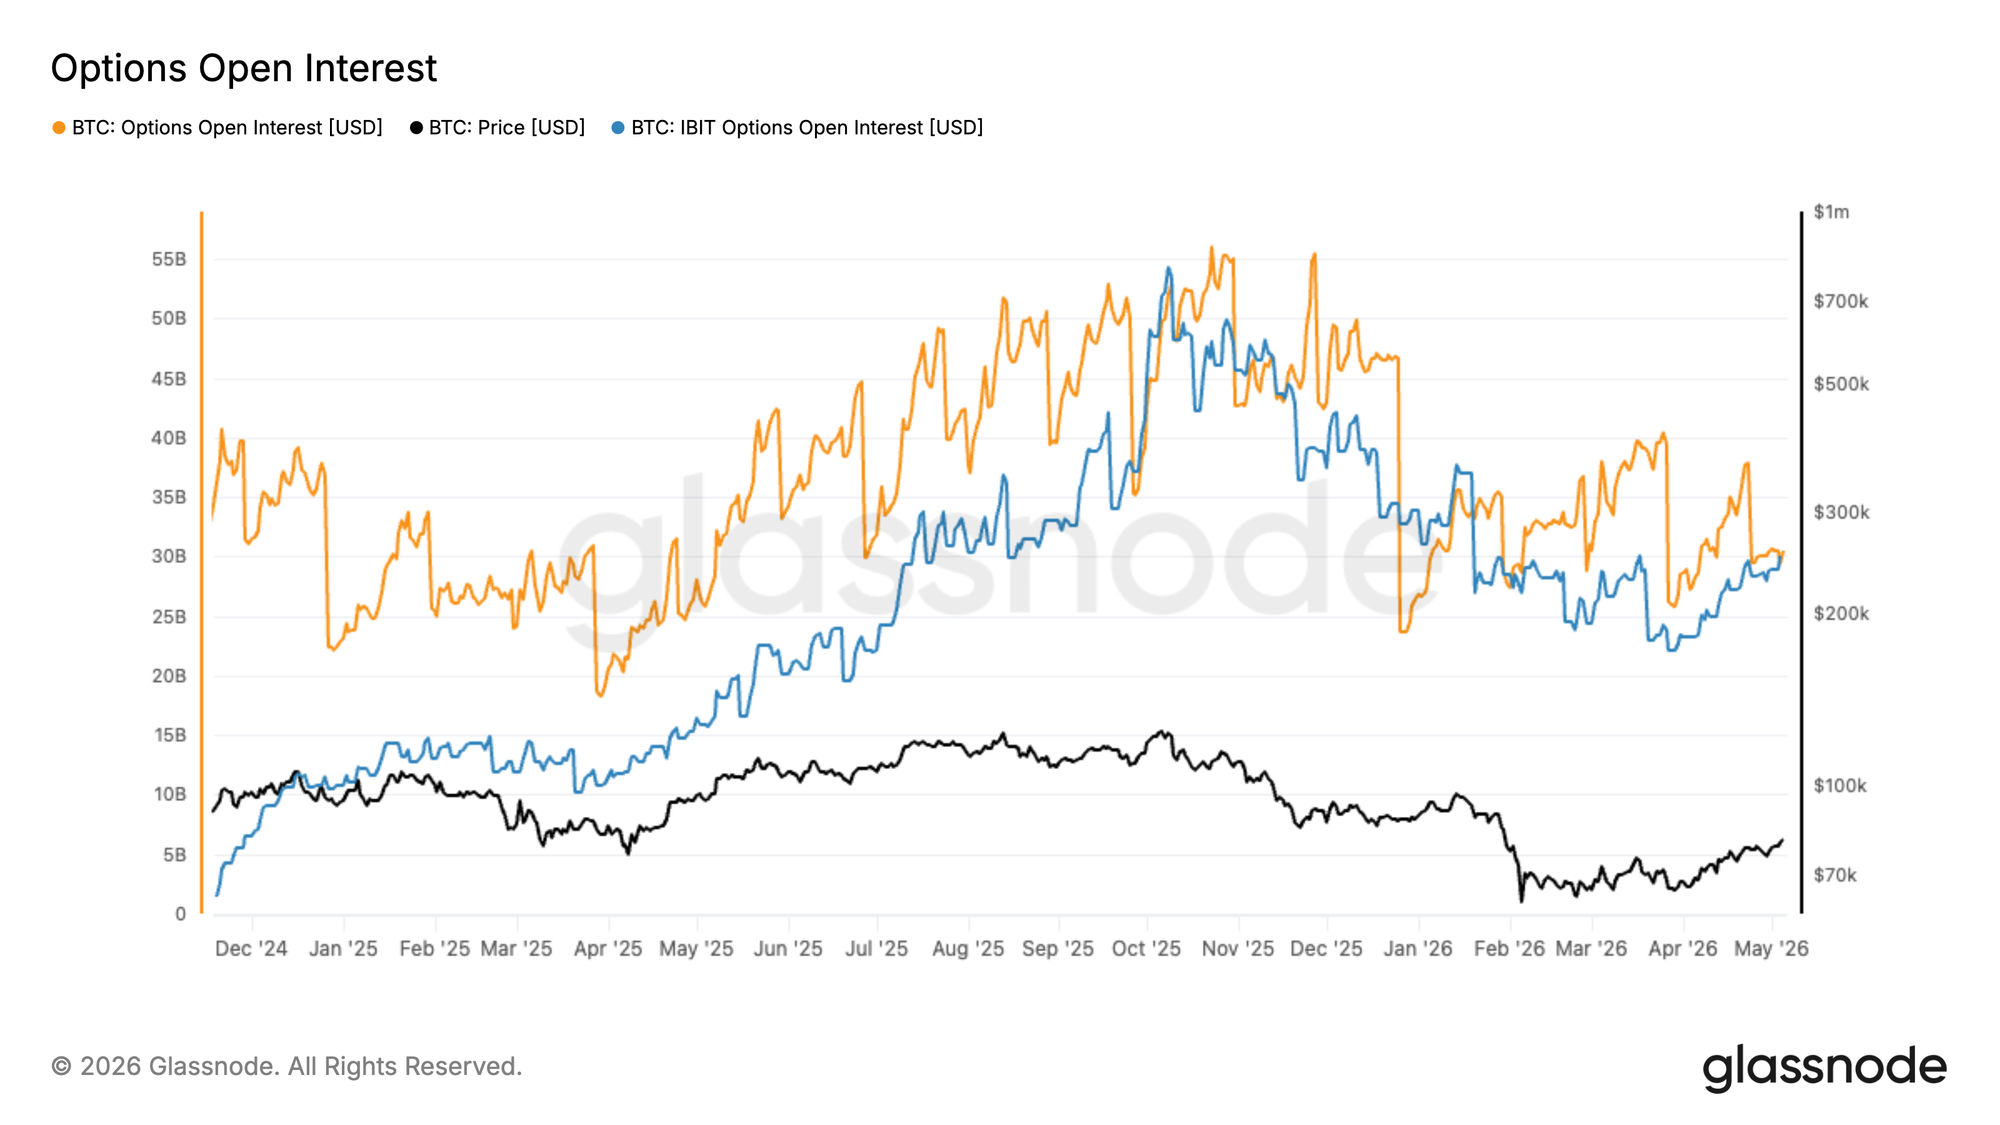
Why IBIT Options Matter
Options markets are where investors express more complex views than simple spot buying or selling. They reveal how participants price upside, downside, tail risk, volatility, and event risk.
In traditional markets, options are essential for understanding positioning and sentiment across equities, indices, rates, and commodities. As Bitcoin becomes more integrated into global portfolios, its options market is becoming equally important. Thus, IBIT options are particularly relevant for digital asset market analysis because they sit at the intersection of two worlds:
- The Bitcoin market, where volatility, leverage, and directional positioning have historically been shaped by crypto-native exchanges.
- The traditional ETF market, where regulated brokerage access, advisor platforms, structured products, and institutional risk frameworks play a larger role.
That makes IBIT options a powerful lens into how traditional finance is adopting Bitcoin — not only as a spot allocation, but also as a tradable, hedgeable, and volatility-sensitive asset.
IBIT vs Deribit: Two Different Views of the Bitcoin Market
One of the most important use cases is comparing IBIT options with crypto-native options venues such as Deribit.
Deribit remains a core liquidity venue for Bitcoin and Ethereum options. Deribit BTC options volume regularly exceeds 20,000 contracts, representing more than $2B in daily notional volume. But IBIT options represent a different flow profile.
Deribit is more crypto-native, global, and offshore. IBIT is U.S.-listed, ETF-based, and embedded in traditional brokerage and institutional workflows.
A divergence between IBIT and Deribit implied volatility can indicate that traditional finance and crypto-native markets are pricing Bitcoin risk differently. A richer call wing in IBIT may reflect stronger ETF-linked demand for upside exposure. A stronger put wing may indicate hedging pressure from ETF holders. Differences in term structure may indicate that TradFi participants are pricing event risk differently from crypto-native traders. The analytical value comes from comparing both markets directly.
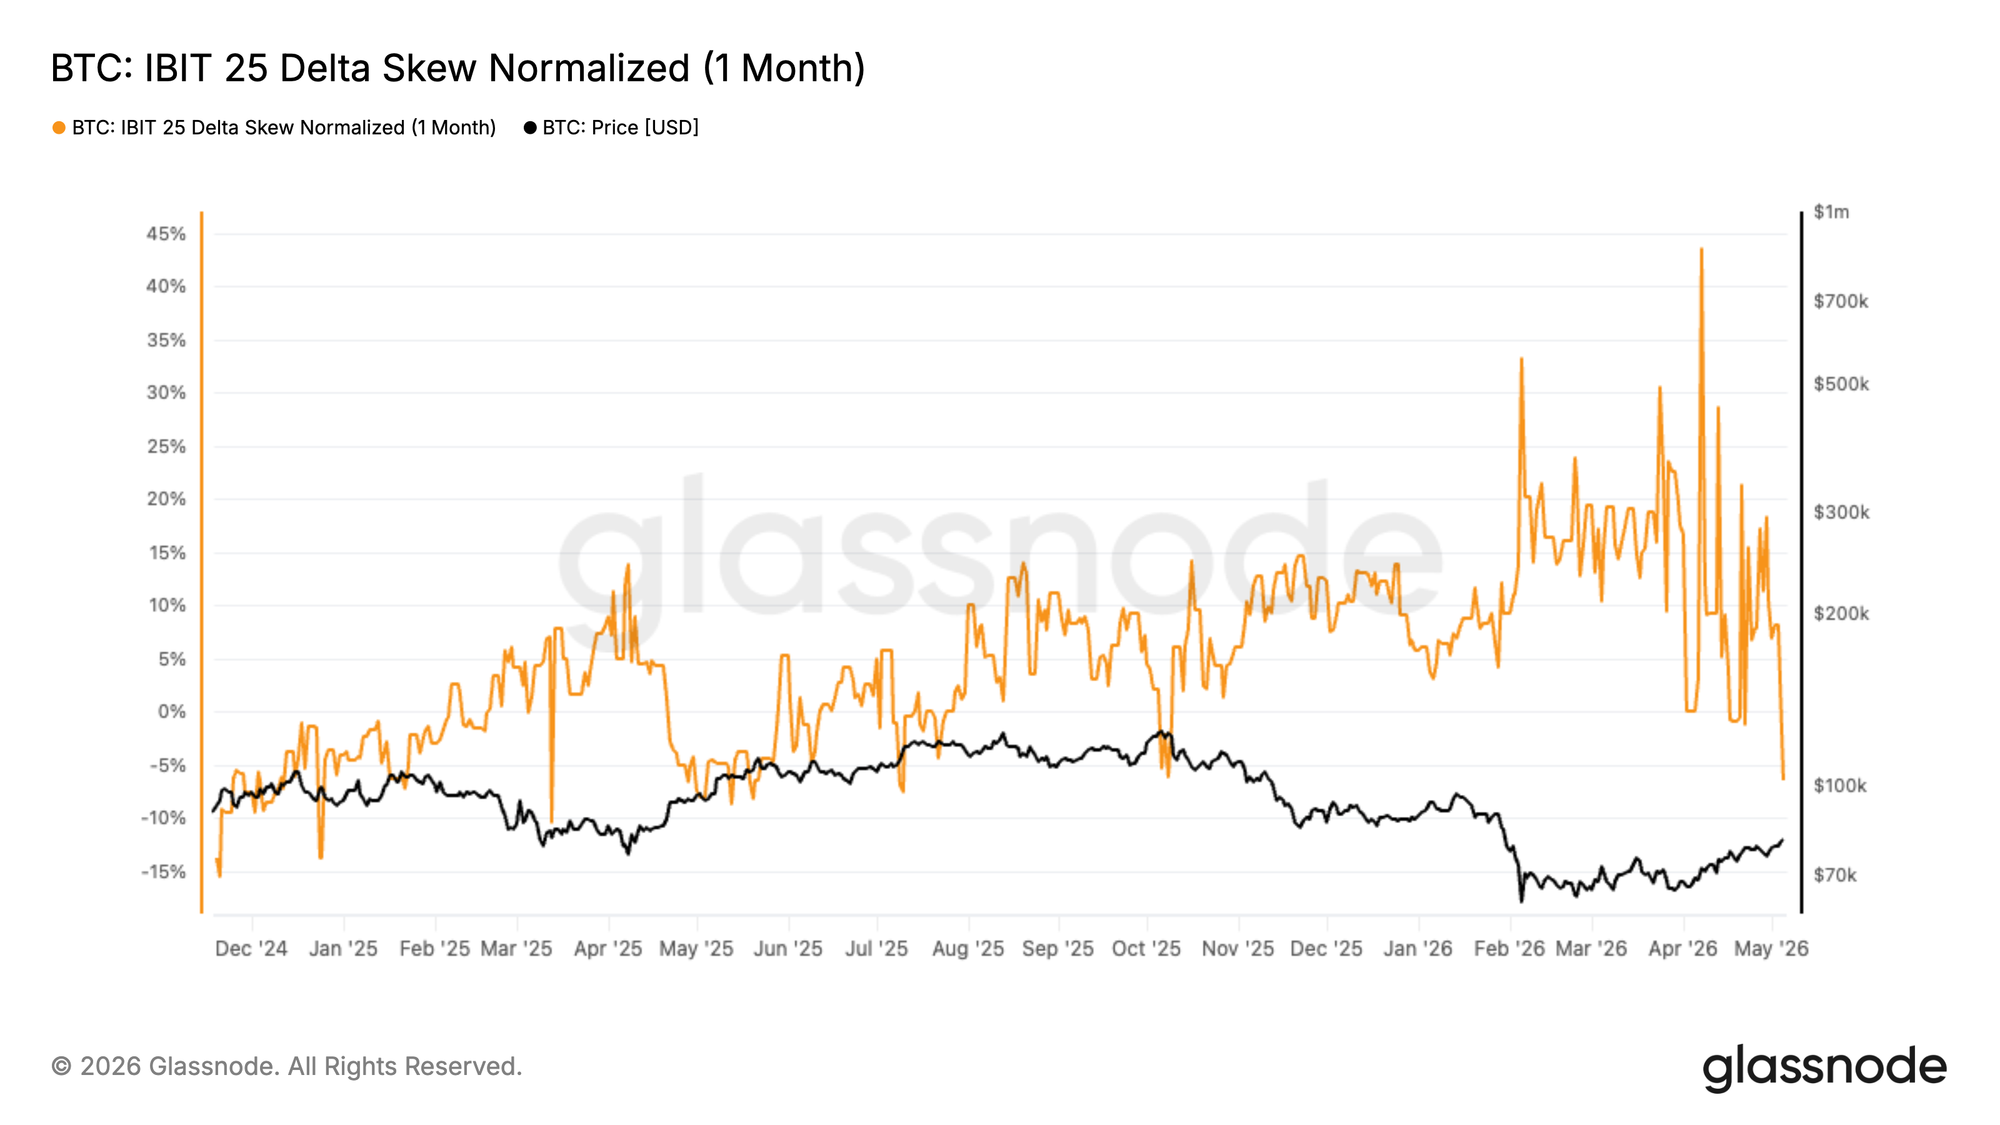
For example, as of May 5, Bitcoin options markets were pricing 1-month risk differently across venues. Deribit’s 1-month 25-delta skew remained modestly call-biased, while IBIT’s comparable skew stayed materially more put-skewed, leaving an approximately 15 percentage-point gap on the same underlying BTC exposure.
This suggests a meaningful venue-level divergence at the 1-month tenor, with IBIT and Deribit reflecting different risk-pricing dynamics across a more institutional ETF options market and a more crypto-native venue.
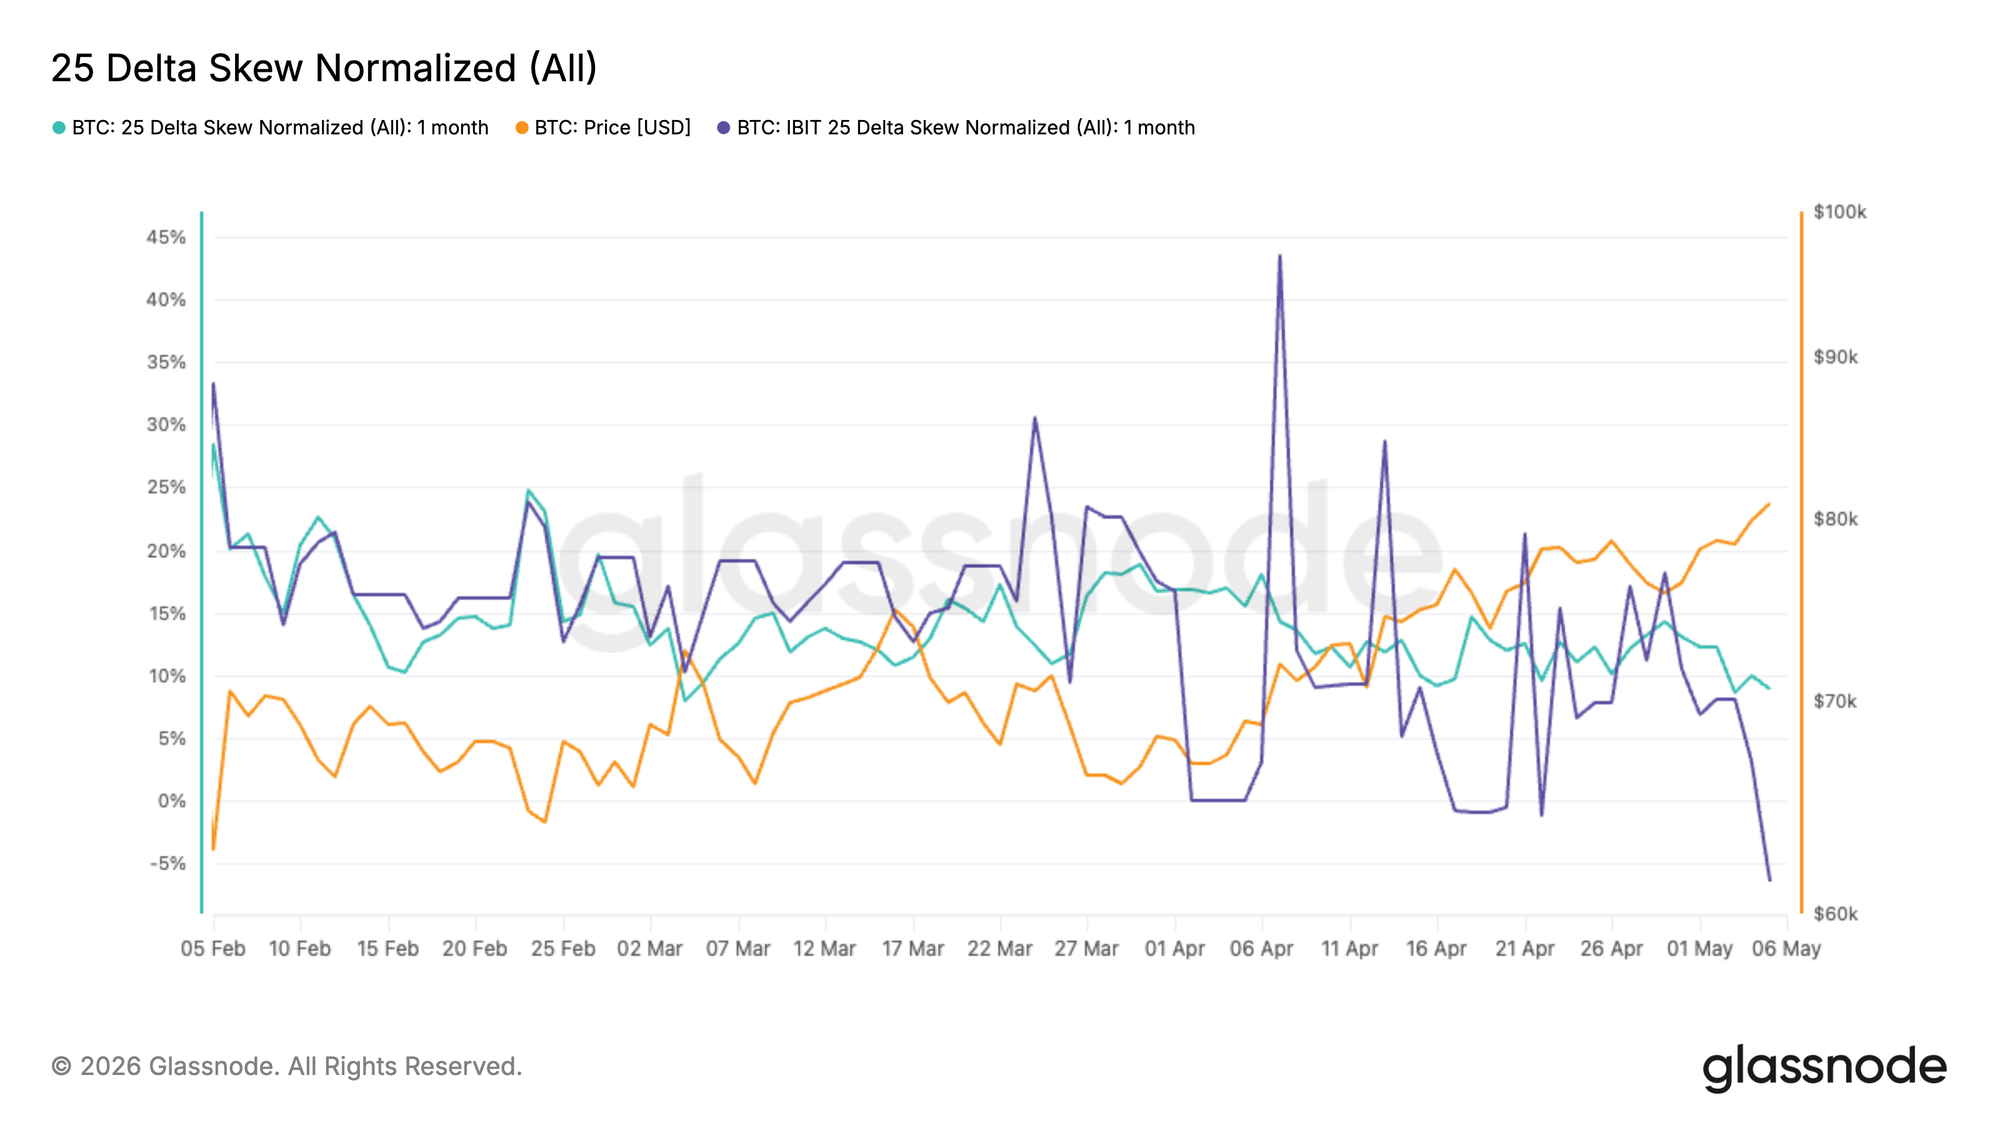
In this context, ETF-linked options investors appear to be assigning a higher premium to short-term downside protection, while crypto-native options markets remain comparatively less defensive.
Glassnode's IBIT Options Metrics and Analytics
We've extended our options analytics framework to IBIT, bringing users the same institutional-grade intelligence used across crypto-native options markets to the largest U.S. spot Bitcoin ETF.
Core IBIT Options Metrics
This first release of 40+ metrics provides the foundation: open interest, volume, max pain, and interpolated IV.
Open Interest, Volume & Max Pain
- IBIT Options Open Interest: Total OI across all IBIT option contracts. The single most important gauge of institutional engagement on the ETF.
- IBIT Options Open Interest by Maturity: Distribution of call and put OI across expiration dates. Directly comparable against Deribit's term structure to spot tenor dispersion.
- IBIT Options Volume: 24h rolling trading volume.
- IBIT Options Volume Put/Call Ratio: Classic sentiment indicator. Read alongside Deribit's P/C ratio to separate institutional positioning from retail/native flow.
- IBIT Options Max Pain: Strike where expiring options would cause maximum loss to holders. Useful for anticipating pinning behavior near monthly expiries.
IBIT Options ATM Implied Volatility
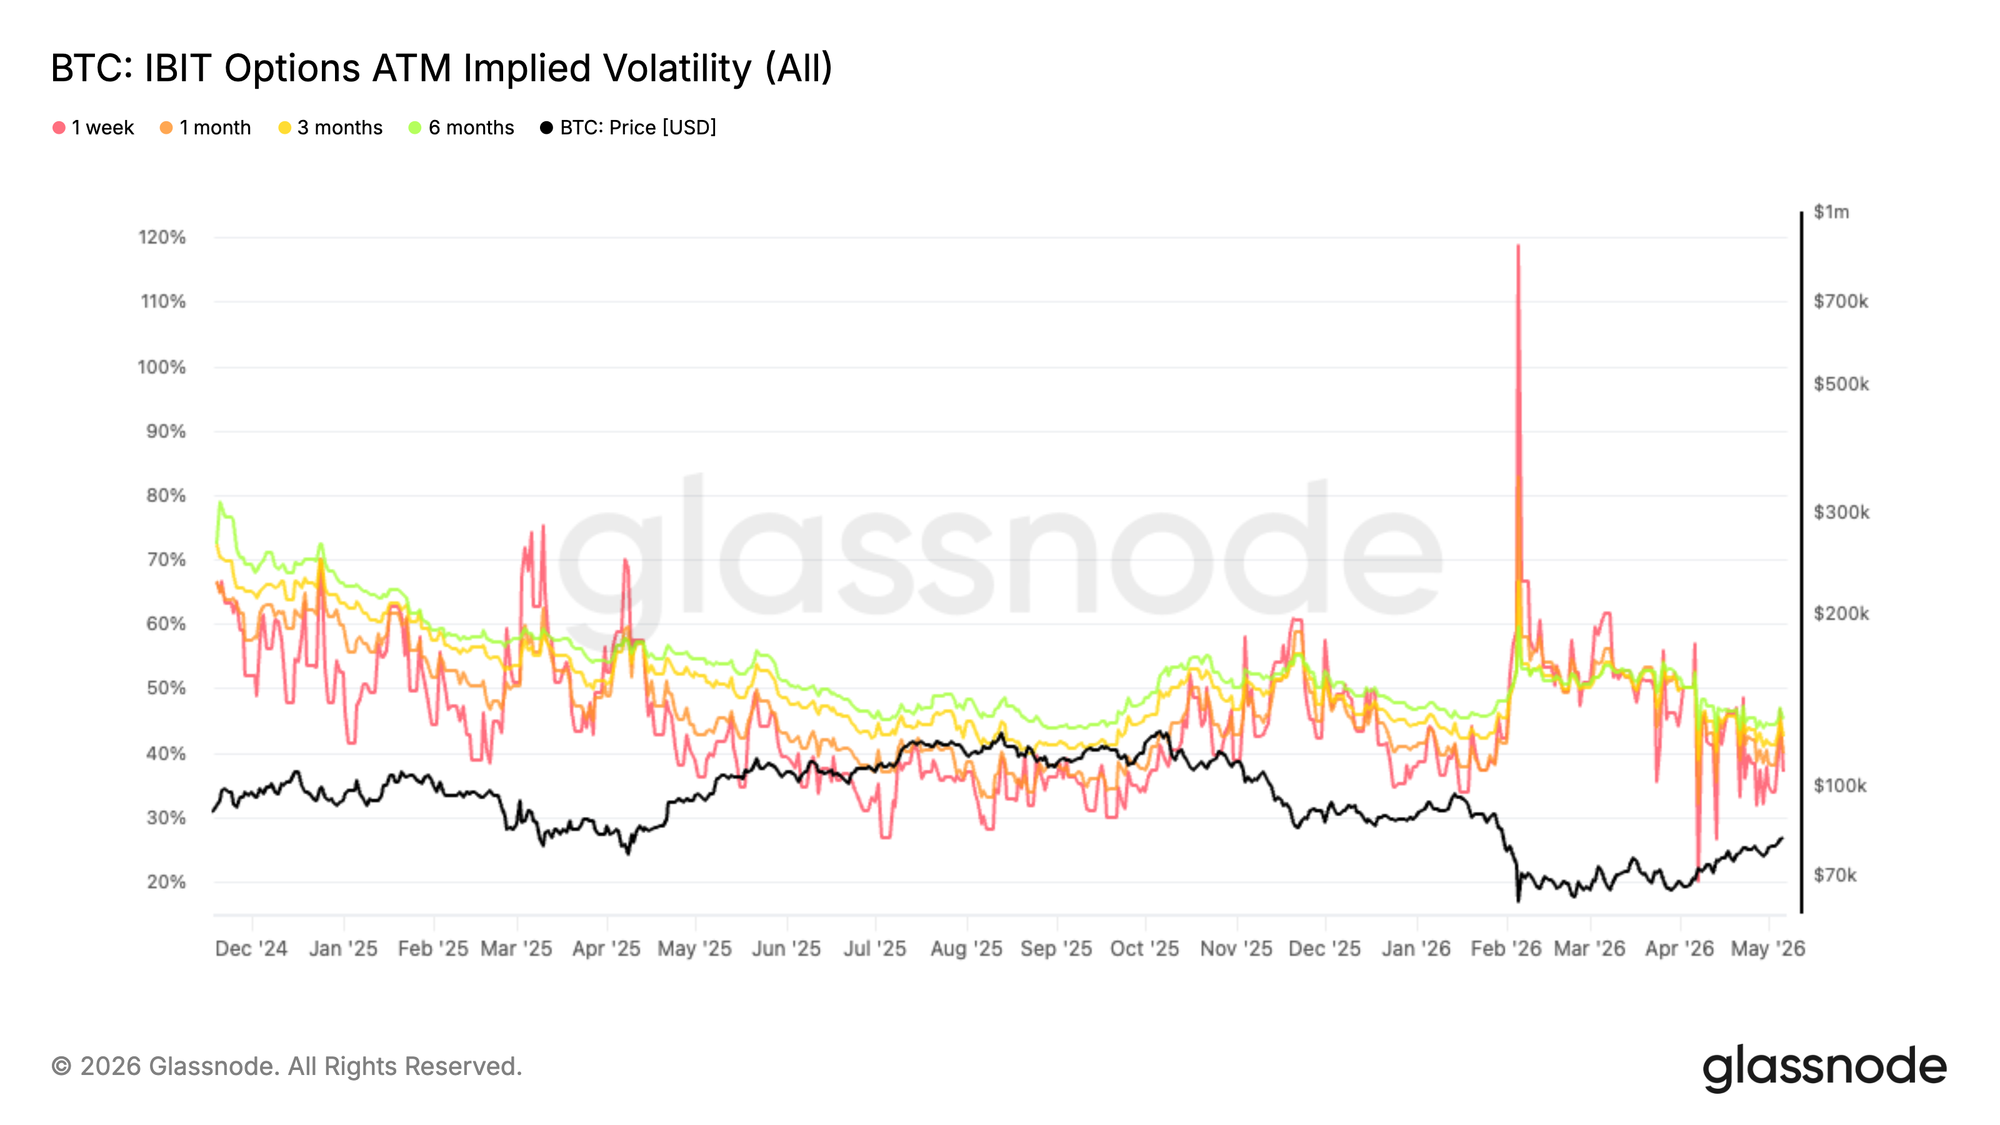
The new IBIT Options ATM Implied Volatility metrics provide a normalized view of how the U.S. ETF options market is pricing Bitcoin volatility across the term structure.
By tracking ATM IV across 1-week, 1-month, 3-month, and 6-month tenors, users can monitor how volatility expectations evolve through time — from short-term event risk to longer-term macro and positioning regimes. Rising ATM IV often reflects greater uncertainty, higher demand for optionality, or deteriorating sentiment, while falling ATM IV can point to calmer market conditions and reduced demand for protection.
Interpolated Implied Volatility by Delta
Smooth, model-interpolated IV at fixed deltas — no more jagged strike-listing artifacts.
- IBIT Call IV / Put IV at Delta 5, 10, 15, 20, 25, 50
This grid lets you zoom into specific risk zones — crash insurance at 10D puts, squeeze tails at 5D calls, the core smile around 50D — and compare cleanly across time and against Deribit's BTC IV grid.
IBIT Options Skew Metrics
The newest layer delivers proprietary skew analytics, following the same architecture we use for our Glassnode Skew Index across BTC, ETH, SOL, XRP, now applied to IBIT.
IBIT Skew Index & Components:
- IBIT Skew Index — Single measure of option-market asymmetry, integrating prices across broader sections of the volatility surface (not just two points like classical 25-delta skew). Positive = upside-focused IV dominates. Negative = downside hedging dominates.
- IBIT Skew Ratio — Ratio of upside to downside IV. Above 1: upside premium. Below 1: downside premium.
- IBIT Upside Implied Volatility — Upside-focused IV from OTM calls, integrated across strikes and time-weighted to fixed tenors.
- IBIT Downside Implied Volatility — Downside-focused IV from OTM puts, same construction.
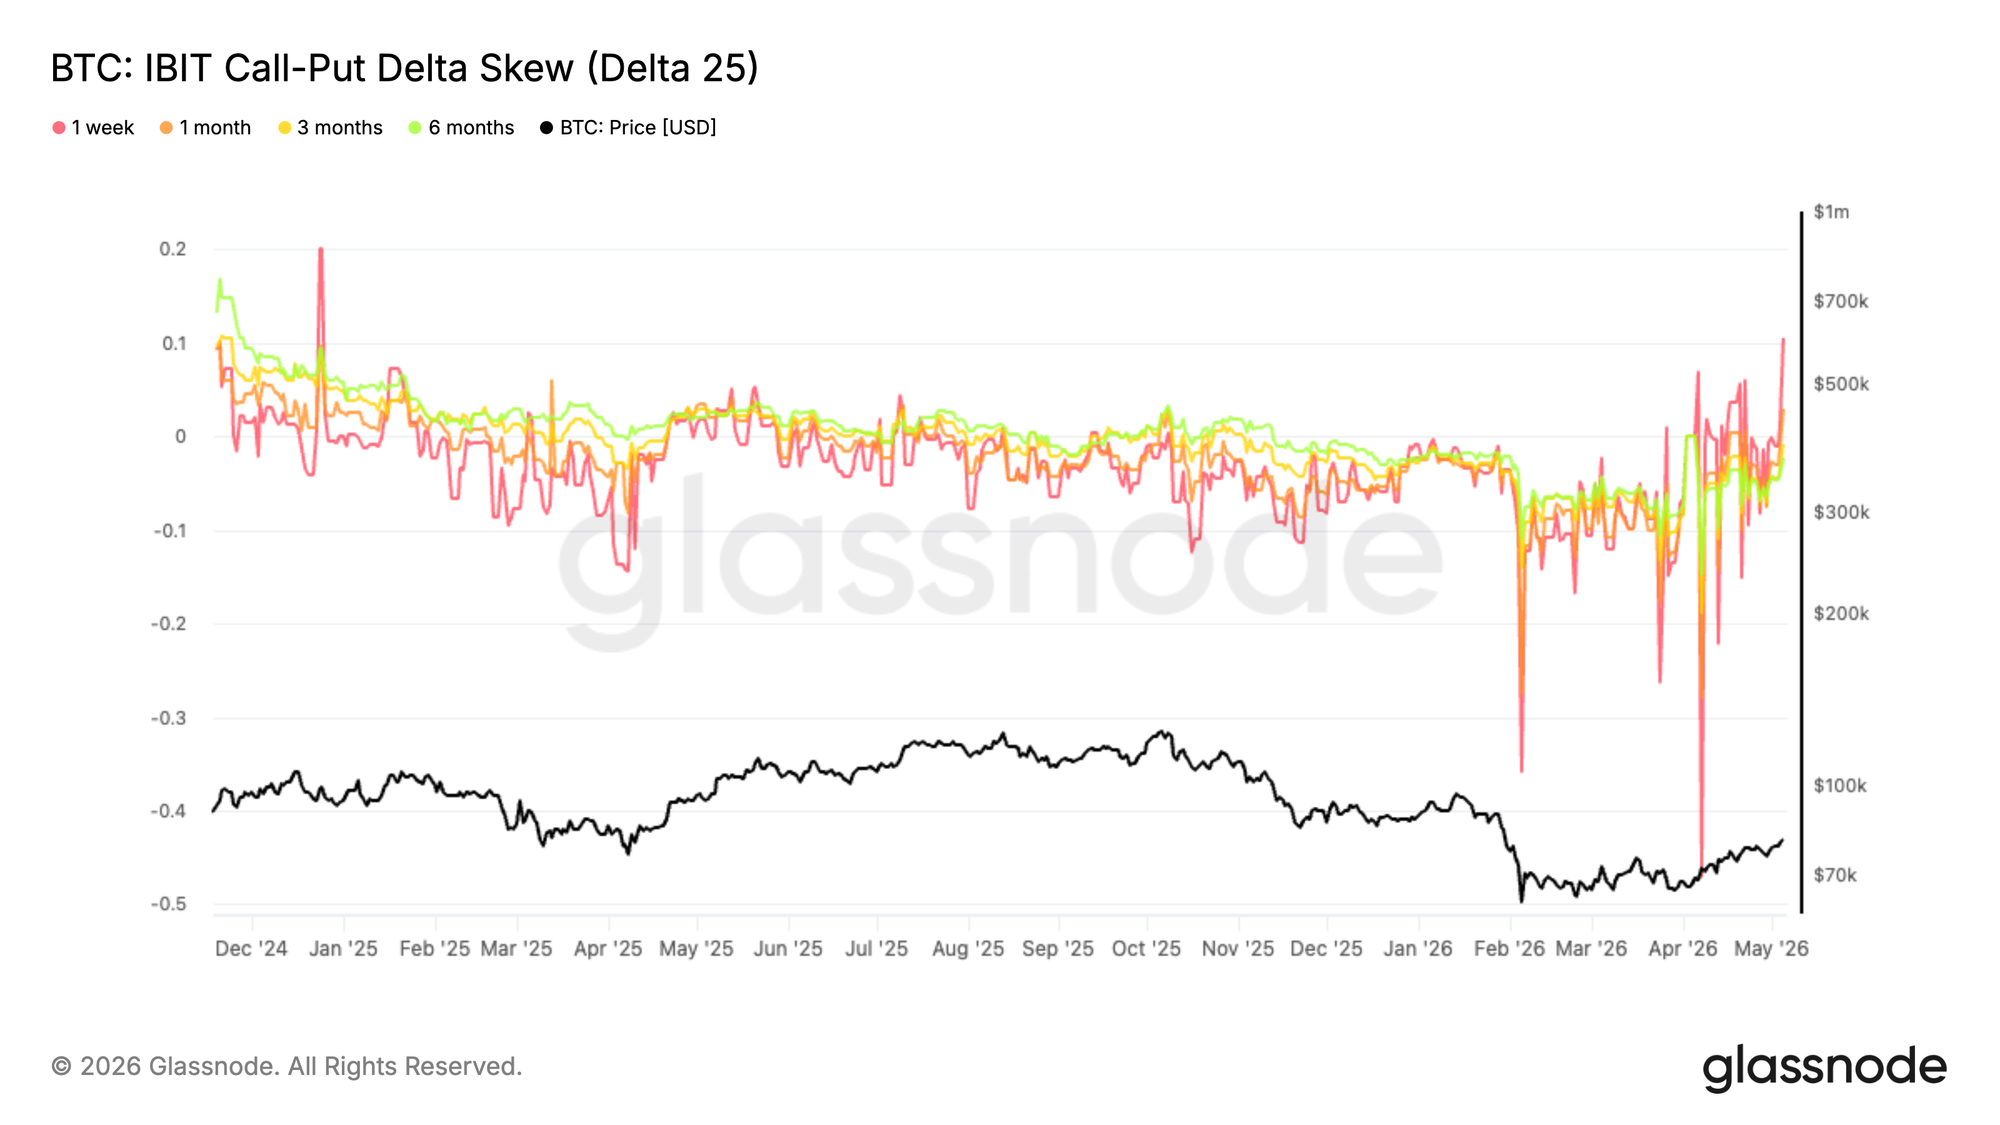
IBIT Call–Put Delta Skew (unnormalized, by tenor)
Time series of model-interpolated call–put IV skew — call IV minus put IV at each target delta, expressed directly in IV points.
- Delta 5, 10, 15, 20, 25
IBIT 25-Delta Skew Normalized (by tenor)
The classical 25-delta skew (25-delta put IV minus 25-delta call IV), normalized by ATM IV — making readings comparable across volatility regimes.
- 1 Week, 1 Month
IBIT Implied Volatility Heatmaps
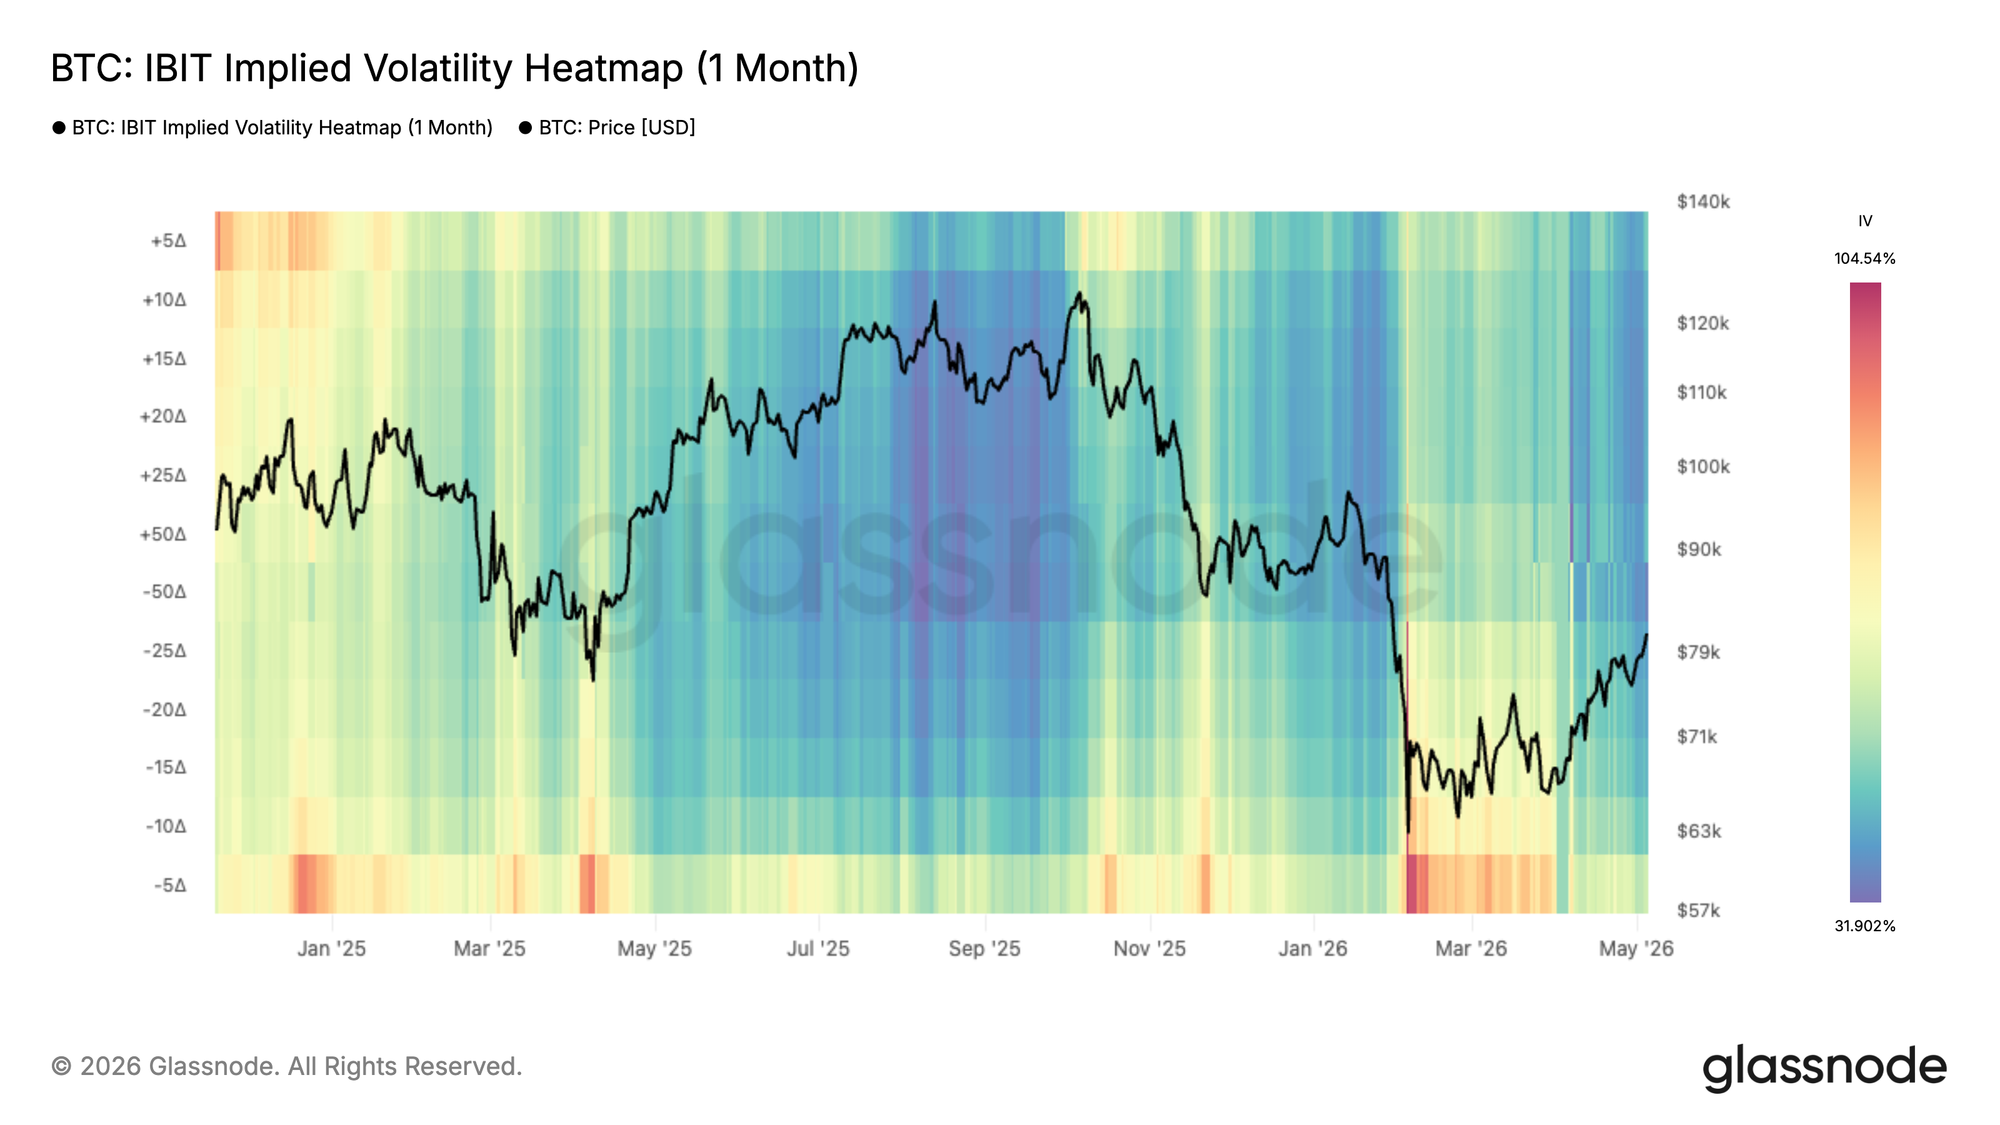
Visual surfaces for the IBIT volatility structure:
IBIT Implied Volatility Heatmap (by Delta) — Heatmaps of model-interpolated IV across option delta at fixed tenors. Vertical axis = delta (positive for calls, negative for puts).
- 1 Week, 1 Month, 3 Months, 6 Months
IBIT Implied Volatility Moneyness Heatmap — IV across moneyness buckets at a fixed tenor, from deep OTM puts to deep OTM calls.
- 1 Month, 3 Months, 6 Months
The heatmaps make skew asymmetries, tail-risk pricing, and term-structure dislocations visible at a glance, where individual time series can require triangulation.
Applications of IBIT Options Data
IBIT options data can be used across several workflows.
- Measure TradFi Bitcoin Sentiment
IBIT options provide a direct view into how ETF-linked participants are pricing Bitcoin risk. Call demand, put demand, skew, and term structure can reveal whether the market is positioning for upside, hedging downside, or pricing near-term event risk.
- Compare Institutional and Crypto-Native Views
By comparing IBIT metrics with Deribit metrics, clients can identify differences between traditional-market and crypto-native pricing. For example:
- Is IBIT skew more bullish or more defensive than Deribit?
- Are IBIT options pricing higher or lower volatility for the same tenor?
- Is upside demand stronger in ETF markets than offshore crypto venues?
- Are ETF investors hedging drawdowns more aggressively than crypto-native traders?
These divergences can become actionable research signals.
- Monitor Hedging Pressure
Put/call ratios, downside IV, and normalized skew can help identify when ETF holders may be using options defensively. This is especially useful around macro events, ETF flow reversals, large expiries, and Bitcoin drawdowns.
- Track Volatility Risk Across Tenors
The term structure of IBIT implied volatility shows how the market prices short-term versus long-term uncertainty. A steep front-end can indicate event risk. A richer back-end can indicate structural demand for longer-dated exposure.
The Takeaway
IBIT options are a sign that Bitcoin is moving further into mature institutional market structure.
- Spot ETFs made Bitcoin easier to hold.
- Futures made it easier to hedge directionally.
- Options make it possible to price volatility, skew, convexity, and risk across time.
As IBIT options continue to grow, they are likely to become one of the most important signals for Bitcoin sentiment and institutional positioning. Glassnode’s IBIT options suite gives clients the tools to track that shift in real time.
Options data is a major focus for Glassnode's product development. Every quarter, we are scaling our coverage with new metrics that extend the depth of our volatility tooling, broaden analytical use cases, and give professionals a more complete view of positioning and risk across the digital assets market.
- Follow us on X for timely market updates and analysis
- Join our Telegram channel for regular market insights
- For on-chain metrics, dashboards, and alerts, visit Glassnode Studio
Disclaimer: This report is for informational and educational purposes only. The analysis represents a limited case study with significant constraints and should not be interpreted as investment advice or definitive trading signals. Past performance patterns do not guarantee future results. Always conduct thorough due diligence and consider multiple factors before making investment decisions.