Five Charts to Understand the Starting Point of the 2026 Bitcoin Bull Market

marsbitPublicado em 2026-08-28Última atualização em 2026-08-28

Resumo

"Five Charts Signaling the Start of Bitcoin's 2026 Bull Run," an article by Anthony J. Pompliano, argues that the Bitcoin bear market is likely over. The analysis uses five key charts to support a bullish outlook for the next 18-24 months. First, a chart combining Bitcoin's mining electricity cost with the RSI indicator suggests a historical buy signal has appeared, similar to patterns preceding past bull markets. Second, Bitcoin's correlation with gold has reached a record high, positioning both as hedges against currency devaluation amid expansive fiscal policies. Third, despite a recent divergence, Bitcoin's price has historically caught up to expansions in the M2 money supply, indicating potential for upward movement. Fourth, a technical analysis of a 4-hour chart shows Bitcoin breaking out from a consolidation pattern, suggesting a path toward $90,000. Finally, data illustrates that long-term holding is crucial, as most of Bitcoin's annual gains come from just a few major up days, making frequent trading counterproductive. The conclusion states that while volatility will persist, the new bull market has begun and disciplined investors stand to be rewarded.

Author: Anthony J. Pompliano, Founder & CEO of ProCap Financial

Compiled by: Saoirse, Foresight News

Over the past year, Bitcoin has disappointed many investors. This highly watched digital asset has retreated over 50% from its all-time high of $125,000. The good news is, the bear market is most likely over, and we are at the beginning of a new bull cycle.

The following five charts will give you reason to be optimistic about Bitcoin's potential returns over the next 18-24 months.

First, Quinten Francois illustrates the correlation between Bitcoin mining electricity costs and the Relative Strength Index (RSI). Historical trends clearly show that these two tend to bottom out simultaneously.
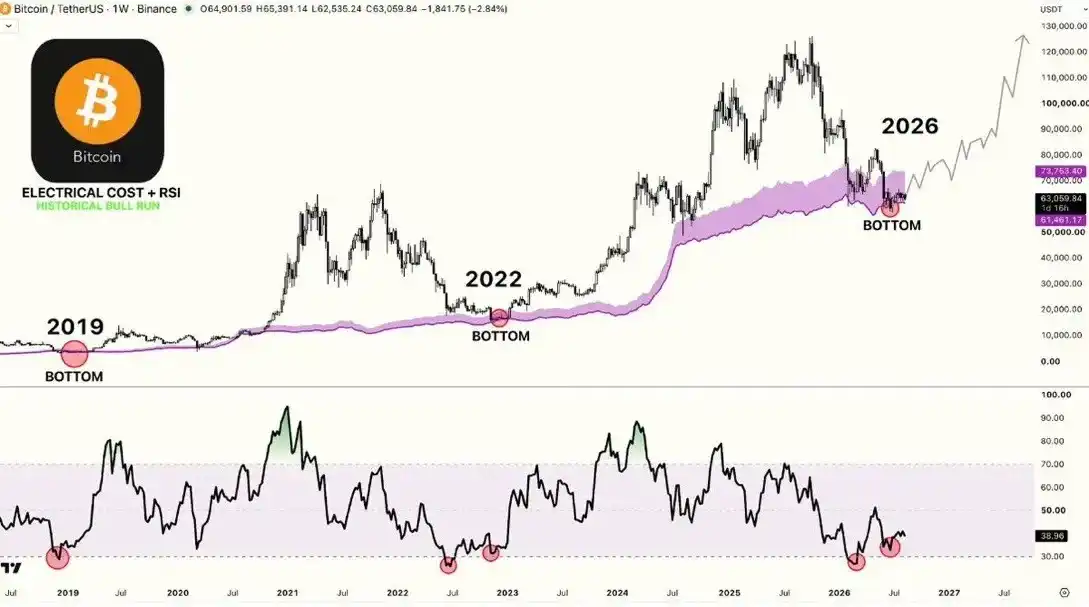
This Bitcoin weekly chart combines the mining electricity cost band (purple) with the RSI indicator, showing three instances where price retested the cost band while RSI bottomed in 2019, 2022, and 2026. Historically, this signal has often preceded bull market runs.

If history repeats itself, this is a strong signal for the start of a bull market.

Second, Will Clemente points out that the correlation between Bitcoin and gold has recently hit a record high. This is significant, as bets on currency devaluation are coming back into vogue, influenced by Scott Bessent's recent pledge for expanded government fiscal spending.
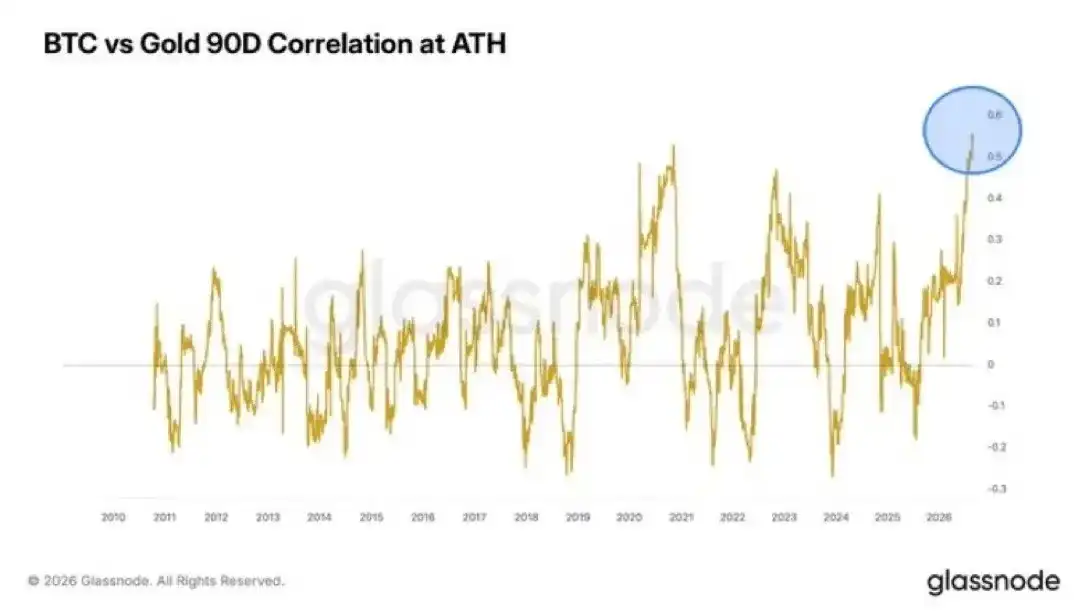
This Glassnode chart shows the 90-day correlation between Bitcoin and gold. In 2026, their correlation surged to historically high levels, indicating their price movements are currently highly synchronized, both being treated as hedges against monetary debasement.

I always repeat the classic view in the Bitcoin space: Bitcoin has no price ceiling because the US dollar has no value floor. US national debt has exceeded $40 trillion, and the government continues to recklessly erode the dollar's purchasing power. Any rational thinker can see this trend of unrestrained spending is set to continue.

Third, historically, Bitcoin's price trajectory has tracked the growth of the broad money supply (M2). Recently, however, a significant divergence has emerged: M2 continues to expand while Bitcoin's price has fallen. Many have abandoned this indicator as a result, but such large divergences have occurred multiple times in the past. And each time the gap has closed, it was Bitcoin's price catching up to the upside, not M2 growth decelerating.
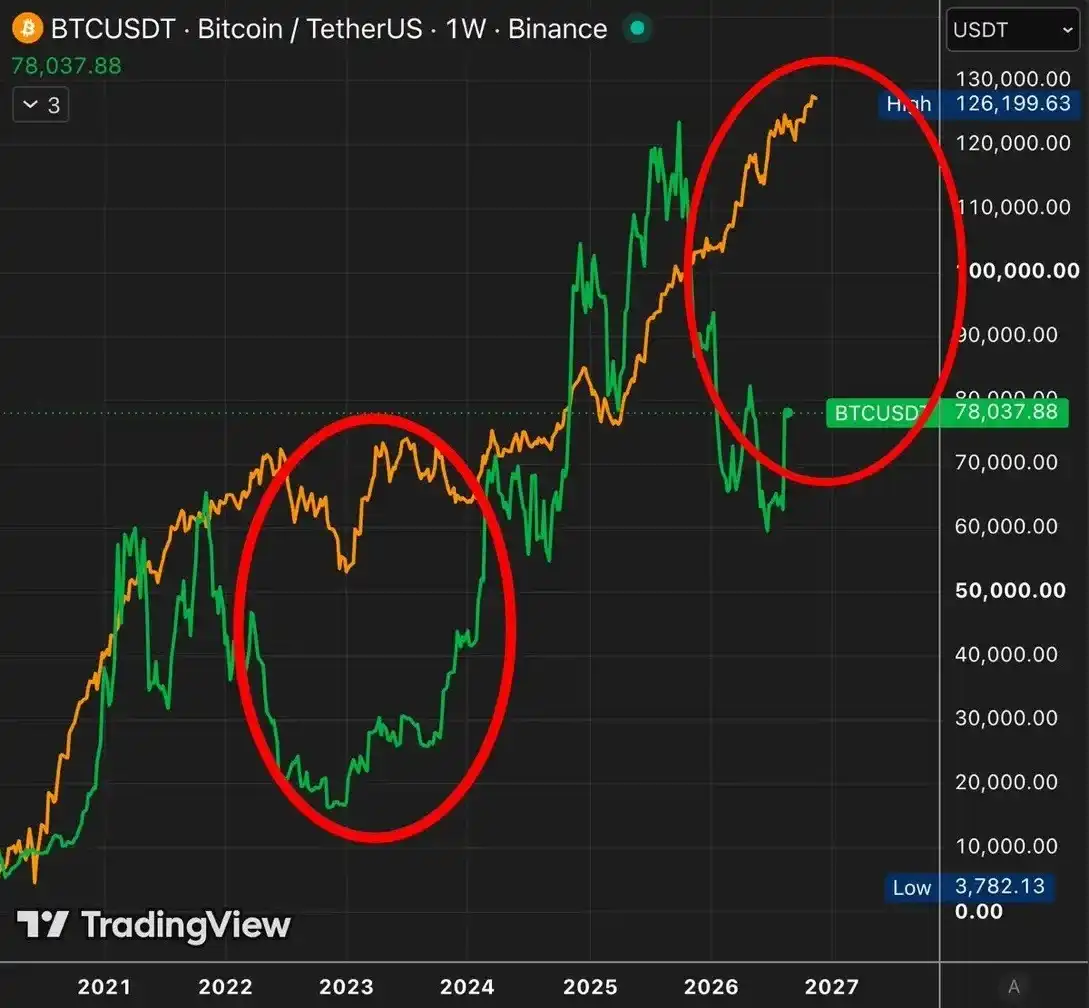
This weekly chart compares Bitcoin (green) with M2 money supply (orange). It shows two periods of price divergence: after the 2022 crash, price caught up as M2 rose, and in 2026 price has again lagged behind money supply growth. Historical patterns suggest Bitcoin will subsequently close this gap by moving higher.

Fourth, I rarely rely on drawing lines on charts alone to predict portfolio moves, but this analysis from R89 Capital is compelling. Bitcoin appears to be bouncing from the bottom of a key consolidation range, suggesting potential price appreciation in the coming weeks and months.
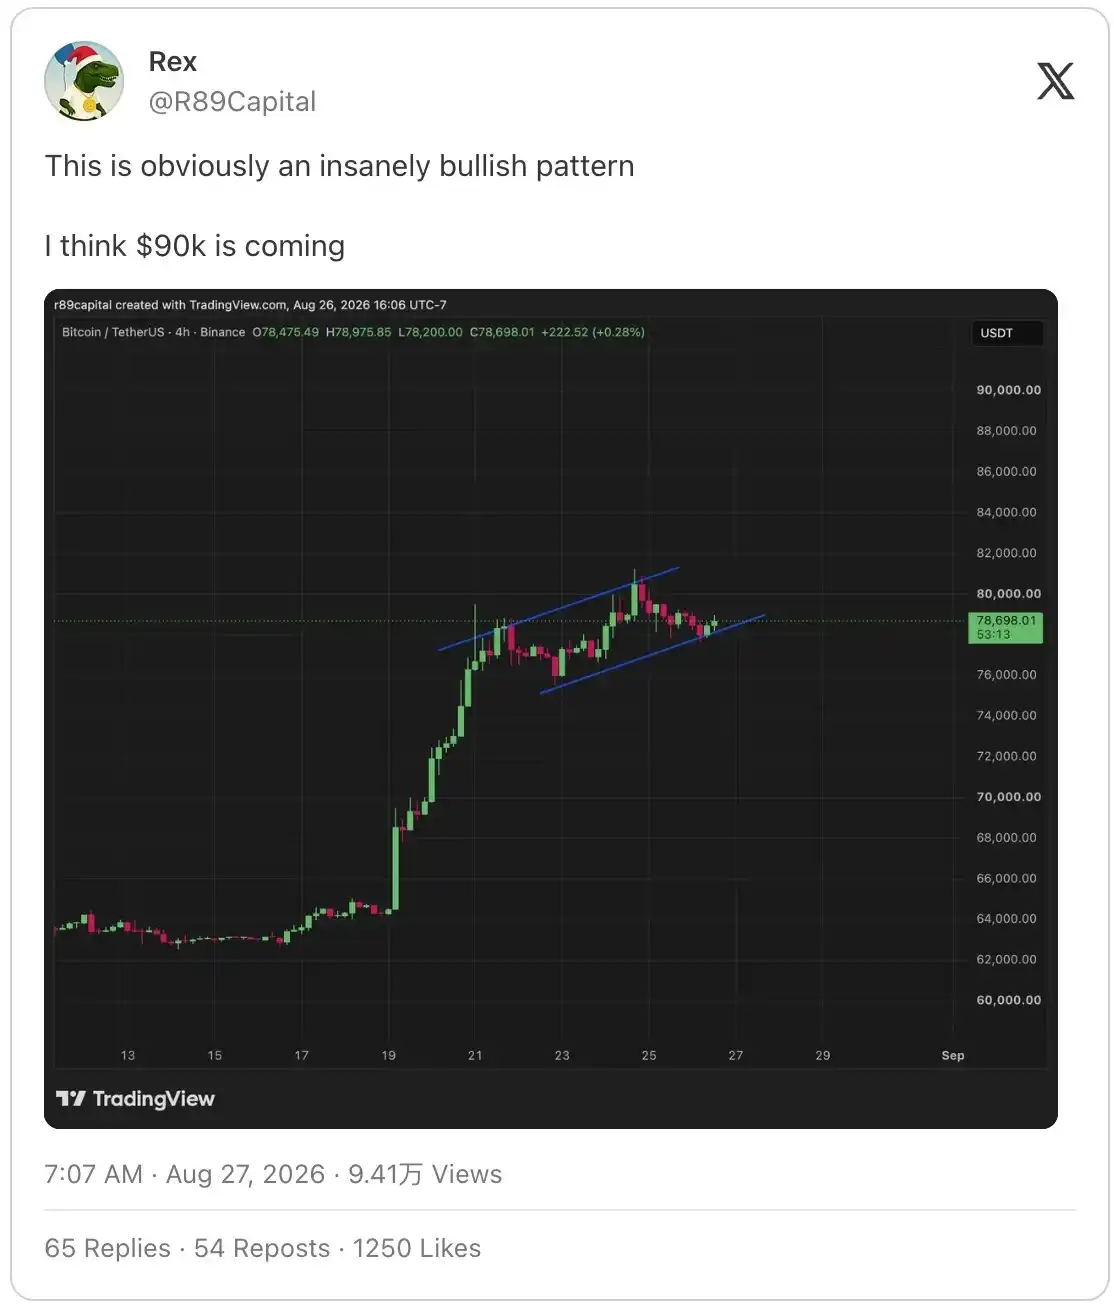
This is a Bitcoin 4-hour chart from R89 Capital, showing price forming an ascending channel pattern. The firm views this as a bullish signal, anticipating a move towards $90,000.

Finally, the core truth of investing in Bitcoin: long-term holding is far more effective than frequent timing of the market. Jeff John Robert shared a Bloomberg chart, writing: 'The investment logic for Bitcoin is now similar to that of the S&P 500: the vast majority of returns come from a handful of big up days. Selling now and missing those windows would be devastating. This Bloomberg chart compares Bitcoin's annualized returns, including vs. excluding the ten best-performing days.'
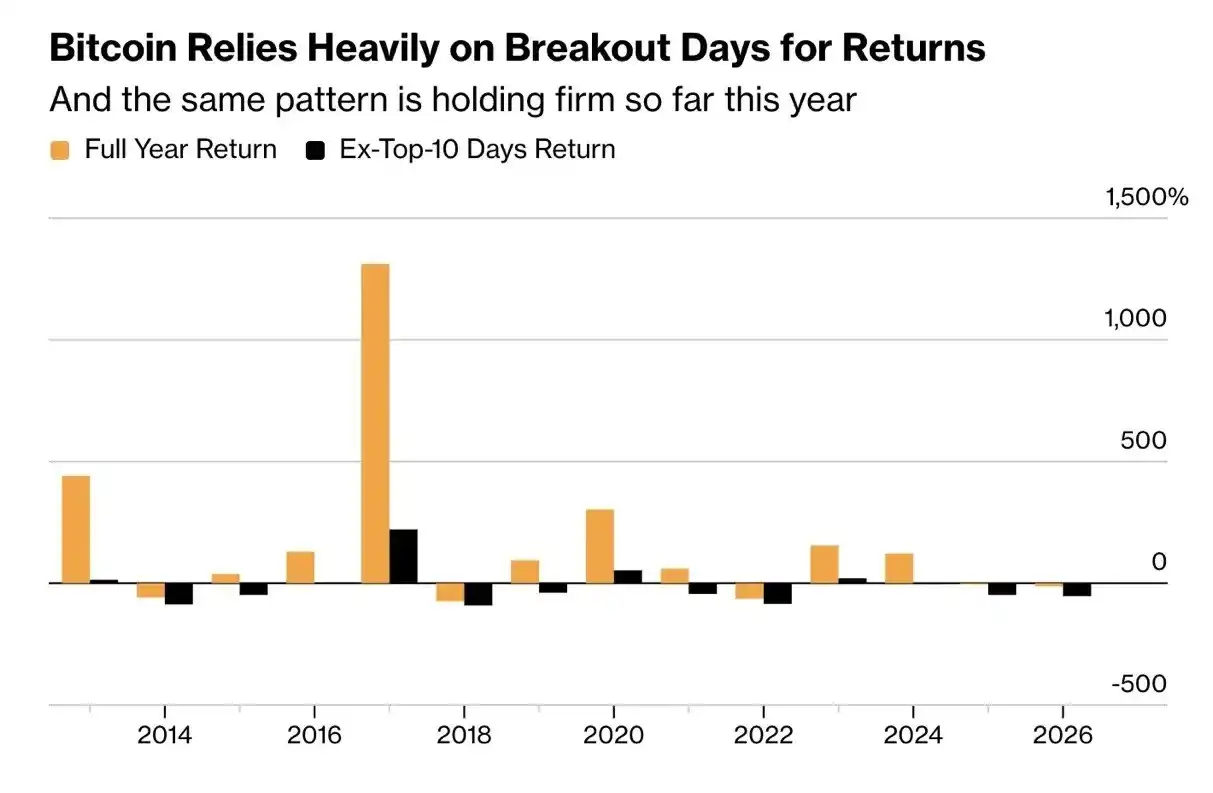
This chart compares Bitcoin's full annualized returns with returns after removing the ten best trading days of each year. It illustrates that most of Bitcoin's gains come from a small number of significant rally days, and frequent trading attempts easily miss these crucial periods.

The reasoning is actually quite simple. This Bitcoin bear market has been shorter and shallower than previous cycles. Don't dwell on the past; a new bull market is already here. Bitcoin will appreciate significantly from current levels. Volatility will be extreme, and such swings aren't suitable for the faint of heart. However, those who understand Bitcoin and can maintain conviction through the turbulence are likely to be handsomely rewarded.


Perguntas relacionadas

QAccording to the article, what is the relationship between Bitcoin's mining electricity cost band and the RSI indicator, and what does their simultaneous bottoming signal?

AThe article states that historically, Bitcoin's mining electricity cost band (purple) and the Relative Strength Index (RSI) tend to bottom simultaneously. This signal, which occurred in 2019, 2022, and 2026, has historically been followed by the start of a bull market.

QWhy is the record-high correlation between Bitcoin and gold in 2026 considered significant in the article?

AThe record-high 90-day correlation between Bitcoin and gold in 2026 is significant because it indicates that both assets are moving in sync and are currently being treated as hedges against currency devaluation, fueled by expectations of expanding government fiscal spending.

QWhat historical pattern does the article describe regarding the relationship between Bitcoin's price and the M2 money supply, and what is the implied future movement?

AThe article describes a historical pattern where Bitcoin's price and the M2 money supply generally move in sync. When a significant divergence occurs—like in 2022 and 2026 where M2 expanded while Bitcoin's price fell—history shows that the gap closes by Bitcoin's price catching up to the money supply, not the other way around. This implies a future upward price correction for Bitcoin.

QWhat bullish price pattern is identified by R89 Capital's analysis on the 4-hour Bitcoin chart?

AR89 Capital's analysis of the 4-hour Bitcoin chart identifies an ascending channel pattern. The firm views Bitcoin rebounding from the bottom of this key consolidation range as a bullish signal, anticipating a price move towards $90,000.

QWhat is the core investment lesson about Bitcoin highlighted by the Bloomberg chart discussed in the article?

AThe core investment lesson highlighted by the Bloomberg chart is that long-term holding is far more effective than frequent trading. The chart shows that the vast majority of Bitcoin's annual gains come from just a few major rally days. Missing these key up days by trying to time the market results in significantly worse investment outcomes.

Leituras Relacionadas

Car Radar Chip Unicorn Rushes for IPO, BYD Is Its Largest Customer

Gateland Microelectronics (Shanghai) Co., Ltd., a Chinese unicorn in automotive radar chips, has filed for an IPO on Shanghai's STAR Market, seeking to raise approximately 3.49 billion yuan. The company, founded in 2014 by Berkeley PhD Chen Jiashu, pioneered CMOS-based millimeter-wave radar chips, significantly reducing costs and enabling wider adoption in mid-market vehicles. Its chips are used by over 30 automakers, including BYD, Geely, Nio, Volvo, and Rivian. While revenue grew rapidly from 206 million yuan in 2023 to 632 million yuan in 2025, with a CAGR exceeding 75%, the company remains unprofitable, reporting cumulative net losses of 910 million yuan over three years and one quarter. High R&D and sales expenses, with R&D intensity reaching 147.75% in 2023, have consumed its profits despite strong gross margins of around 47-49%. The IPO filing reveals significant challenges: extreme customer concentration, with BYD accounting for over 50% of terminal sales; heavy reliance on overseas suppliers for over 50% of procurement; and a singular product focus. Millimeter-wave radar chips contributed 99.93% of 2025 revenue, while its new ultra-wideband (UWB) chip line generated negligible income. The proposed IPO funds will primarily support further development of its core millimeter-wave radar business and the nascent UWB chip project. Gateland's key post-IPO tests will be diversifying its client base beyond BYD, mitigating supply chain risks, and successfully commercializing its UWB technology to build a sustainable second growth curve.

marsbitHá 9m

Car Radar Chip Unicorn Rushes for IPO, BYD Is Its Largest Customer

marsbitHá 9m

Trading

Spot
活动图片