Ethereum "Cooling Off" to Build Momentum? ETF Funds Quietly Flow Back, Is the Historic Rally Script About to Play Out Again?

marsbitPublicado em 2025-12-12Última atualização em 2025-12-12

Resumo

Ethereum's price has been consolidating near $3,200 after facing resistance between $3,350 and $3,650, a zone reinforced by the 200-day EMA. Despite this, signs of recovery are emerging in spot ETF flows. Since November 21, ETH ETF assets under management have increased by 28%, from $16.8 billion to $21.5 billion, indicating a gradual return of buyer interest. Although net flows remain negative at -$138 million, this marks a significant improvement from October’s -$500 million, suggesting weakening selling pressure. The 30-day moving average of net active buying is also rising, resembling a pattern seen in early 2025 that preceded a major price surge. On the 4-hour chart, ETH is testing a key demand zone between $3,100 and $3,180. A hold above this level could lead to a retest of the 200-day EMA and a breakout toward $3,900. However, a breakdown may trigger a drop toward $3,000. Derivatives data shows neutral sentiment with mild funding rates and open interest, indicating cautious optimism. The key for Ethereum’s next major move depends on sustained defense at current support levels, coupled with growing ETF inflows and active buying momentum.

Ethereum's price action has flattened this week, encountering significant resistance in the supply zone between $3,650 and $3,350. The token is currently consolidating near $3,200. This resistance level roughly coincides with the 200-day Exponential Moving Average (EMA), further reinforcing the overhead pressure in this area. Notably, just as this is happening, spot Exchange Traded Fund (ETF) flows are beginning to show initial signs of recovery.

Key Points:

  • Since November 21st, the Assets Under Management (AUM) for spot Ethereum ETFs have increased from $16.8 billion to $21.5 billion, a gain of 28%.
  • Net active buying volume is showing an upward trend, indicating that the previously strong selling pressure is weakening, while buying power is gradually returning.
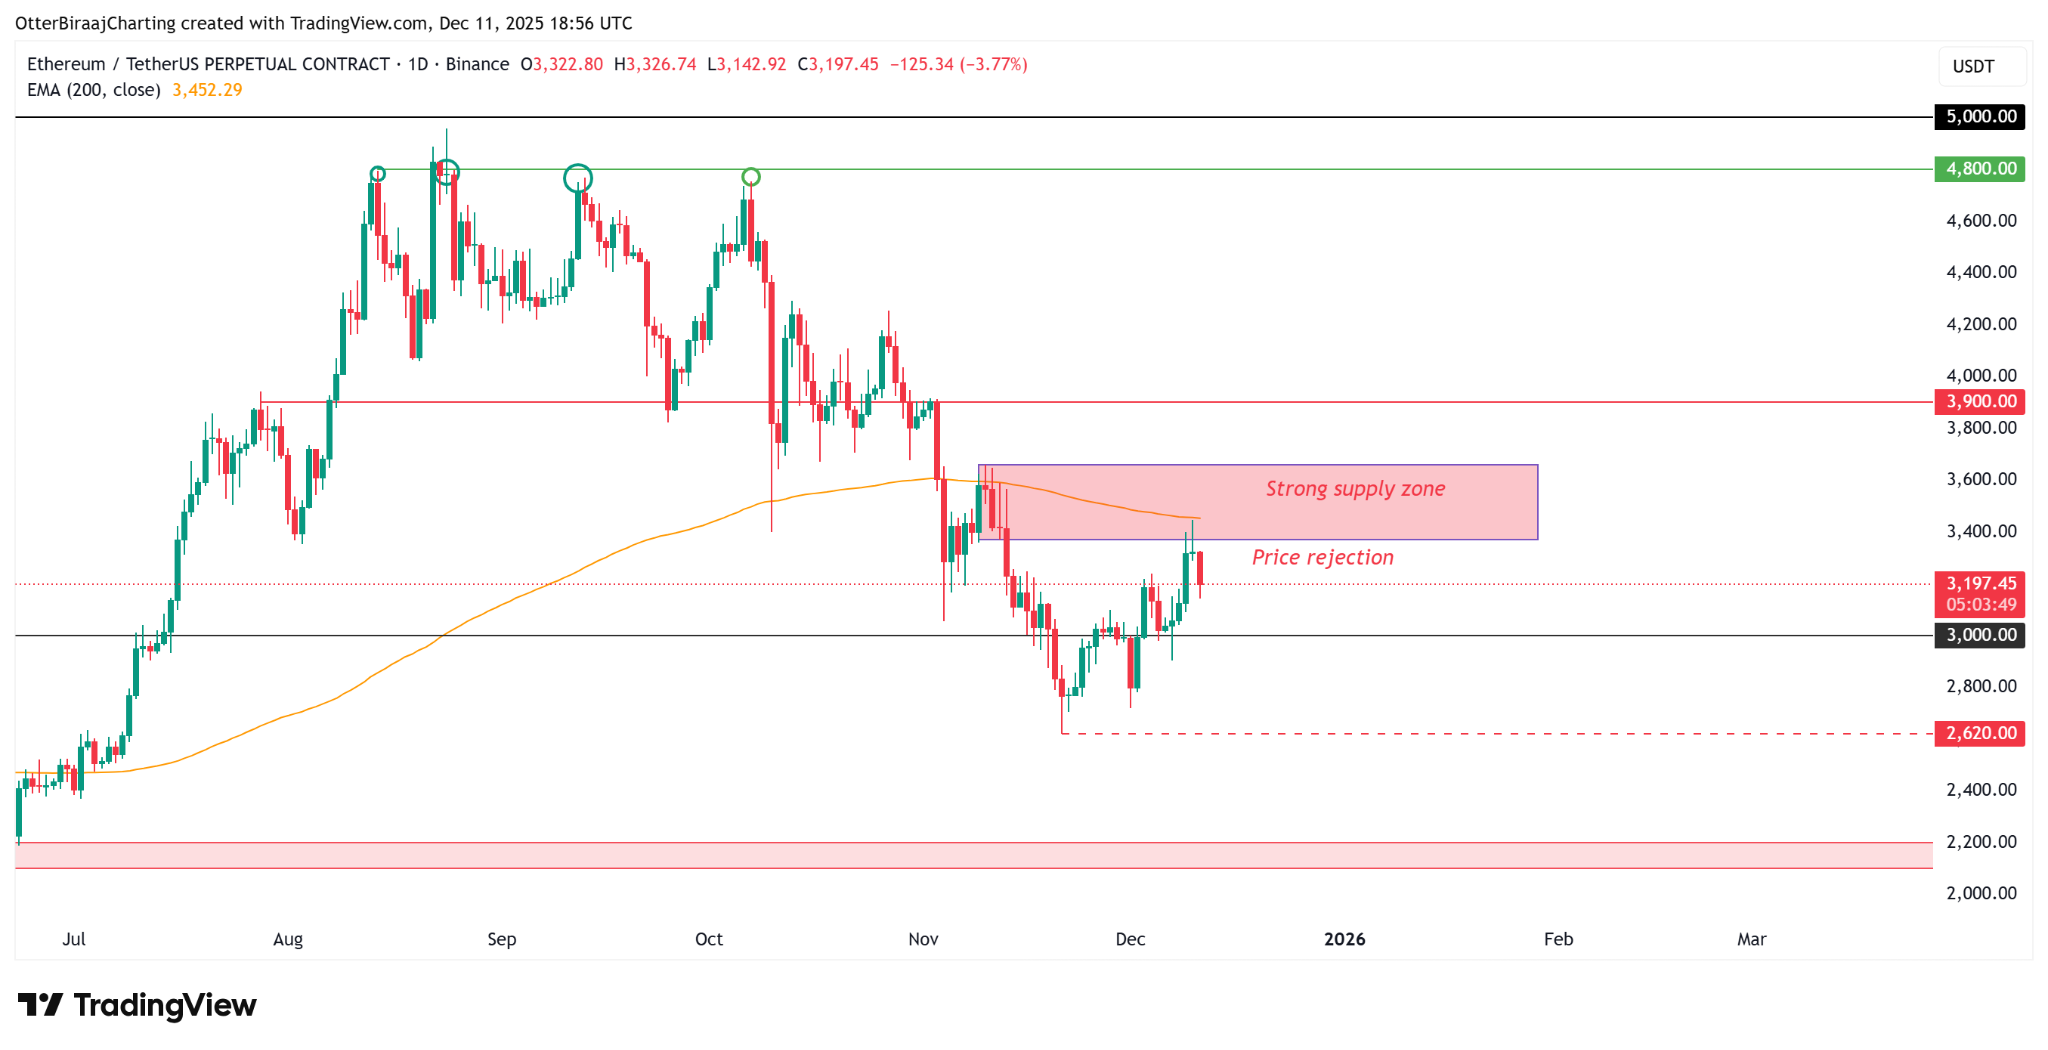
Ethereum Daily Chart. Source: TradingView


ETF Inflows Resume, But Charts Reflect Lingering Investor Caution

According to data from Glassnode, after weeks of consecutive outflows, spot ETH ETFs are finally showing initial "signs of recovery." Since November 21st, ETF net asset values have rebounded by 28%, suggesting potential improvement in market demand before year-end. However, compared to the peak of $32 billion in early October, the magnitude of this rebound remains modest, indicating that institutional confidence has not yet fully recovered.
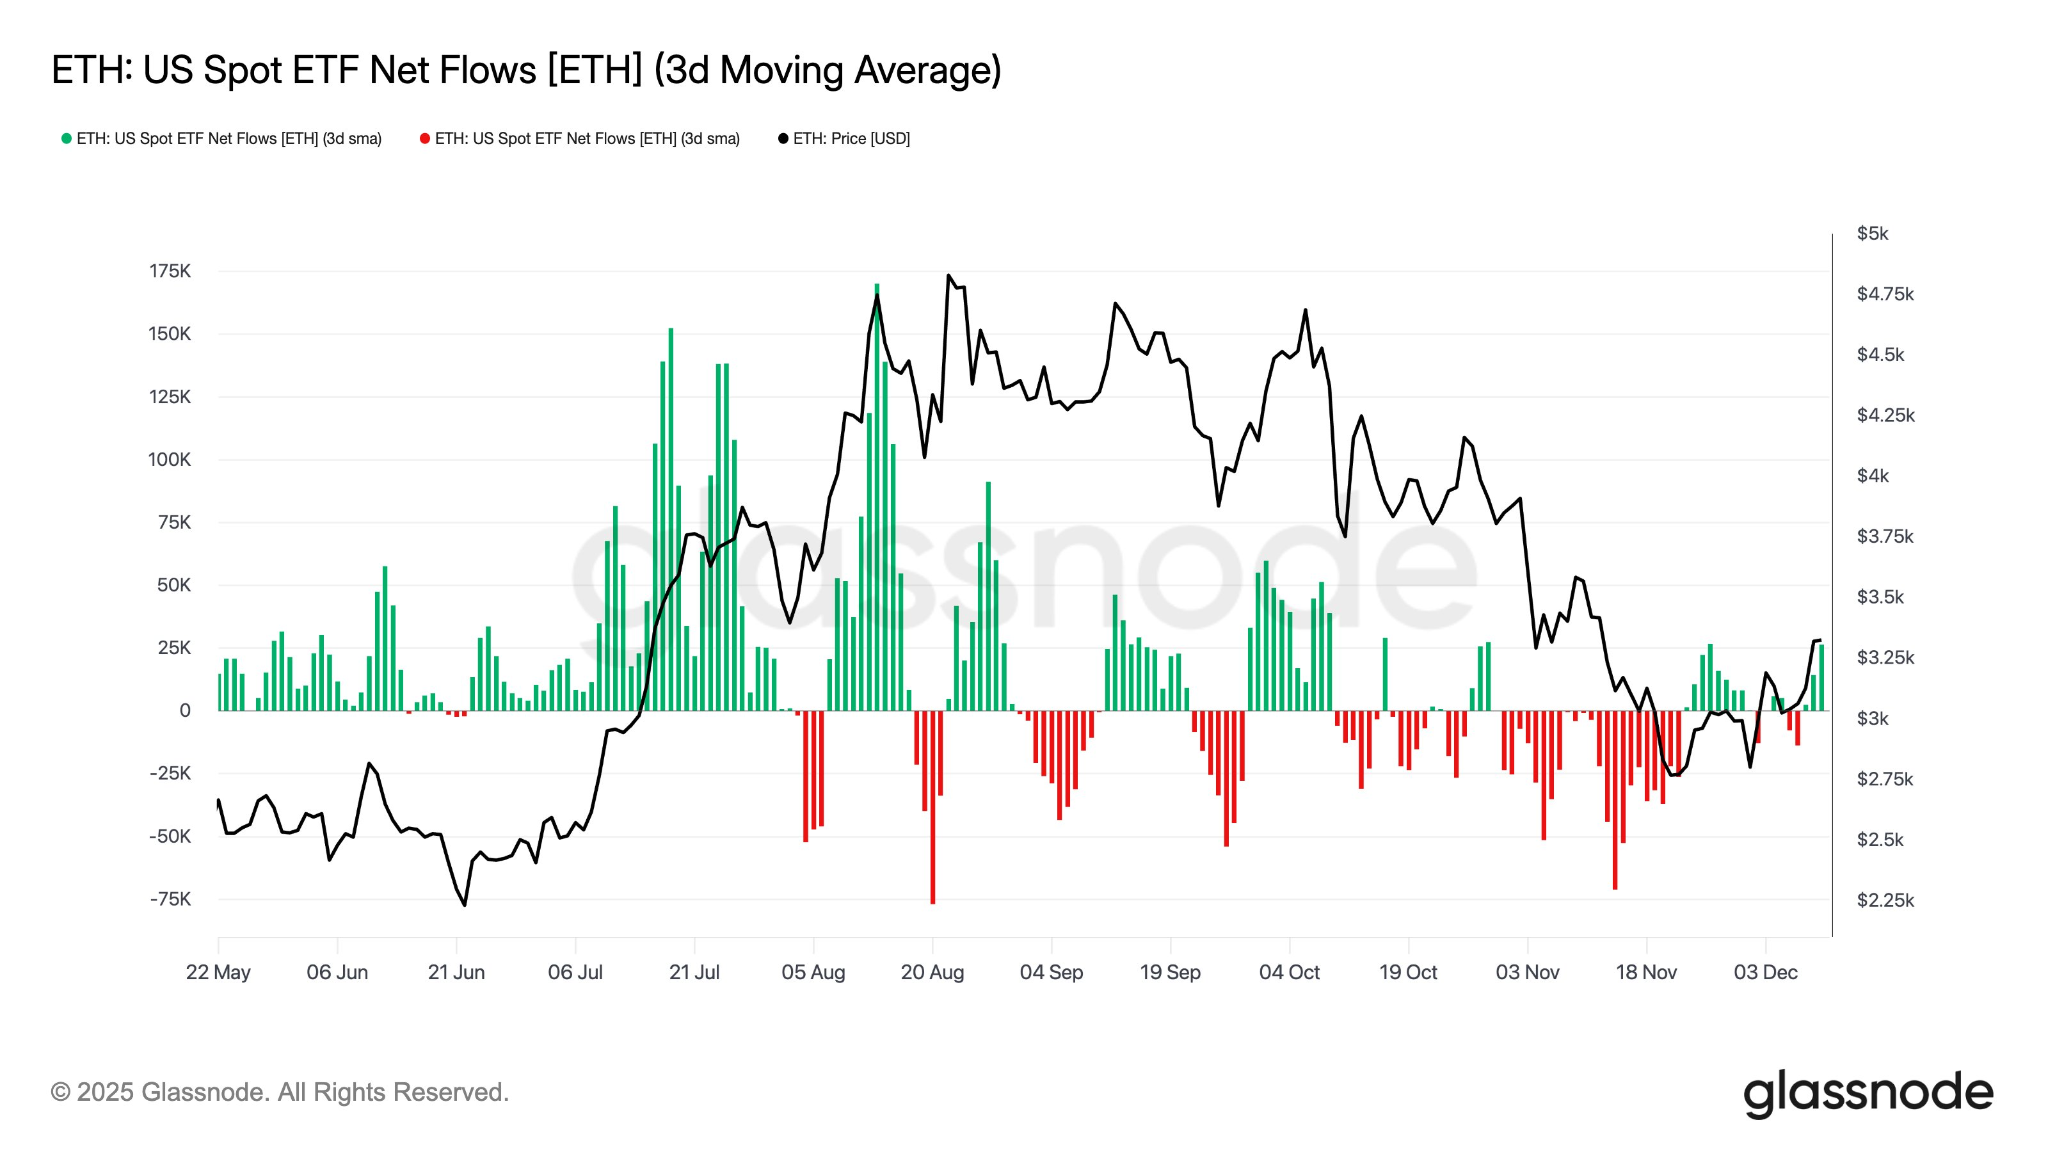
Spot ETH ETF Net Flow. Source: Glassnode

Data from CryptoQuant further supports this assessment. Although the net flow remains negative (-$138 million), it has improved significantly from the -$500 million seen in October, marking a structural shift. During the correction phase from September to October, the market was dominated by active selling, but this trend is gradually subsiding.

The 30-day moving average of net active buying volume is also showing a pattern of rising lows. A similar structure appeared in early 2025, after which the Ethereum price achieved a nearly 3-fold increase and reached a new all-time high.

If the current trend continues, this positive shift in active buying activity could become a key catalyst driving Ethereum to break out upward again in the coming weeks.
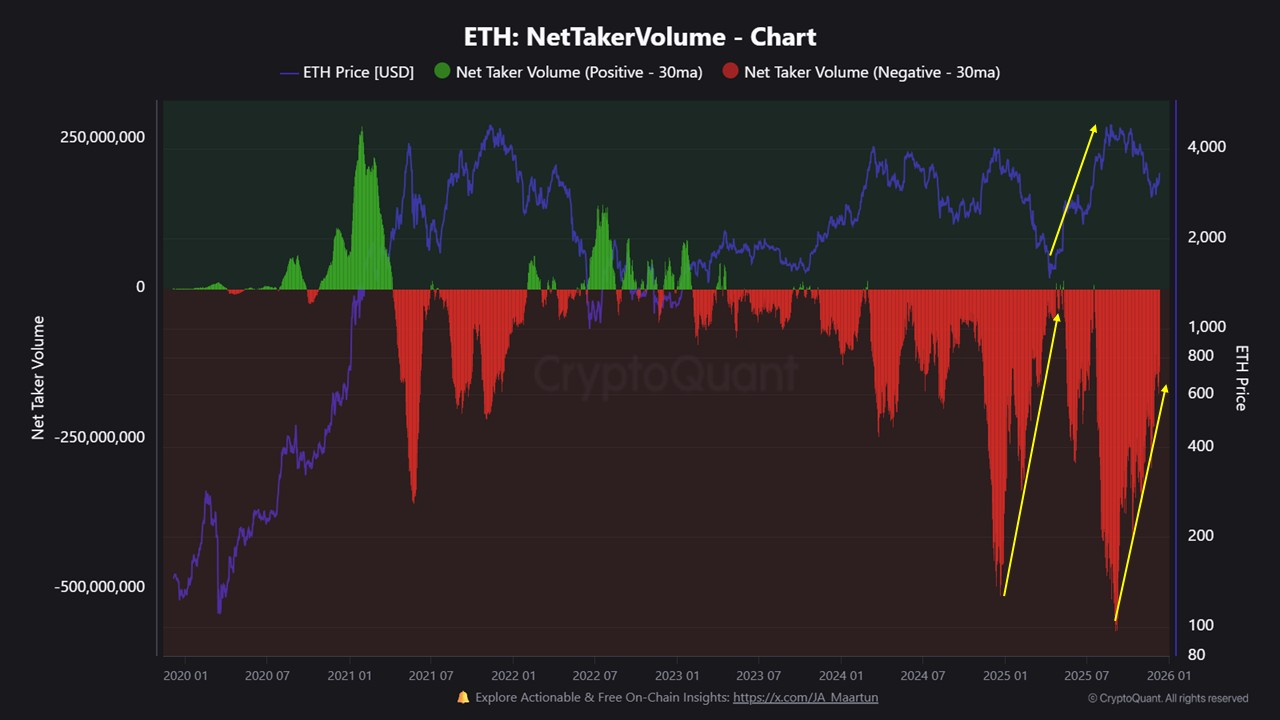

Ethereum On-Chain Flow Data. Source: CryptoQuant


ETH Price Consolidates in Support Zone, Derivatives Market Cools Off

The current Ethereum price is testing the order block density zone between $3,100 and $3,180 on the 4-hour chart, an area that could transform into near-term demand support. Although the ETH price remains within an ascending channel, the upward momentum has noticeably weakened. The market is in a structural decision-making phase regarding its direction.
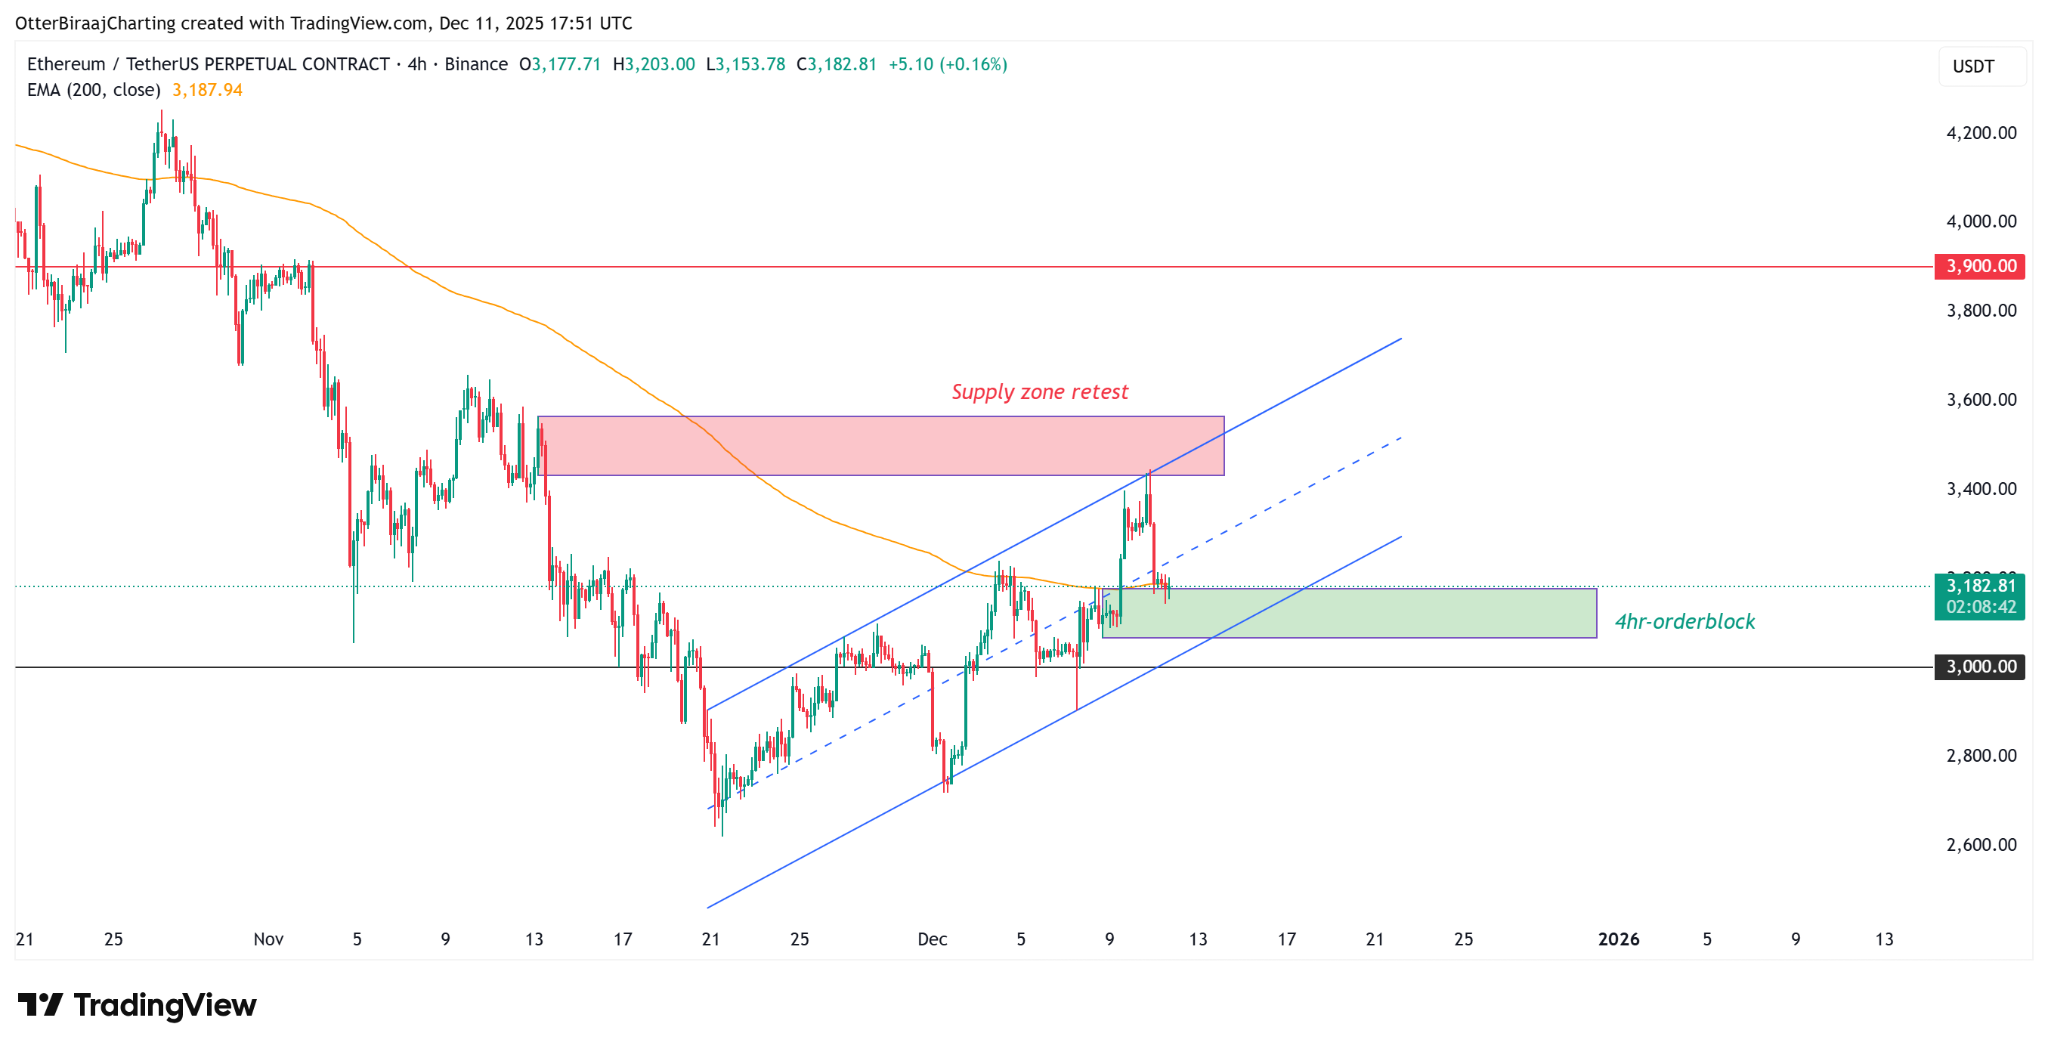

4-Hour Price Chart. Source: TradingView

From a bullish perspective, if the price can hold above this demand zone and the channel support, ETH could potentially attack the daily 200-day EMA again. A clear break above $3,450 would invalidate the previously formed resistance and open the path for the price to test the $3,900 resistance level.

From a bearish viewpoint, a break below the lower trendline of the current ascending channel would constitute a bearish signal, potentially leading the price to test the key $3,000 support level.

Data from Hyblock shows the Ethereum derivatives market presents a neutral yet fragile landscape. After the price met resistance, the Total Open Interest (OI) slightly declined. Funding rates are positive but not significantly high, and the buy-sell ratio is also near neutral, indicating that spot investors have not yet formed a consensus bullish expectation.
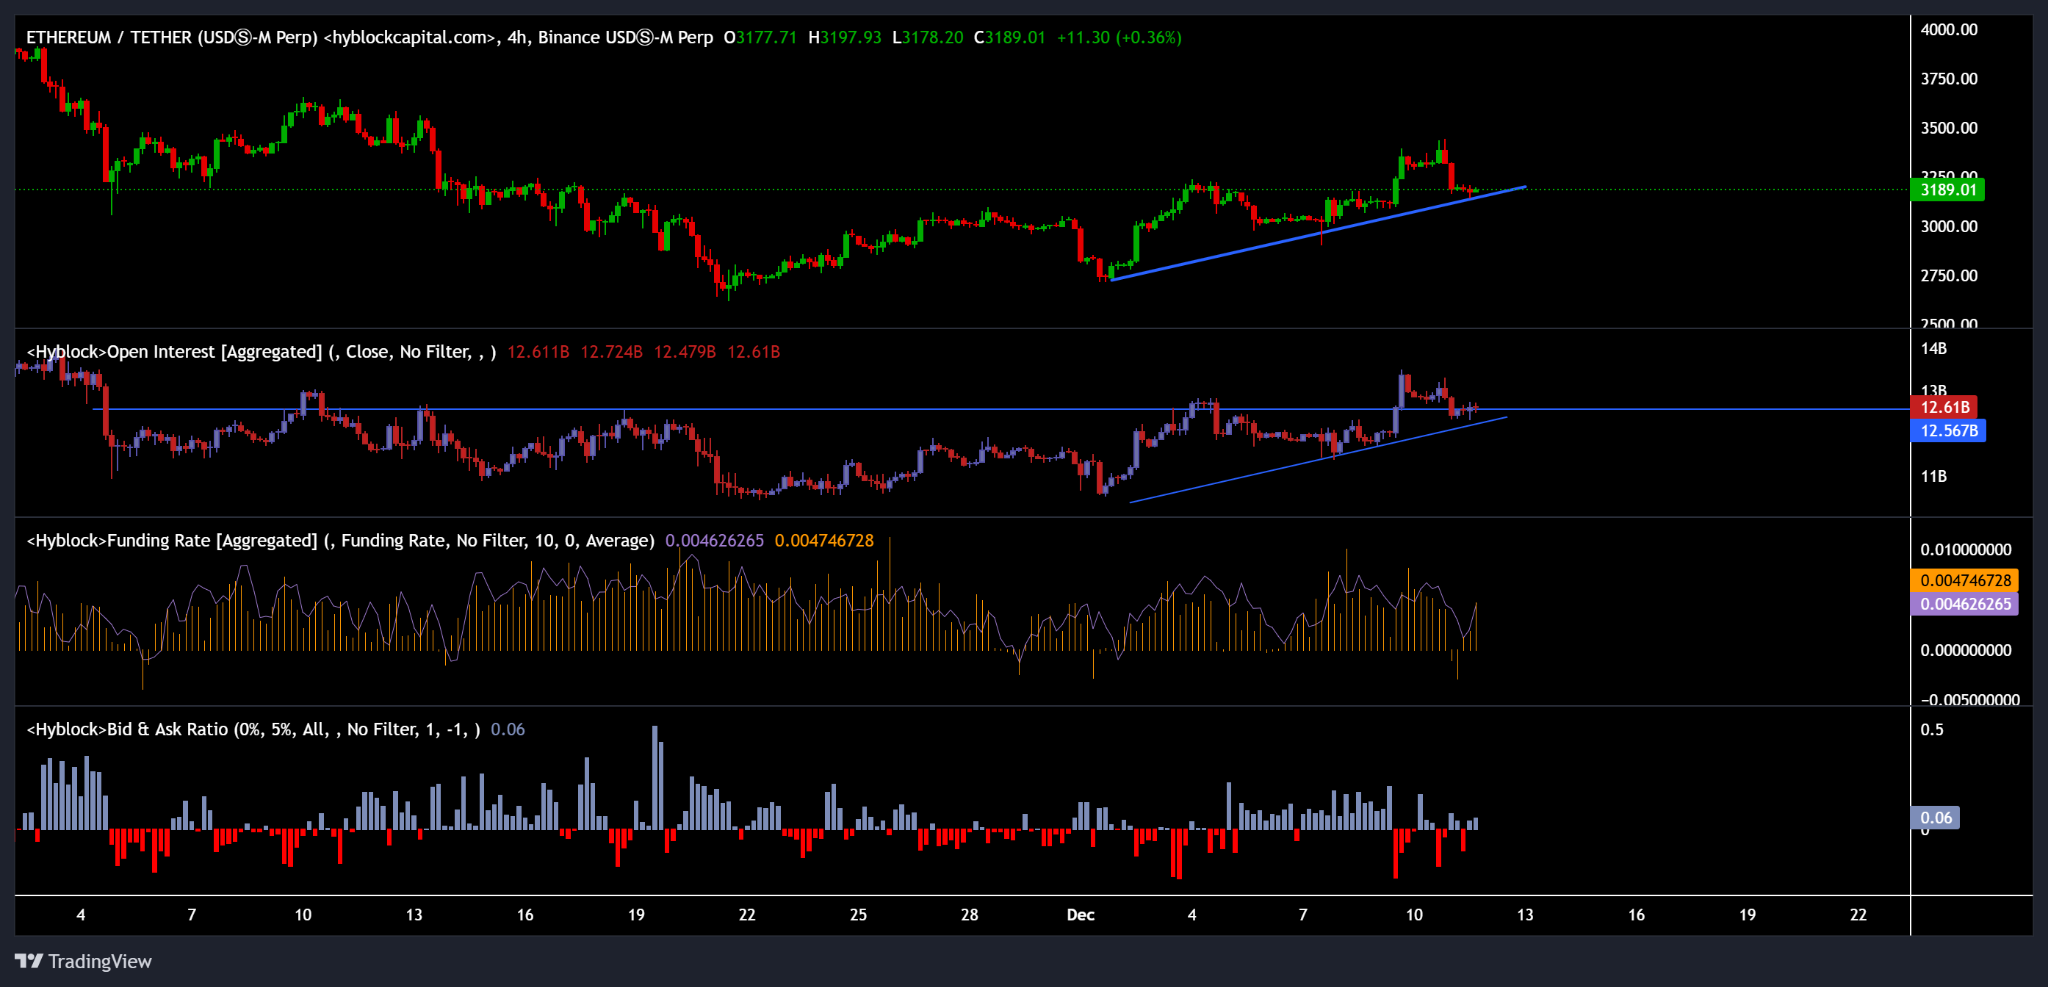
Ethereum Futures Market Data. Source: Hyblock Capital

Summary: The key to Ethereum's subsequent price action lies in whether the bulls can sustain their defense in the demand support area, thereby catalyzing a virtuous cycle between active buying flows and ETF demand, ultimately translating into sustained upward momentum.


Criptomoedas em alta

Perguntas relacionadas

QWhat is the current price range where Ethereum is consolidating, and what key resistance level is it facing?

AEthereum is currently consolidating around $3200, facing significant resistance in the $3650 to $3350 supply zone, which aligns with the 200-day Exponential Moving Average (EMA).

QHow much has the assets under management (AUM) for spot Ethereum ETFs increased since November 21, and what does this indicate?

ASince November 21, the AUM for spot Ethereum ETFs has increased by 28%, from $16.8 billion to $21.5 billion, indicating a potential recovery in market demand and a shift from strong selling pressure to returning buyer interest.

QWhat key on-chain metric from CryptoQuant shows a structural shift in market dynamics, and how has it improved?

AThe net flow metric, while still negative at -$138 million, has improved significantly from -$500 million in October, indicating a structural shift where the previously dominant active selling pressure is diminishing.

QWhat is the critical support zone on the 4-hour chart that Ethereum is testing, and what are the potential price targets for a bullish breakout?

AEthereum is testing the order block support zone between $3100 and $3180 on the 4-hour chart. A bullish breakout above the 200-day EMA and a clear break above $3450 could open the path for a move towards the $3900 resistance level.

QWhat does the data from Hyblock Capital indicate about the current sentiment in the Ethereum derivatives market?

AHyblock Capital data shows a neutral but fragile sentiment in the derivatives market. Open Interest (OI) has slightly decreased, funding rates are positive but not excessively high, and the buy-sell ratio is near neutral, indicating that spot investors have not yet formed a strong, unified bullish consensus.

Leituras Relacionadas

As Consensus Accelerates, What Are Young Investors Betting On?

Title: As Consensus Forms Faster, What Are Young Investors Betting On? In the rapid evolution of tech investment, a new generation of young investors is navigating a landscape where AI, robotics, commercial aerospace, and quantum computing are advancing simultaneously. Traditional investment logic based on financial models is giving way to a need for deep technical understanding and the ability to act before industry consensus forms. An analysis of trends from the "WAIC FUTURE TECH" list of young investment leaders reveals key shifts in focus. The first major trend is the movement of AI from the digital screen into the physical world. Investment is shifting from large language models and chatbots towards embodied AI, robotics, AI hardware, and edge computing. While demonstrations generate excitement, the real challenge lies in achieving scalable, reliable, and cost-effective delivery in complex real-world environments like factories and logistics. Success depends not just on algorithms but on the integration of sensors, actuators, and control systems. Second, the competitive focus for large models is moving beyond raw capability toward building an "intelligence flywheel." The goal is to create self-reinforcing systems where user interaction generates data, improving the model, which in turn enhances the user experience and attracts more engagement. Companies that successfully embed AI into workflows to create these closed-loop systems can build lasting value that isn't easily erased by the next model upgrade. Third, facing a potential bottleneck in high-quality human-generated data, investors are looking at new underlying technologies. Reinforcement learning and self-play, as demonstrated by AlphaGo Zero, offer paths for AI to generate its own experience. Scientific foundation models, which aim to build general AI capabilities for fields like life sciences and materials discovery, represent a non-consensus direction that could unlock new frontiers of knowledge and data. Finally, in deep-tech areas like quantum computing, commercial aerospace, and space-based infrastructure, patient capital is essential. These fields have long, uncertain development and validation cycles involving complex engineering, supply chains, and regulations. Investment here requires a long-term view, focusing on foundational team capabilities and the eventual emergence of market demand, even if commercial returns are distant. Collectively, these trends illustrate how young investors are adapting to a new era. They are learning to make earlier, technically-informed judgments, balance hype with real-world viability, and provide the patient capital needed to build the deep-tech foundations of the future.

marsbitHá 27m

As Consensus Accelerates, What Are Young Investors Betting On?

marsbitHá 27m

Can Japan Buy Growth with AI? Will the Bond Market Believe It?

Japan's cabinet has introduced the 2026 Basic Policy on Economic and Fiscal Management and Reform, shifting its primary fiscal target. The new framework moves away from the traditional annual primary balance goal and instead prioritizes a stable reduction of the debt-to-GDP ratio. This change is tied to a strategy of increased "responsible proactive fiscal" spending, aiming to boost long-term growth through investments in strategic sectors like AI, semiconductors, energy, and robotics. The government estimates total public and private investment in 62 key technologies could exceed 370 trillion yen by 2040. The market reaction has been mixed and cautious. While equity markets may respond to policy signals, bond markets are focused on fiscal credibility. Concerns center on whether the weakening of the clear primary balance anchor could lead to looser fiscal discipline. If investors doubt that these strategic investments will generate sufficient productivity gains, tax revenue, and nominal growth to outpace rising interest costs, they may demand higher yields on Japanese Government Bonds (JGBs). Recent volatility in the yen and JGB yields, with the 10-year yield briefly reaching 2.9%, reflects this skepticism. The success of this new framework hinges on two factors: whether Japan can achieve a nominal growth rate consistently higher than its long-term interest rates, and whether future budgets demonstrate disciplined control over bond issuance. The government's narrative is that strategic investment is essential to break Japan's cycle of low growth, aging, and labor shortages. However, the bond market will continuously assess the credibility of this plan, pricing the risk that it may represent fiscal expansion rather than a viable growth strategy.

marsbitHá 1h

Can Japan Buy Growth with AI? Will the Bond Market Believe It?

marsbitHá 1h

Misjudged A-Shares: Resilience, Expectations, and Confidence

China's A-share market recently faced selling pressure, especially in tech sectors, initially triggered by a global tech sell-off that began in South Korea. However, the article argues this is a case of "mistaken injury" and highlights the market's underlying resilience. This resilience stems from three main pillars: **1) Tech Sector Fundamentals:** Unlike Korea's market dominated by a few memory chip stocks, China's tech sector is diversified across computing, communications, electronics, and semiconductors, supported by dual narratives of global AI supply chains and domestic substitution. Core areas like optical modules and fiber optics continue to show strong earnings growth. **2) "National Team" Support:** State-backed institutions and large corporations have made significant market purchases and announced buybacks, providing liquidity and signaling confidence. This is seen as a stabilizing policy signal, often associated with market bottoms. **3) Broader Market Pillars:** Other major sectors are showing endogenous recovery momentum. Consumer stocks benefit from stabilizing CPI and signs of sector recovery (e.g., liquor price hikes). Cyclical sectors like aluminum have high earnings, potential price increases due to tight supply, and low valuations. The financial sector offers stable dividends and low valuations. The conclusion is that the sell-off was driven by external contagion, not a collapse in fundamentals. With strong policy support and recovering momentum across key sectors, the A-share market possesses the toughness to regain stability.

marsbitHá 1h

Misjudged A-Shares: Resilience, Expectations, and Confidence

marsbitHá 1h

Trading

Spot

Artigos em Destaque

Como comprar FLOW

Bem-vindo à HTX.com!Tornámos a compra de Flow (FLOW) simples e conveniente.Segue o nosso guia passo a passo para iniciar a tua jornada no mundo das criptos.Passo 1: cria a tua conta HTXUtiliza o teu e-mail ou número de telefone para te inscreveres numa conta gratuita na HTX.Desfruta de um processo de inscrição sem complicações e desbloqueia todas as funcionalidades.Obter a minha contaPasso 2: vai para Comprar Cripto e escolhe o teu método de pagamentoCartão de crédito/débito: usa o teu visa ou mastercard para comprar Flow (FLOW) instantaneamente.Saldo: usa os fundos da tua conta HTX para transacionar sem problemas.Terceiros: adicionamos métodos de pagamento populares, como Google Pay e Apple Pay, para aumentar a conveniência.P2P: transaciona diretamente com outros utilizadores na HTX.Mercado de balcão (OTC): oferecemos serviços personalizados e taxas de câmbio competitivas para os traders.Passo 3: armazena teu Flow (FLOW)Depois de comprar o teu Flow (FLOW), armazena-o na tua conta HTX.Alternativamente, podes enviá-lo para outro lugar através de transferência blockchain ou usá-lo para transacionar outras criptomoedas.Passo 4: transaciona Flow (FLOW)Transaciona facilmente Flow (FLOW) no mercado à vista da HTX.Acede simplesmente à tua conta, seleciona o teu par de trading, executa as tuas transações e monitoriza em tempo real.Oferecemos uma experiência de fácil utilização tanto para principiantes como para traders experientes.

279 Visualizações TotaisPublicado em {updateTime}Atualizado em 2026.06.02

Como comprar FLOW

Discussões

Bem-vindo à Comunidade HTX. Aqui, pode manter-se informado sobre os mais recentes desenvolvimentos da plataforma e obter acesso a análises profissionais de mercado. As opiniões dos utilizadores sobre o preço de FLOW (FLOW) são apresentadas abaixo.

活动图片












