Ethereum "Cooling Off" to Build Momentum? ETF Funds Quietly Flow Back, Is the Historic Rally Script About to Play Out Again?

marsbitPublicado em 2025-12-12Última atualização em 2025-12-12

Resumo

Ethereum's price has been consolidating near $3,200 after facing resistance between $3,350 and $3,650, a zone reinforced by the 200-day EMA. Despite this, signs of recovery are emerging in spot ETF flows. Since November 21, ETH ETF assets under management have increased by 28%, from $16.8 billion to $21.5 billion, indicating a gradual return of buyer interest. Although net flows remain negative at -$138 million, this marks a significant improvement from October’s -$500 million, suggesting weakening selling pressure. The 30-day moving average of net active buying is also rising, resembling a pattern seen in early 2025 that preceded a major price surge. On the 4-hour chart, ETH is testing a key demand zone between $3,100 and $3,180. A hold above this level could lead to a retest of the 200-day EMA and a breakout toward $3,900. However, a breakdown may trigger a drop toward $3,000. Derivatives data shows neutral sentiment with mild funding rates and open interest, indicating cautious optimism. The key for Ethereum’s next major move depends on sustained defense at current support levels, coupled with growing ETF inflows and active buying momentum.

Ethereum's price action has flattened this week, encountering significant resistance in the supply zone between $3,650 and $3,350. The token is currently consolidating near $3,200. This resistance level roughly coincides with the 200-day Exponential Moving Average (EMA), further reinforcing the overhead pressure in this area. Notably, just as this is happening, spot Exchange Traded Fund (ETF) flows are beginning to show initial signs of recovery.

Key Points:

  • Since November 21st, the Assets Under Management (AUM) for spot Ethereum ETFs have increased from $16.8 billion to $21.5 billion, a gain of 28%.
  • Net active buying volume is showing an upward trend, indicating that the previously strong selling pressure is weakening, while buying power is gradually returning.

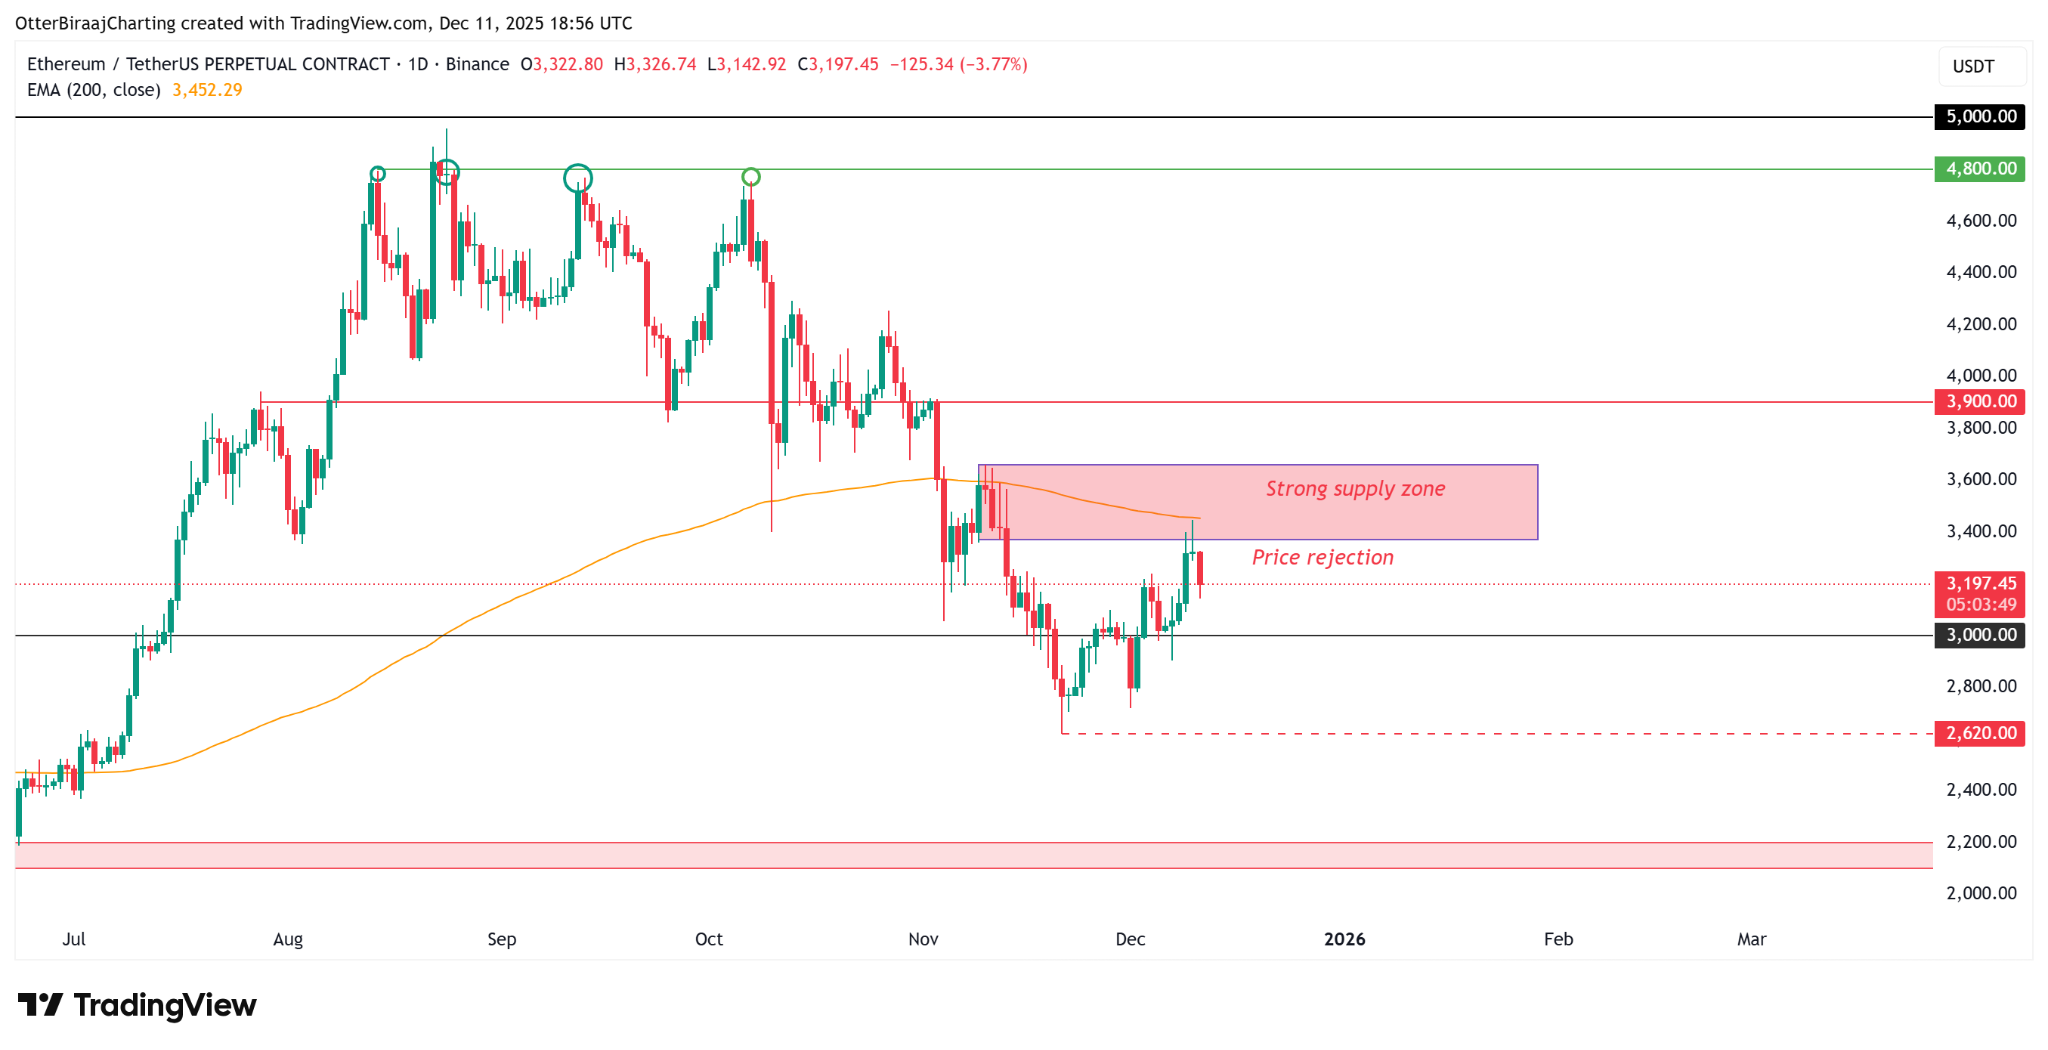
Ethereum Daily Chart. Source: TradingView


ETF Inflows Resume, But Charts Reflect Lingering Investor Caution

According to data from Glassnode, after weeks of consecutive outflows, spot ETH ETFs are finally showing initial "signs of recovery." Since November 21st, ETF net asset values have rebounded by 28%, suggesting potential improvement in market demand before year-end. However, compared to the peak of $32 billion in early October, the magnitude of this rebound remains modest, indicating that institutional confidence has not yet fully recovered.

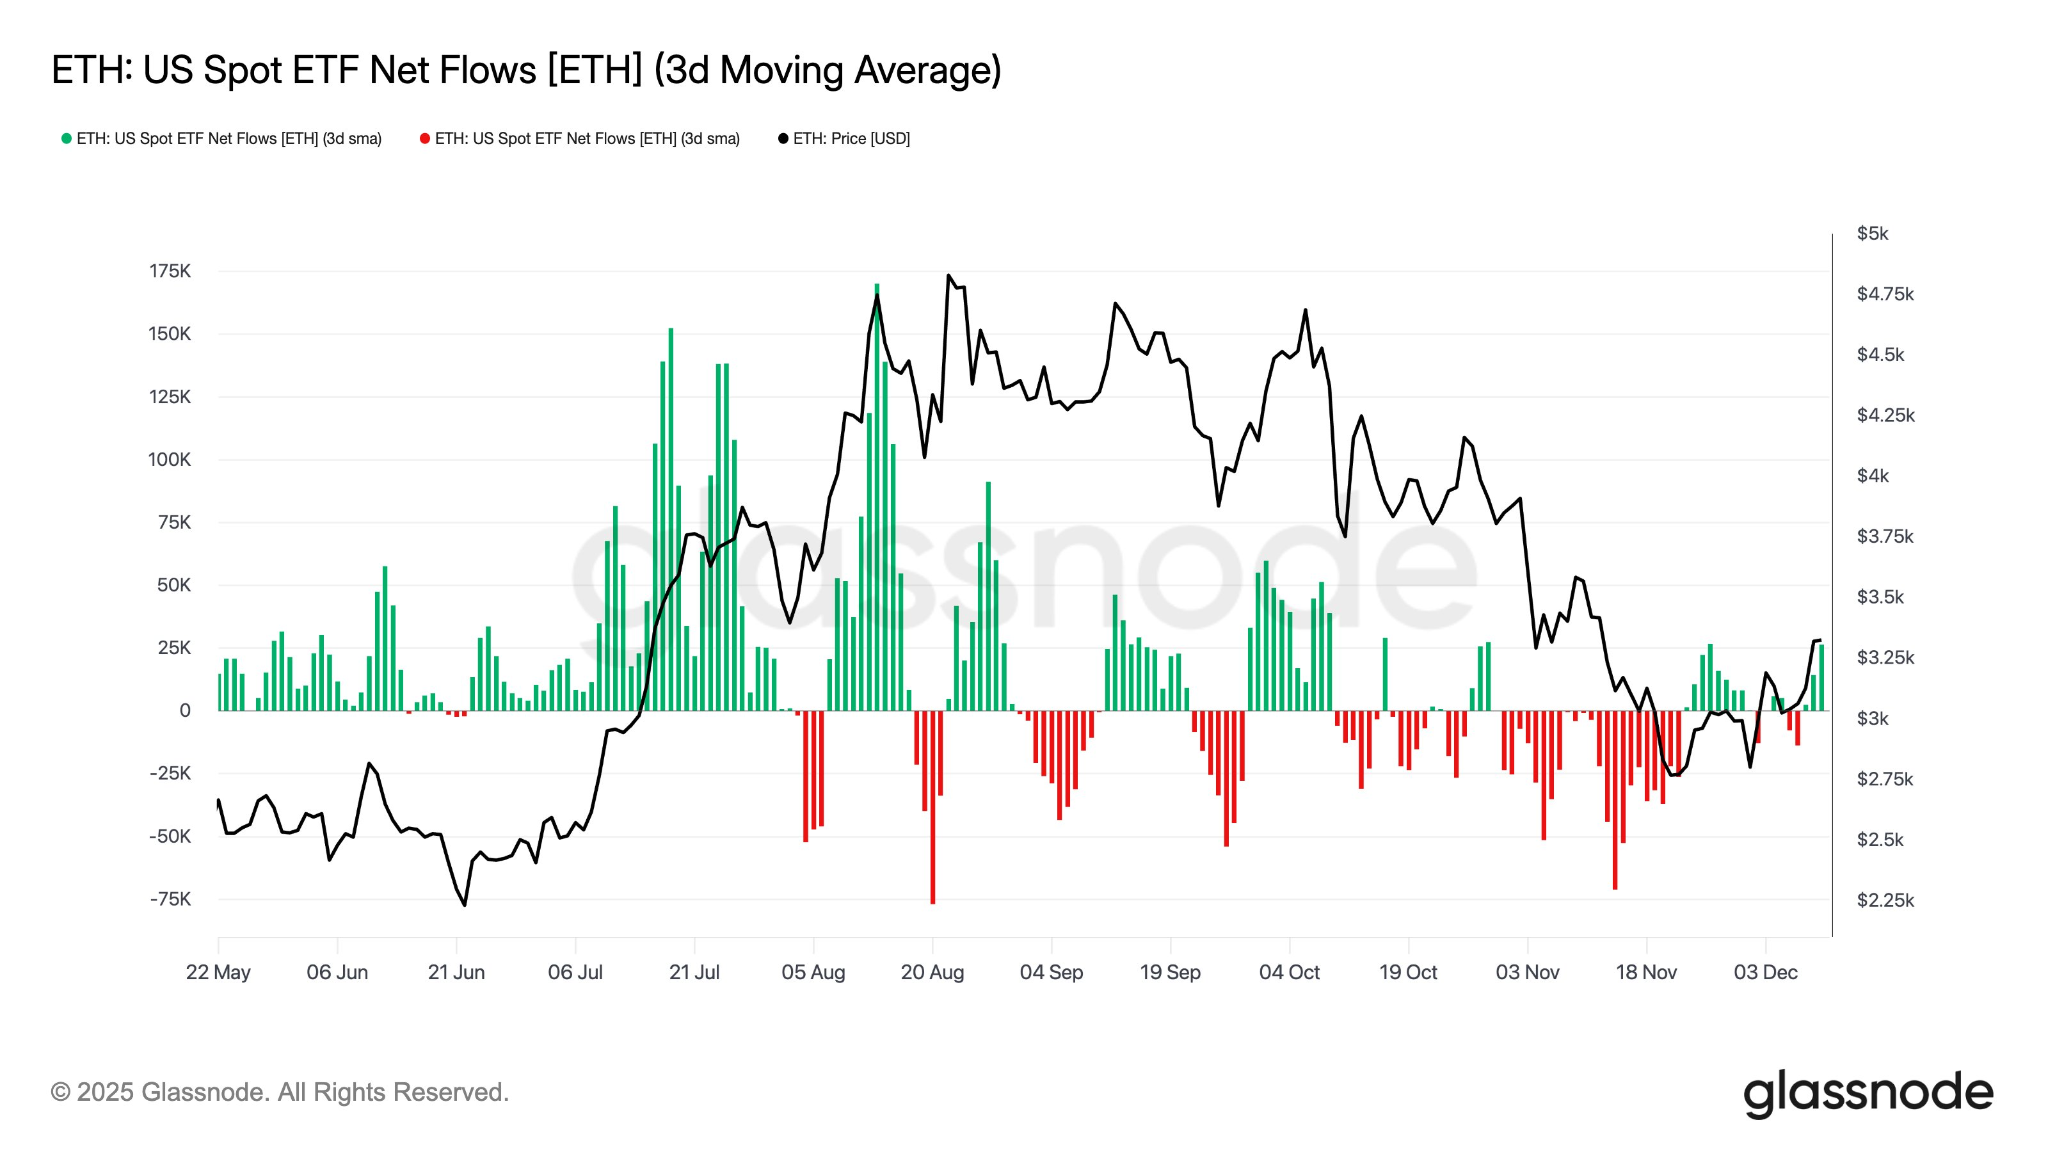
Spot ETH ETF Net Flow. Source: Glassnode

Data from CryptoQuant further supports this assessment. Although the net flow remains negative (-$138 million), it has improved significantly from the -$500 million seen in October, marking a structural shift. During the correction phase from September to October, the market was dominated by active selling, but this trend is gradually subsiding.

The 30-day moving average of net active buying volume is also showing a pattern of rising lows. A similar structure appeared in early 2025, after which the Ethereum price achieved a nearly 3-fold increase and reached a new all-time high.

If the current trend continues, this positive shift in active buying activity could become a key catalyst driving Ethereum to break out upward again in the coming weeks.


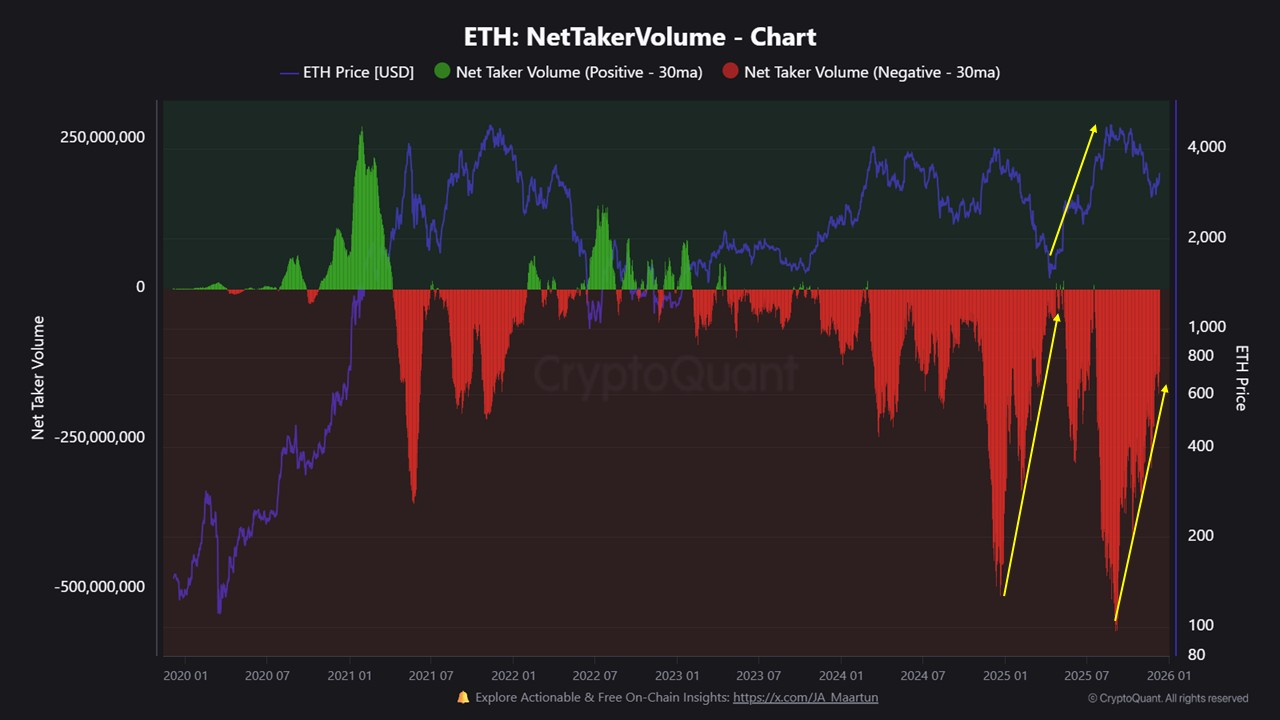
Ethereum On-Chain Flow Data. Source: CryptoQuant


ETH Price Consolidates in Support Zone, Derivatives Market Cools Off

The current Ethereum price is testing the order block density zone between $3,100 and $3,180 on the 4-hour chart, an area that could transform into near-term demand support. Although the ETH price remains within an ascending channel, the upward momentum has noticeably weakened. The market is in a structural decision-making phase regarding its direction.


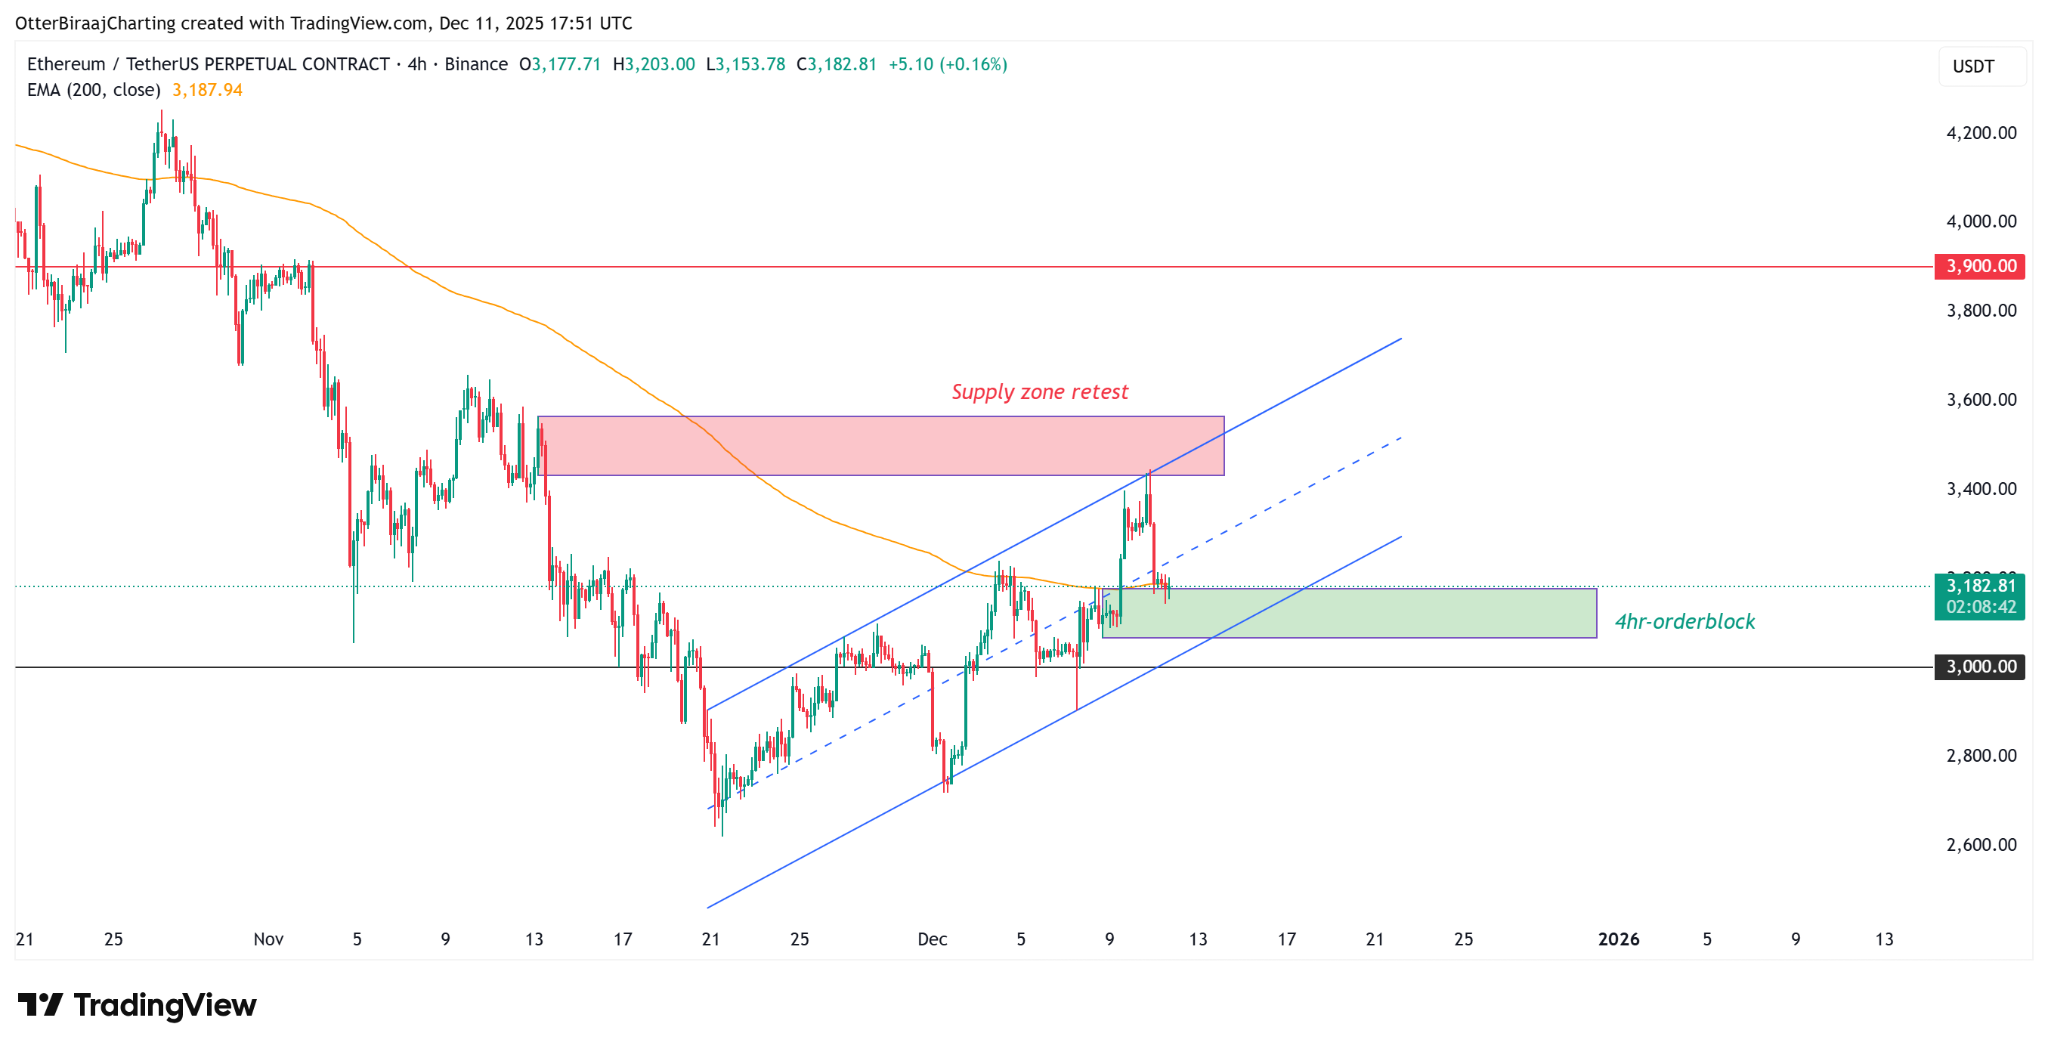
4-Hour Price Chart. Source: TradingView

From a bullish perspective, if the price can hold above this demand zone and the channel support, ETH could potentially attack the daily 200-day EMA again. A clear break above $3,450 would invalidate the previously formed resistance and open the path for the price to test the $3,900 resistance level.

From a bearish viewpoint, a break below the lower trendline of the current ascending channel would constitute a bearish signal, potentially leading the price to test the key $3,000 support level.

Data from Hyblock shows the Ethereum derivatives market presents a neutral yet fragile landscape. After the price met resistance, the Total Open Interest (OI) slightly declined. Funding rates are positive but not significantly high, and the buy-sell ratio is also near neutral, indicating that spot investors have not yet formed a consensus bullish expectation.

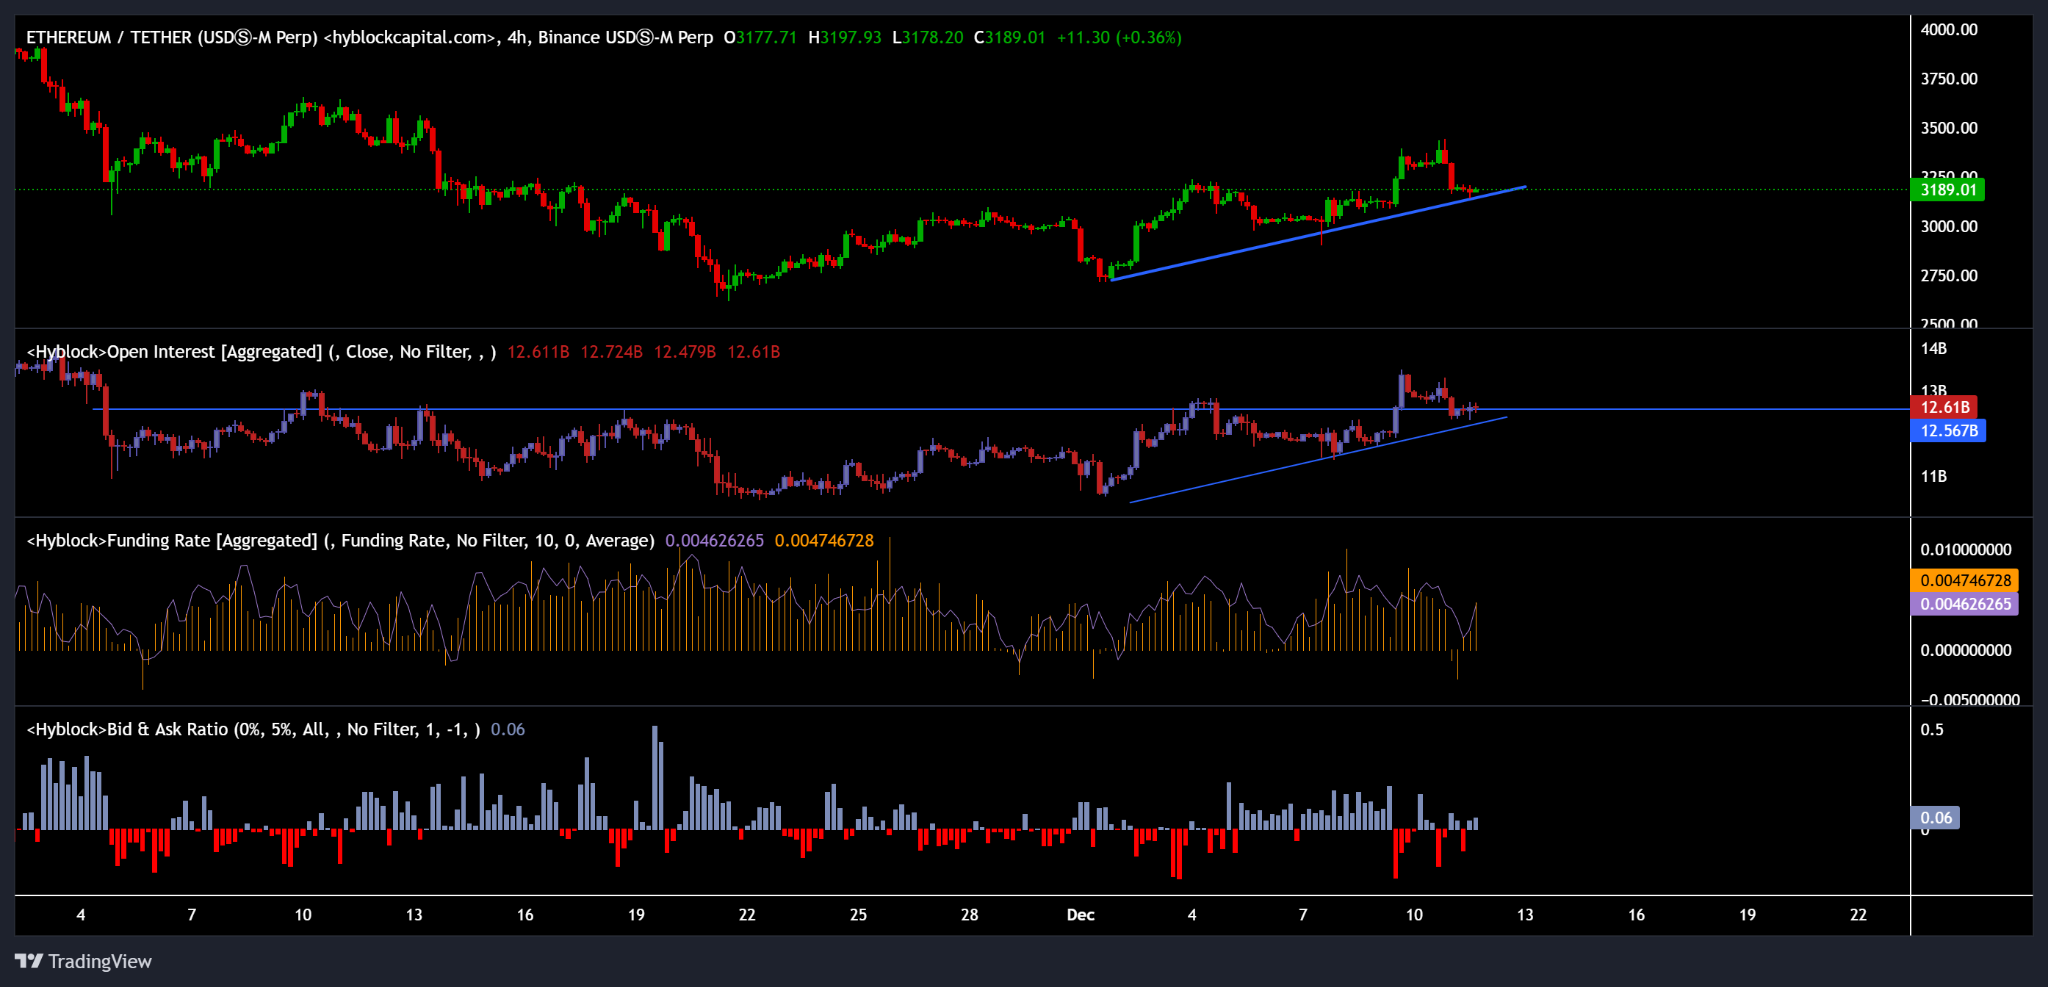
Ethereum Futures Market Data. Source: Hyblock Capital

Summary: The key to Ethereum's subsequent price action lies in whether the bulls can sustain their defense in the demand support area, thereby catalyzing a virtuous cycle between active buying flows and ETF demand, ultimately translating into sustained upward momentum.

Perguntas relacionadas

QWhat is the current price range where Ethereum is consolidating, and what key resistance level is it facing?

AEthereum is currently consolidating around $3200, facing significant resistance in the $3650 to $3350 supply zone, which aligns with the 200-day Exponential Moving Average (EMA).

QHow much has the assets under management (AUM) for spot Ethereum ETFs increased since November 21, and what does this indicate?

ASince November 21, the AUM for spot Ethereum ETFs has increased by 28%, from $16.8 billion to $21.5 billion, indicating a potential recovery in market demand and a shift from strong selling pressure to returning buyer interest.

QWhat key on-chain metric from CryptoQuant shows a structural shift in market dynamics, and how has it improved?

AThe net flow metric, while still negative at -$138 million, has improved significantly from -$500 million in October, indicating a structural shift where the previously dominant active selling pressure is diminishing.

QWhat is the critical support zone on the 4-hour chart that Ethereum is testing, and what are the potential price targets for a bullish breakout?

AEthereum is testing the order block support zone between $3100 and $3180 on the 4-hour chart. A bullish breakout above the 200-day EMA and a clear break above $3450 could open the path for a move towards the $3900 resistance level.

QWhat does the data from Hyblock Capital indicate about the current sentiment in the Ethereum derivatives market?

AHyblock Capital data shows a neutral but fragile sentiment in the derivatives market. Open Interest (OI) has slightly decreased, funding rates are positive but not excessively high, and the buy-sell ratio is near neutral, indicating that spot investors have not yet formed a strong, unified bullish consensus.

Leituras Relacionadas

From Theft to Re-entry: How Was $292 Million "Laundered"?

A sophisticated crypto laundering operation was executed following the $292 million hack of Kelp DAO on April 18. The attack, attributed to the North Korean Lazarus group, began with anonymous infrastructure preparation using Tornado Cash to fund wallets untraceably. The hacker exploited a vulnerability in Kelp’s cross-chain bridge, stealing 116,500 rsETH. To avoid crashing the market, the attacker used Aave and Compound as laundering tools—depositing the stolen rsETH as collateral to borrow $190 million in clean, liquid ETH. This move triggered a bank run on Aave, causing an $8 billion drop in TVL. After consolidating funds, the attacker fragmented them across hundreds of wallets to evade detection. A major breakpoint was THORChain, where over $460 million in volume—30 times its usual activity—was processed in 24 hours, converting ETH into Bitcoin. This shift to Bitcoin’s UTXO model exponentially increased tracing complexity by shattering funds into countless untraceable fragments. The final destination was Tron-based USDT, the primary channel for illicit crypto flows. From there, funds were cashed out via OTC brokers in China and Southeast Asia, using unlicensed underground banks and UnionPay networks outside Western sanctions scope. Ultimately, the laundered money supports North Korea’s weapons programs, which rely heavily on crypto hacking for foreign currency. The incident underscores structural challenges in DeFi: its openness, composability, and lack of central control make such laundering not just possible, but inherently difficult to prevent.

marsbitHá 1h

From Theft to Re-entry: How Was $292 Million "Laundered"?

marsbitHá 1h

Google and Amazon Simultaneously Invest Heavily in a Competitor: The Most Absurd Business Logic of the AI Era Is Becoming Reality

In a span of four days, Amazon announced an additional $25 billion investment, and Google pledged up to $40 billion—both direct competitors pouring over $65 billion into the same AI startup, Anthropic. Rather than a typical venture capital move, this signals the latest escalation in the cloud wars. The core of the deal is not equity but compute pre-orders: Anthropic must spend the majority of these funds on AWS and Google Cloud services and chips, effectively locking in massive future compute consumption. This reflects a shift in cloud market dynamics—enterprises now choose cloud providers based on which hosts the best AI models, not just price or stability. With OpenAI deeply tied to Microsoft, Anthropic’s Claude has become the only viable strategic asset for Google and Amazon to remain competitive. Anthropic’s annualized revenue has surged to $30 billion, and it is expanding into verticals like biotech, positioning itself as a cross-industry AI infrastructure layer. However, this funding comes with constraints: Anthropic’s independence is challenged as it balances two rival investors, its safety-first narrative faces pressure from regulatory scrutiny, and its path to IPO introduces new financial pressures. Globally, this accelerates a "tri-polar" closed-loop structure in AI infrastructure, with Microsoft-OpenAI, Google-Anthropic, and Amazon-Anthropic forming exclusive model-cloud alliances. In contrast, China’s landscape differs—investments like Alibaba and Tencent backing open-source model firm DeepSeek reflect a more decoupled approach, though closed-source models from major cloud providers still dominate. The $65 billion bet is ultimately about securing a seat at the table in an AI-defined future—where missing the model layer means losing the cloud war.

marsbitHá 7h

Google and Amazon Simultaneously Invest Heavily in a Competitor: The Most Absurd Business Logic of the AI Era Is Becoming Reality

marsbitHá 7h

Trading

Spot
Futuros

Artigos em Destaque

Como comprar FLOW

Bem-vindo à HTX.com!Tornámos a compra de Flow (FLOW) simples e conveniente.Segue o nosso guia passo a passo para iniciar a tua jornada no mundo das criptos.Passo 1: cria a tua conta HTXUtiliza o teu e-mail ou número de telefone para te inscreveres numa conta gratuita na HTX.Desfruta de um processo de inscrição sem complicações e desbloqueia todas as funcionalidades.Obter a minha contaPasso 2: vai para Comprar Cripto e escolhe o teu método de pagamentoCartão de crédito/débito: usa o teu visa ou mastercard para comprar Flow (FLOW) instantaneamente.Saldo: usa os fundos da tua conta HTX para transacionar sem problemas.Terceiros: adicionamos métodos de pagamento populares, como Google Pay e Apple Pay, para aumentar a conveniência.P2P: transaciona diretamente com outros utilizadores na HTX.Mercado de balcão (OTC): oferecemos serviços personalizados e taxas de câmbio competitivas para os traders.Passo 3: armazena teu Flow (FLOW)Depois de comprar o teu Flow (FLOW), armazena-o na tua conta HTX.Alternativamente, podes enviá-lo para outro lugar através de transferência blockchain ou usá-lo para transacionar outras criptomoedas.Passo 4: transaciona Flow (FLOW)Transaciona facilmente Flow (FLOW) no mercado à vista da HTX.Acede simplesmente à tua conta, seleciona o teu par de trading, executa as tuas transações e monitoriza em tempo real.Oferecemos uma experiência de fácil utilização tanto para principiantes como para traders experientes.

237 Visualizações TotaisPublicado em {updateTime}Atualizado em 2025.03.21

Como comprar FLOW

Discussões

Bem-vindo à Comunidade HTX. Aqui, pode manter-se informado sobre os mais recentes desenvolvimentos da plataforma e obter acesso a análises profissionais de mercado. As opiniões dos utilizadores sobre o preço de FLOW (FLOW) são apresentadas abaixo.

活动图片