Don't Just Focus on Trading Volume: How to Understand the 'True vs. False Prosperity' of Perpetual Contracts

marsbitPublicado em 2026-02-20Última atualização em 2026-02-20

Resumo

While financial markets evolve, the explosive growth of perpetual futures (Perps) markets stands out. Perps allow leveraged, 24/7 speculation on assets without expiration dates, leading to a surge in trading volume. However, volume alone can be misleading, as it may reflect high-frequency, recursive activity rather than meaningful capital inflow. A more nuanced view emerges when combining volume with Open Interest (OI), which measures the total value of active, unsettled positions. While cumulative perpetual volume doubled to $14 trillion in the past six months (exceeding the previous four years' total), OI growth tells a deeper story. The OI-to-volume ratio, a measure of capital efficiency, has increased from 0.33x to 0.49x over the past year, indicating that more "patient capital" is being deployed and held as open risk. Analysis of top protocols reveals differences in efficiency. Hyperliquid leads with an OI/volume ratio over 45% and a high fee capture rate, demonstrating its ability to convert trading activity into sticky capital and revenue. In contrast, others prioritize different strategies, such as capital retention over fee maximization. Ultimately, the true measure of a perpetual market's strength lies not in volume alone but in its ability to foster trading conviction and sustainable monetization.

Just when you think finance is becoming dull and tedious, it always manages to surprise. Recently, it seems everyone is reshaping the financial system in ways few foresaw, including those from the entertainment and media industries.

Take Jimmy Donaldson (known as "MrBeast" on YouTube) as an example. He not only has a snack empire but recently also acquired a banking app aimed at promoting financial literacy and money management among teenagers and young adults. Why? Perhaps nothing is more straightforward than monetizing a subscriber base of 466 million users with financial products.

This summer, the world's largest derivatives exchange, CME Group, will launch single-stock futures, allowing users to trade futures on over 50 top U.S. stocks, including Alphabet, NVIDIA, Tesla, and Meta.

These restructurings show us how people's ways of engaging with finance are changing. And nothing illustrates this better than the explosion of the Perpetual Markets over the past few years.

Perpetual futures (or Perps) are a type of financial derivative contract that allows market participants to speculate on asset prices without an expiration date. Perps also enable people to express views on assets quickly and cheaply. They are more captivating than traditional markets because they offer instant access and leverage. Unlike traditional markets, they don't require broker onboarding processes, jurisdictional paperwork, or adherence to "traditional" market hours.

Furthermore, on-chain perpetual markets allow any asset (whether traditional or crypto) to be traded in a permissionless, highly leveraged manner. This makes speculation fun, especially when humans can't resist gambling on the trajectory of volatile assets outside traditional trading hours. This enables risk to be priced in real-time.

Consider what happened two weeks ago. When traditional and crypto markets crashed simultaneously, traders flocked to Hyperliquid, driving perpetual gold and silver trading into a frenzy. On January 31st, Hyperliquid alone accounted for 2% of the global daily trading volume in its silver (Silver) perpetual contract market, which had been live for less than a month.

This explains why dashboards of perpetual contract trading volume are increasingly dominating crypto communities and forums. Trading volume is an absolute value. It looks large, refreshes every few minutes, and is perfect for leaderboards. But it misses a key nuance: volume may reflect movement that lacks meaning. A market with high volume might have depth, but it could also be due to rewards and incentives encouraging higher-frequency activity. This activity is often recursive and not very meaningful.

This week, I delved into other metrics of the perpetual trading market. When used in conjunction with trading volume, these metrics add more dimensions and tell a completely different story from volume alone.

Let's begin.

A Few Data Points

The user-friendly interface of perpetual markets makes them a low-barrier, default platform for expressing views across various markets and global assets. The wide selection of highly leveraged derivative trading on both traditional and crypto assets on a single platform has led to perpetual contract volume surpassing spot trading volume on decentralized exchanges. From 44% in February 2025, the share of perpetual contract volume has soared to about 75% today (relative to spot volume).

This growth has been particularly significant in the past few months:

· The cumulative total perpetual trading volume across all platforms over the four years ending July 31, 2025, was $6.91 trillion.

· In just the past six months, this volume has doubled, reaching $14 trillion.
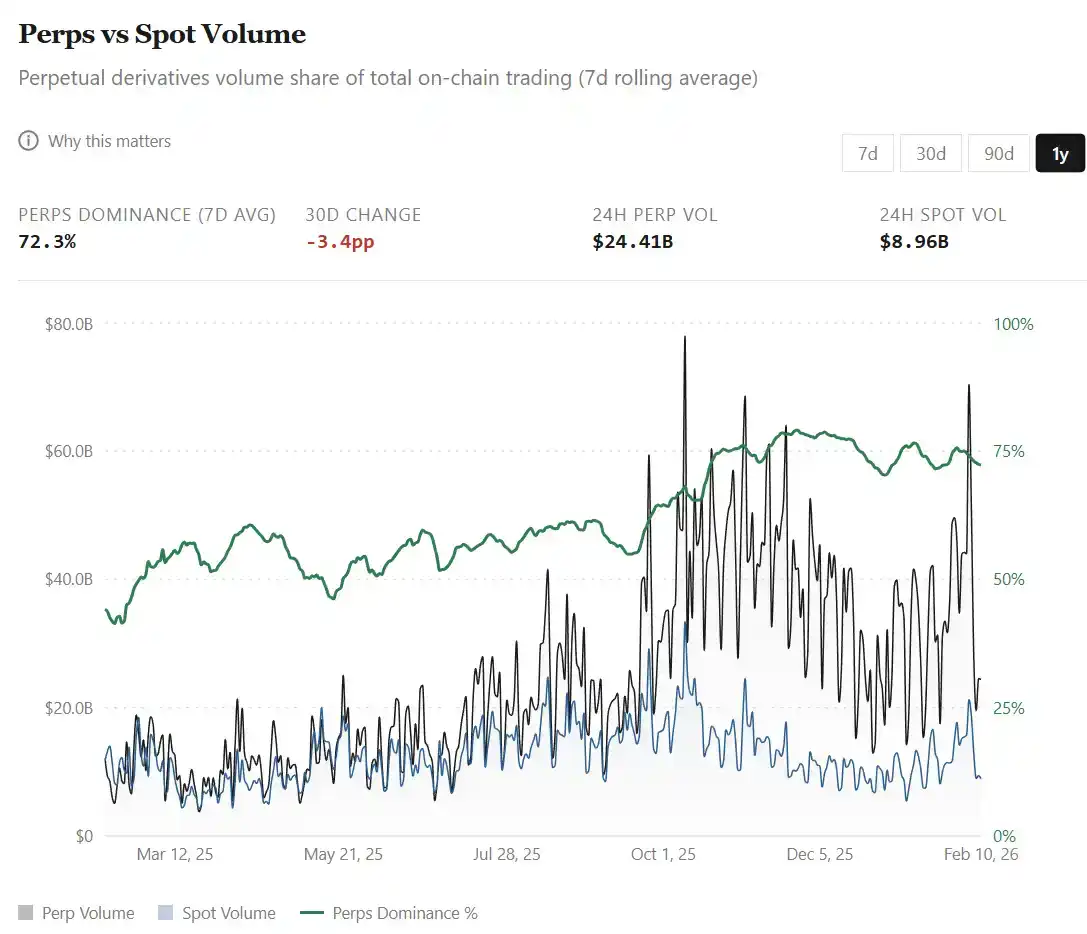
All this growth occurred against the backdrop of the total crypto market capitalization shrinking by nearly 40% between August 1, 2025, and February 9, 2026. This activity indicates that traders are increasingly leaning towards derivative trading, hedging, and short-term positioning, especially when spot markets become highly volatile and bearish.
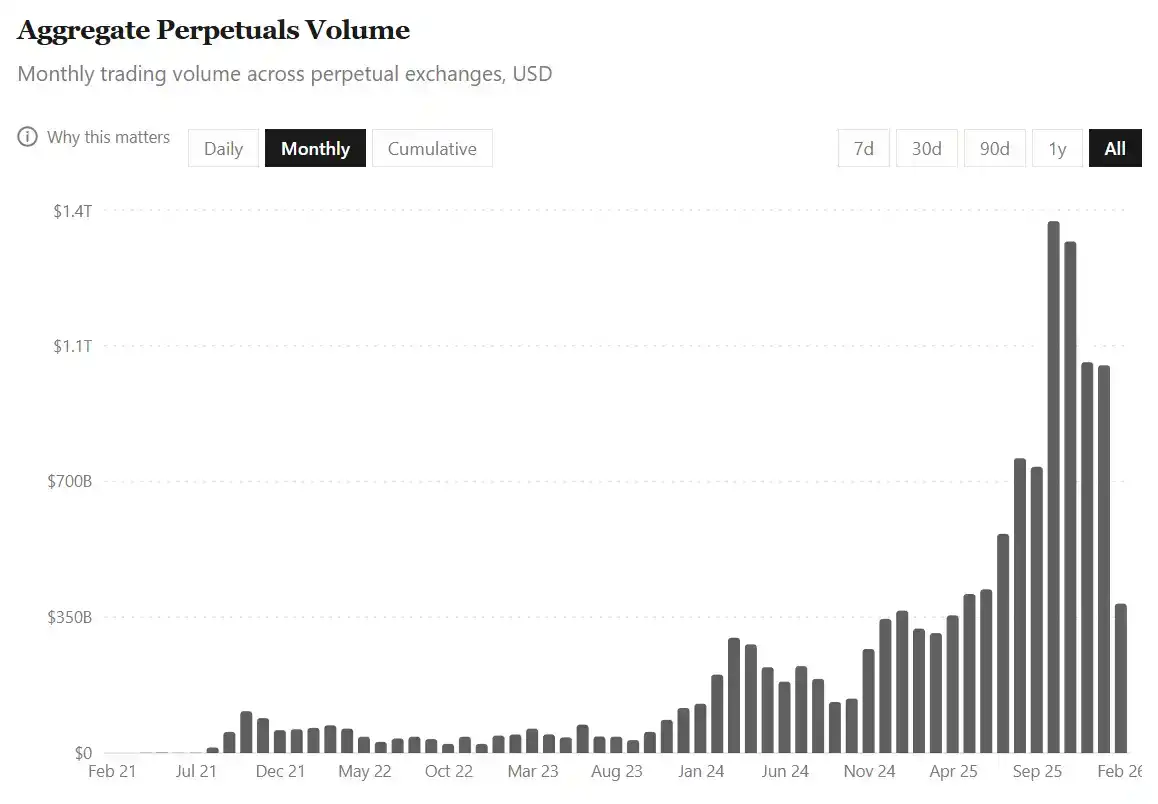
But there's a catch. With such massive activity, it's easy to misread volume metrics. Especially because perpetual trading isn't just about buying assets and holding them long-term; it also involves repeatedly adjusting bet sizes using leverage within shorter time frames.

Therefore, when market turnover accelerates rapidly, a question inevitably arises: Do record-breaking volumes reflect more capital inflows, or the same capital cycling faster?

This is where observing Open Interest (OI) becomes meaningful. If volume reflects capital flow, then OI measures outstanding risk exposure. On perpetual exchanges, OI refers to the total dollar value of active, unsettled long and short contracts held by traders.
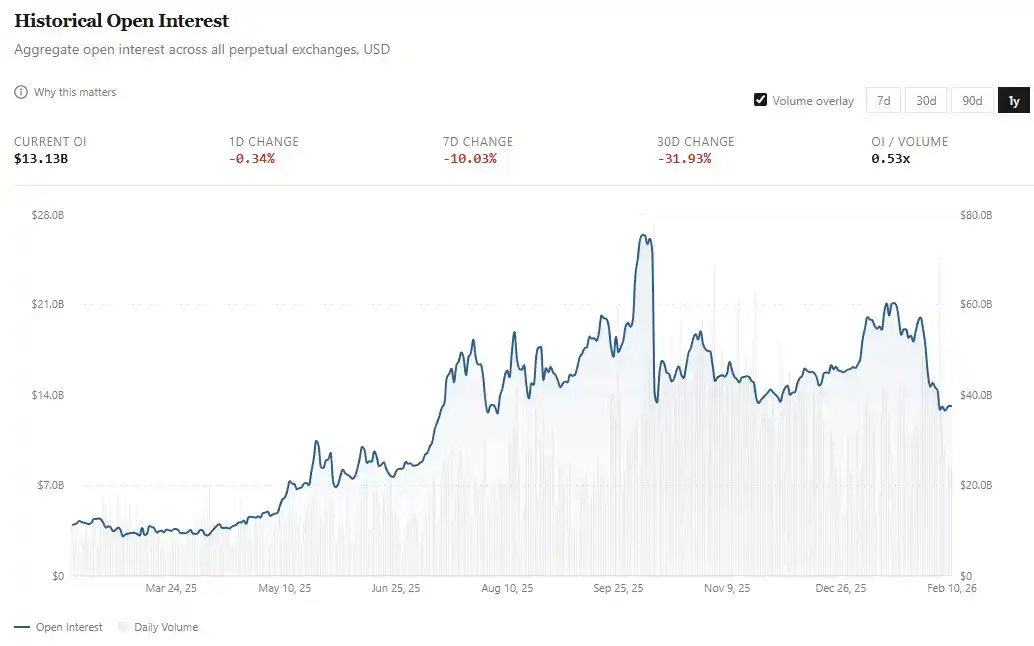
If perpetual trading is being adopted by the mass market, we would hope to see not only larger capital flows but also proportionally growing open interest.

· Last February, OI averaged around $4 billion;

· Now, that number has more than tripled to approximately $13 billion. In fact, the average for the entire January reached about $18 billion before dropping by about 30% in the first week of February.

While perpetual trading volume doubled over the past five months, OI grew by about 50% (from $13 billion to ~$18 billion, then back to $13 billion). To better understand this, I looked at the capital efficiency (i.e., OI as a percentage of daily volume) over the past year.
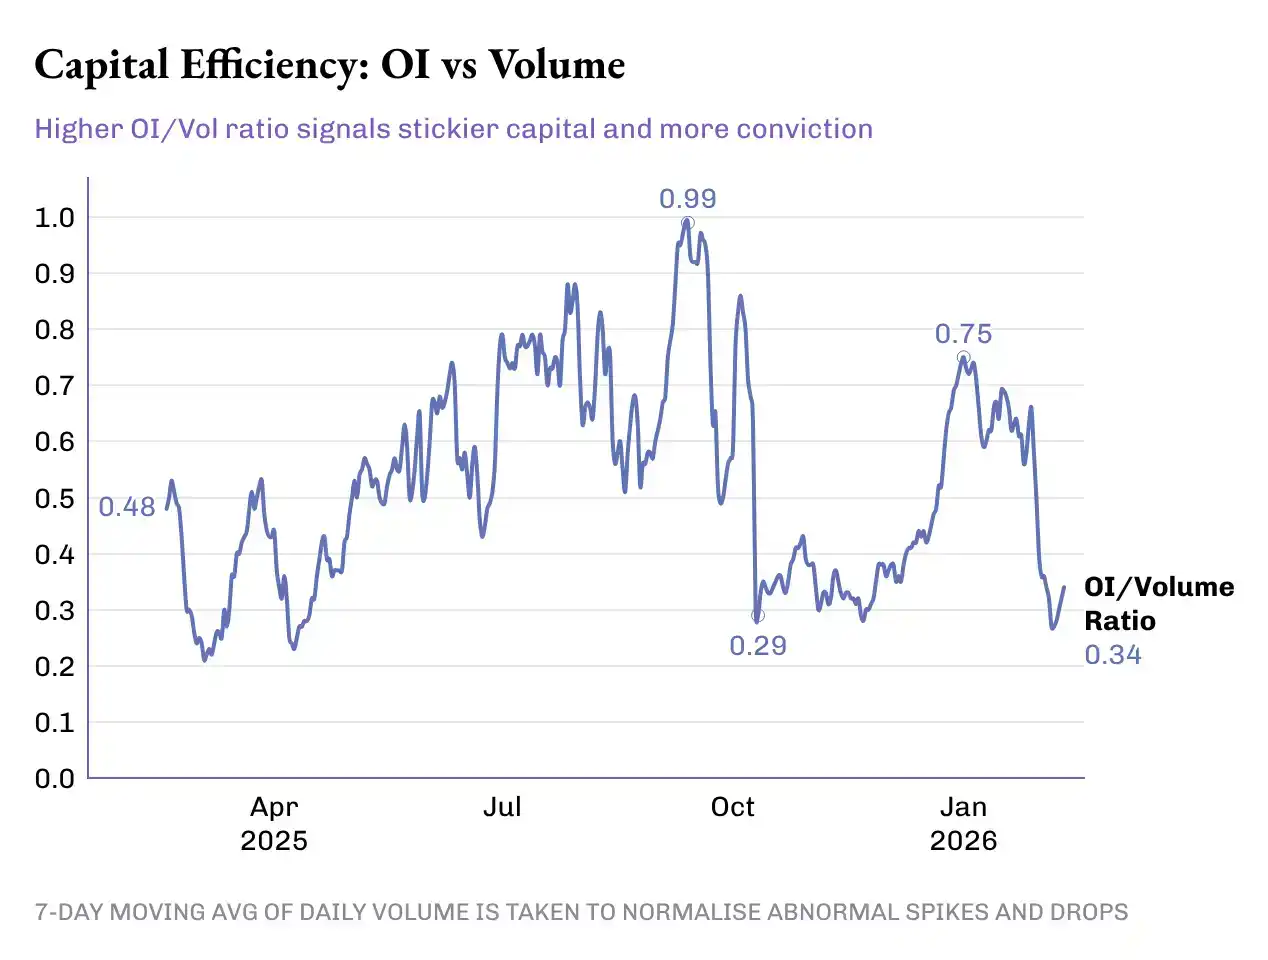
The OI/Volume ratio jumped 50% from last year's 0.33x to 0.49x today. But this progress wasn't smooth; the 50-basis-point increase in the ratio went through multiple peaks and troughs:

· Phase 1 (Feb - May 2025): The Dormant Period. The OI/Volume ratio averaged ~0.46x, with average OI of ~$4.8 billion and average daily volume of ~$11.5 billion.

· Phase 2 (June - Mid-Oct): The Leap. The ratio averaged ~0.72x. During this period, average OI rose to $14.8 billion, and average daily volume was $23 billion. This marked not only record-high volumes but also increased risk exposure and greater capital commitment to these derivatives.

· Phase 3: Market Reversal. This phase began with the massive liquidation on October 10th, which wiped out over $19 billion in leveraged positions within 24 hours. From mid-October to late December, the OI/Volume ratio fell to ~0.38x, driven primarily by volume growth while open interest largely stagnated. October, November, and December saw the three highest monthly volumes in 2025, averaging over $1.2 trillion per month. During the same period, OI averaged around $15 billion, slightly below the average of the previous three months.

Protocol Level

Here, I want to add more dimensions at the protocol level for perpetual markets. This helps us understand how efficiently perpetual exchanges convert trading activity into "sticky capital" and revenue.
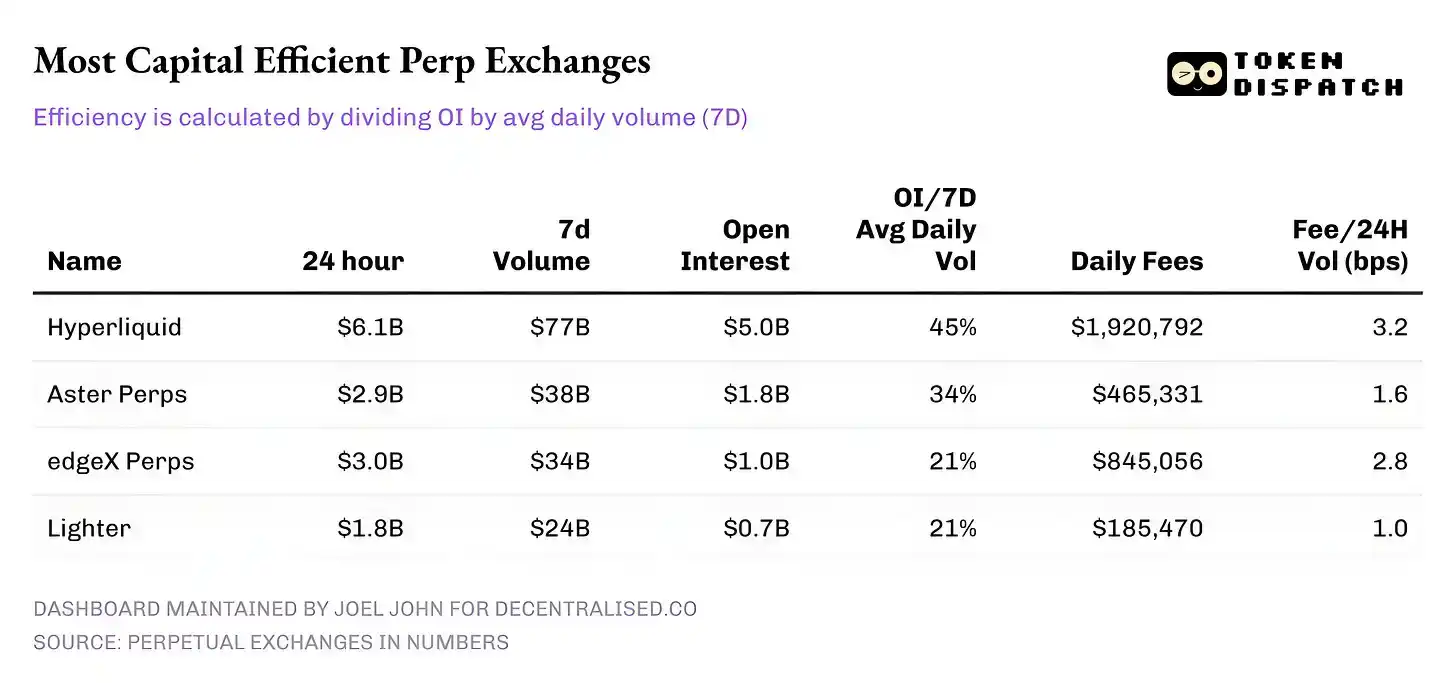
As of February 10th, here's how the top five perpetual exchanges by 24-hour volume performed:

· Hyperliquid: Its ratio of OI to 7-day average daily volume is over 45%, able to convert a large share of volume into lasting positions. This suggests that for every $10 traded on the platform, $4.50 is invested in active positions. This is important because a high OI ratio leads to tighter spreads, deeper liquidity, and confidence in scaling trades without slippage.

· Hyperliquid's fee revenue reinforces this story. Its take rate is about 3.2 basis points, converting the largest share of 24-hour volume into fee income.

· Aster: Currently ranked second, it maintains a decent capital efficiency (OI/Vol) of 34%, despite having almost half the volume of Hyperliquid. However, its monetization is noteworthy – with a lower take rate (~1.6 bps), Aster clearly prioritizes capital retention on its platform over fee maximization.
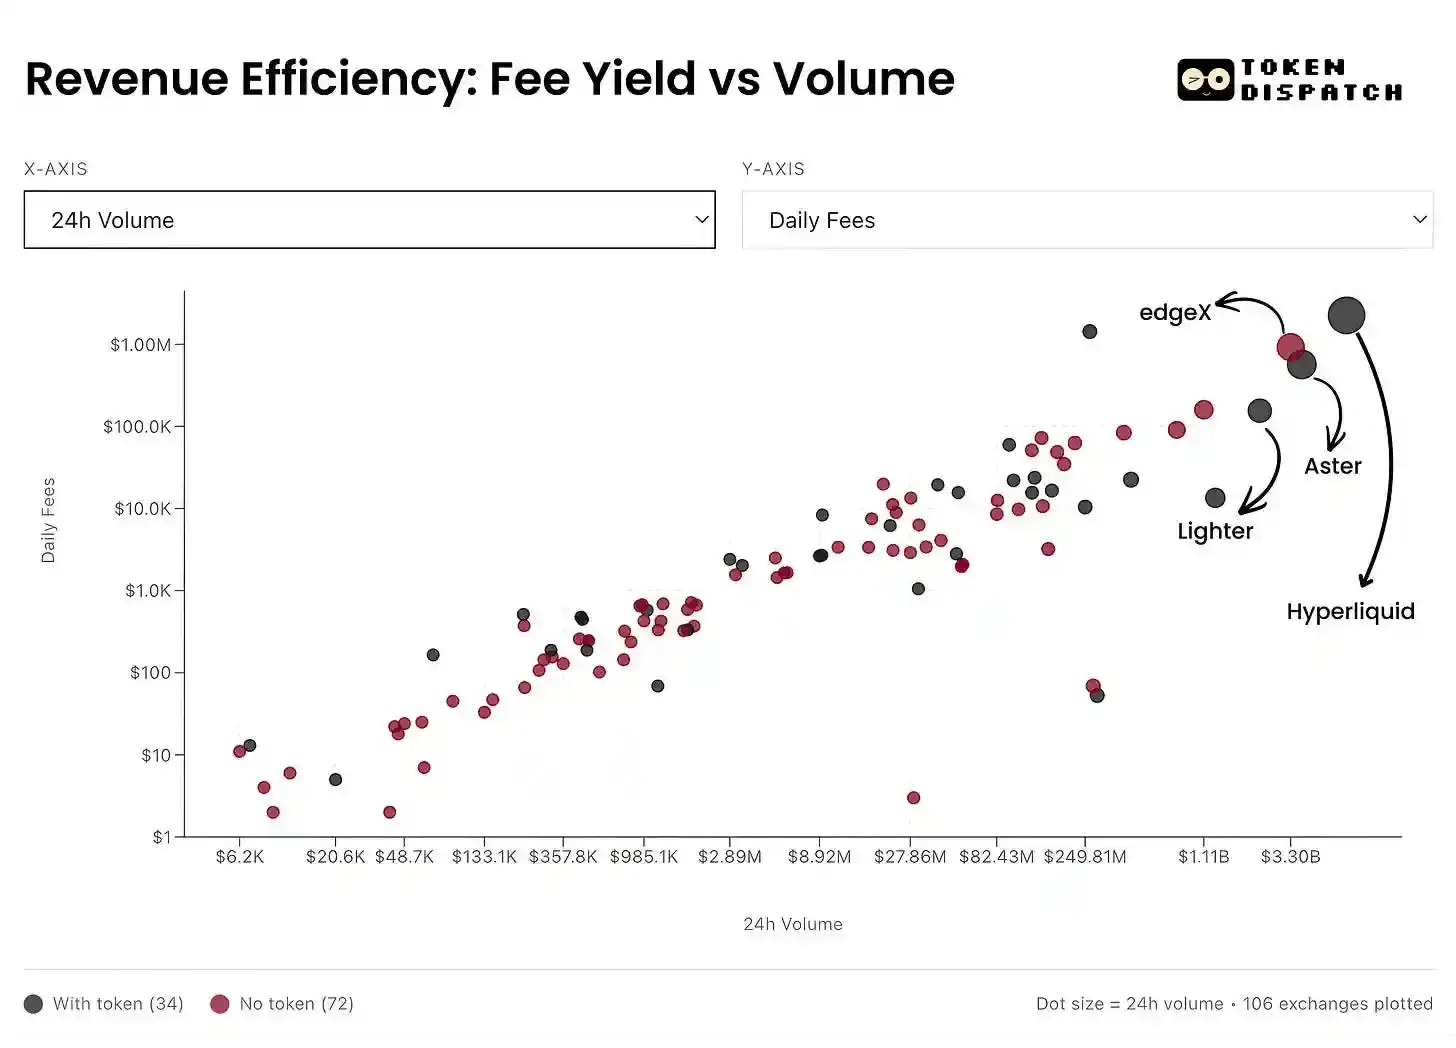
· edgeX and Lighter: Both perform similarly on the capital efficiency ladder, with an OI/Vol of 21% each. However, edgeX's fee monetization is comparable to Hyperliquid's, at 2.8 bps.

Summary

It's remarkable that today's perpetual contract market is no longer a simple growth story; it requires a nuanced reading of multiple metrics. At the macro level, volume is exploding: the growth in cumulative trading volume over six months exceeded the total of the previous four years. But the picture only becomes clear when OI and volume are read together.

A clearer victory lies in the growth of the OI/Volume ratio. This is a direct signal that "patient capital" is willing to trust and bet on the various products and markets emerging in perpetual exchanges.

What's more worth watching in the future is how individual players will evolve from here and what they choose to optimize. Over time, platforms that can optimize "trading conviction" and achieve sustainable monetization will be far more important than those that merely rely on rewards and incentives to dominate volume leaderboards.


Perguntas relacionadas

QWhat are Perpetual Futures (Perps) and how do they differ from traditional futures contracts?

APerpetual Futures (Perps) are a type of financial derivative contract that allows market participants to speculate on the price of an asset without an expiration date. They differ from traditional futures by providing instant access, leverage, and the absence of broker onboarding processes, jurisdictional paperwork, or adherence to traditional market hours.

QAccording to the article, what key metric should be analyzed alongside trading volume to understand the true health of a perpetual market?

AThe key metric that should be analyzed alongside trading volume is Open Interest (OI). While volume reflects the flow of capital, OI measures the amount of outstanding risk exposure, indicating the total dollar value of active, unsettled long and short contracts held by traders.

QWhat does the OI/Trading Volume ratio measure, and why is its increase considered a positive signal?

AThe OI/Trading Volume ratio measures capital efficiency. An increase in this ratio is a positive signal because it indicates that a larger share of the volume is being converted into lasting, 'patient capital' and open positions, which suggests greater trader confidence, deeper liquidity, and narrower spreads.

QWhich perpetual trading protocol was highlighted for having the highest capital efficiency (OI/Volume ratio) and a strong take rate?

AHyperliquid was highlighted for having the highest capital efficiency, with an OI/7-day average daily volume ratio of over 45%, and a strong take rate of approximately 3.2 basis points, converting the largest share of its volume into fee revenue.

QWhat major market event in October is cited as the start of a phase where the OI/Volume ratio declined significantly?

AThe phase where the OI/Volume ratio declined significantly began with a massive liquidation event on October 10th, which wiped out over $19 billion in leveraged positions within 24 hours.

Leituras Relacionadas

Annual Salary of Millions Competing for Electricians, Meta Rushes to Open Its Own Technical School

The AI boom is facing an unexpected bottleneck: a severe shortage of skilled construction workers and electricians. As tech giants like Meta, OpenAI, and Alphabet race to build massive data centers—such as OpenAI's $16 billion "Stargate" project—they are hitting a critical labor wall. The U.S. needs an estimated 130,000 more electricians, 240,000 construction workers, and 150,000 supervisors by 2030 for AI infrastructure alone, but tens of thousands of electrician jobs go unfilled each year. While AI companies offer high premiums, with electricians earning up to $280,000 annually, worker scarcity still causes massive losses—delays on a single project can cost $14.2 million per month. The complexity of building AI data centers, which require immense power (equivalent to powering hundreds of thousands of homes), sophisticated electrical systems, and advanced liquid cooling solutions, demands highly skilled technicians who are in short supply. To combat this, companies are investing heavily in training. Meta has committed $115 million to a free training school offering tuition, housing, and stipends, targeting 5,000 new workers. OpenAI is partnering with unions to secure skilled labor. These efforts are paying off, with a significant rise in Gen Z interest in trade schools over college. However, the power demands are staggering. AI data centers are driving a rapid surge in electricity consumption, projected to account for up to 12% of U.S. power use by 2028 and raising costs for consumers. Furthermore, the construction boom is project-based, leading to a potential future glut of trained workers once building peaks, which could depress wages industry-wide. The race for AI supremacy now depends as much on skilled hands as on advanced chips.

marsbitHá 22m

Annual Salary of Millions Competing for Electricians, Meta Rushes to Open Its Own Technical School

marsbitHá 22m

OpenAI No Longer Sells Its Most Expensive Model for Profit

OpenAI is shifting its business strategy away from promoting its most expensive, flagship models for every task. Recent price cuts—80% for GPT-5.6 Luna and 20% for Terra—signal a deeper change: the company now actively advises users that many tasks don't require the most powerful model. Instead, OpenAI recommends a tiered approach: use the high-end GPT-5.6 Sol for complex planning and analysis, then delegate execution to cheaper models like Luna. This mirrors moves by Anthropic, which recently launched Claude Opus 5 at half the price of its top model, Fable 5. Both companies are de-emphasizing flagship models as primary revenue drivers, using them instead for brand prestige and technological showcases. The industry is entering a "mass-market" phase, similar to automotive, where high-volume, cost-effective models handle daily operations and drive scale. OpenAI's price reductions are partly enabled by AI models themselves optimizing underlying code and infrastructure, creating a self-reinforcing cycle of efficiency gains and cost reduction. Competition is shifting from "who is smartest" to "who offers the best value." The goal is no longer selling individual models but fostering widespread API adoption and ecosystem lock-in. By making AI calls cheap and ubiquitous, companies like OpenAI aim to become the indispensable, utility-like infrastructure powering automated workflows—the "water and electricity" of software, quietly embedded everywhere.

marsbitHá 22m

OpenAI No Longer Sells Its Most Expensive Model for Profit

marsbitHá 22m

Will the Fed Definitely Raise Interest Rates in September? How Will Crypto and U.S. Stocks Withstand the Pressure?

The market's expectation for a September Fed rate hike surged dramatically in early August, jumping from under 50% to over 80% within a week. This shift followed a contentious July FOMC meeting, where a 9-3 vote to hold rates revealed growing dissent from hawkish members advocating for an immediate hike to combat persistent inflation. The primary catalyst for this repricing is rising oil prices, driven by renewed geopolitical tensions around the Strait of Hormuz, which threaten global supply. Energy costs directly influence inflation metrics, making the upcoming July CPI report (due August 12th) a critical data point. If it shows inflation reaccelerating, the probability of a September hike will solidify. For Bitcoin and crypto assets, this is typically bearish news. Bitcoin continues to behave as a high-beta, liquidity-sensitive risk asset. A rate hike raises the opportunity cost of holding non-yielding assets and could drive capital toward money markets, pressuring crypto prices in the short term. However, historical patterns suggest that if a hike is perceived as the end of a tightening cycle rather than the start, any negative price impact may be brief. U.S. stocks, particularly crypto-linked equities like Coinbase and growth-oriented tech stocks, are also vulnerable. Higher rates increase discount rates in valuation models, putting pressure on high-multiple companies. This coincides with a pivotal tech earnings season where investor focus has shifted from massive AI capital expenditure to tangible revenue and cash flow generation. Companies with negative cash flow and weak growth narratives could face heightened volatility if borrowing costs rise in September. In summary, a September Fed hike has evolved into a mainstream market scenario. Key factors to watch are oil prices, the July CPI report, and Fed communications, which will determine the final decision and its impact on volatile crypto and equity markets.

marsbitHá 32m

Will the Fed Definitely Raise Interest Rates in September? How Will Crypto and U.S. Stocks Withstand the Pressure?

marsbitHá 32m

Trading

Spot
活动图片