Don't Just Focus on Trading Volume: How to Understand the 'True vs. False Prosperity' of Perpetual Contracts

marsbitPublicado em 2026-02-20Última atualização em 2026-02-20

Resumo

While financial markets evolve, the explosive growth of perpetual futures (Perps) markets stands out. Perps allow leveraged, 24/7 speculation on assets without expiration dates, leading to a surge in trading volume. However, volume alone can be misleading, as it may reflect high-frequency, recursive activity rather than meaningful capital inflow. A more nuanced view emerges when combining volume with Open Interest (OI), which measures the total value of active, unsettled positions. While cumulative perpetual volume doubled to $14 trillion in the past six months (exceeding the previous four years' total), OI growth tells a deeper story. The OI-to-volume ratio, a measure of capital efficiency, has increased from 0.33x to 0.49x over the past year, indicating that more "patient capital" is being deployed and held as open risk. Analysis of top protocols reveals differences in efficiency. Hyperliquid leads with an OI/volume ratio over 45% and a high fee capture rate, demonstrating its ability to convert trading activity into sticky capital and revenue. In contrast, others prioritize different strategies, such as capital retention over fee maximization. Ultimately, the true measure of a perpetual market's strength lies not in volume alone but in its ability to foster trading conviction and sustainable monetization.

Just when you think finance is becoming dull and tedious, it always manages to surprise. Recently, it seems everyone is reshaping the financial system in ways few foresaw, including those from the entertainment and media industries.

Take Jimmy Donaldson (known as "MrBeast" on YouTube) as an example. He not only has a snack empire but recently also acquired a banking app aimed at promoting financial literacy and money management among teenagers and young adults. Why? Perhaps nothing is more straightforward than monetizing a subscriber base of 466 million users with financial products.

This summer, the world's largest derivatives exchange, CME Group, will launch single-stock futures, allowing users to trade futures on over 50 top U.S. stocks, including Alphabet, NVIDIA, Tesla, and Meta.

These restructurings show us how people's ways of engaging with finance are changing. And nothing illustrates this better than the explosion of the Perpetual Markets over the past few years.

Perpetual futures (or Perps) are a type of financial derivative contract that allows market participants to speculate on asset prices without an expiration date. Perps also enable people to express views on assets quickly and cheaply. They are more captivating than traditional markets because they offer instant access and leverage. Unlike traditional markets, they don't require broker onboarding processes, jurisdictional paperwork, or adherence to "traditional" market hours.

Furthermore, on-chain perpetual markets allow any asset (whether traditional or crypto) to be traded in a permissionless, highly leveraged manner. This makes speculation fun, especially when humans can't resist gambling on the trajectory of volatile assets outside traditional trading hours. This enables risk to be priced in real-time.

Consider what happened two weeks ago. When traditional and crypto markets crashed simultaneously, traders flocked to Hyperliquid, driving perpetual gold and silver trading into a frenzy. On January 31st, Hyperliquid alone accounted for 2% of the global daily trading volume in its silver (Silver) perpetual contract market, which had been live for less than a month.

This explains why dashboards of perpetual contract trading volume are increasingly dominating crypto communities and forums. Trading volume is an absolute value. It looks large, refreshes every few minutes, and is perfect for leaderboards. But it misses a key nuance: volume may reflect movement that lacks meaning. A market with high volume might have depth, but it could also be due to rewards and incentives encouraging higher-frequency activity. This activity is often recursive and not very meaningful.

This week, I delved into other metrics of the perpetual trading market. When used in conjunction with trading volume, these metrics add more dimensions and tell a completely different story from volume alone.

Let's begin.

A Few Data Points

The user-friendly interface of perpetual markets makes them a low-barrier, default platform for expressing views across various markets and global assets. The wide selection of highly leveraged derivative trading on both traditional and crypto assets on a single platform has led to perpetual contract volume surpassing spot trading volume on decentralized exchanges. From 44% in February 2025, the share of perpetual contract volume has soared to about 75% today (relative to spot volume).

This growth has been particularly significant in the past few months:

· The cumulative total perpetual trading volume across all platforms over the four years ending July 31, 2025, was $6.91 trillion.

· In just the past six months, this volume has doubled, reaching $14 trillion.
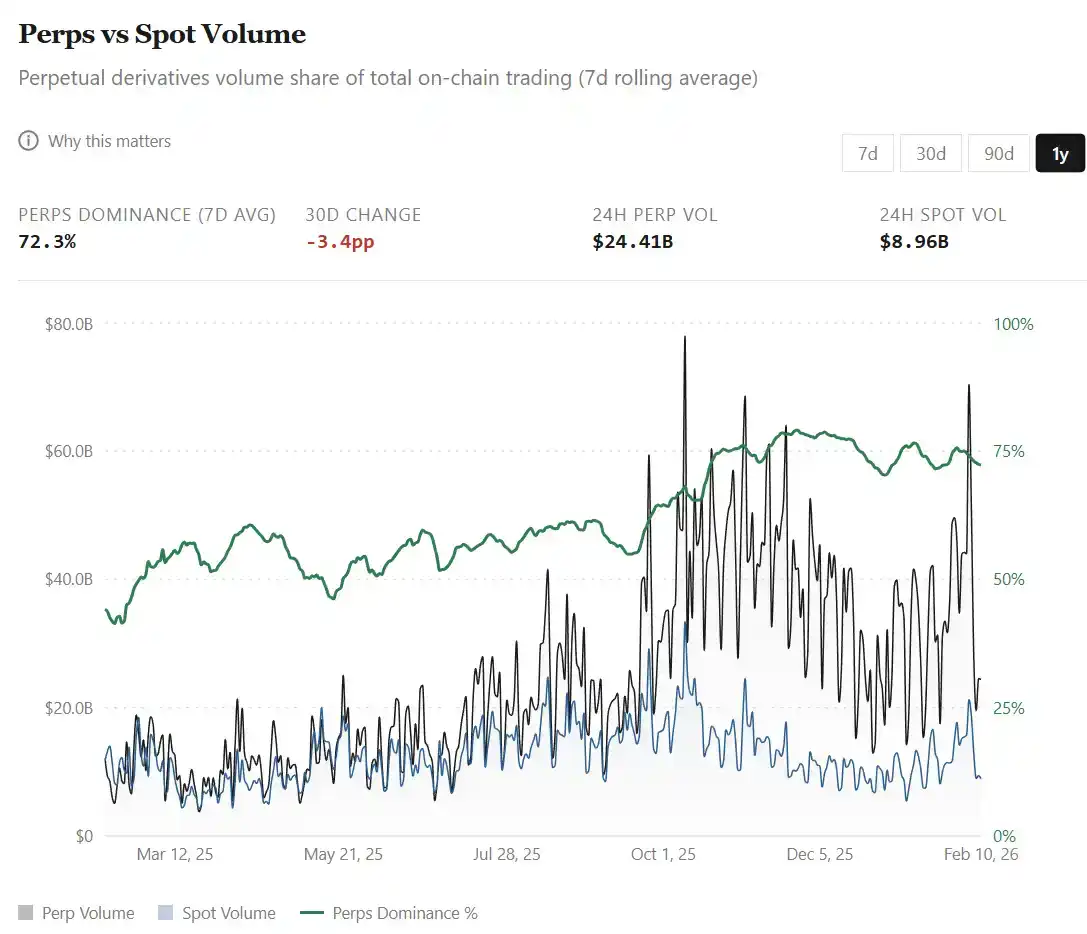
All this growth occurred against the backdrop of the total crypto market capitalization shrinking by nearly 40% between August 1, 2025, and February 9, 2026. This activity indicates that traders are increasingly leaning towards derivative trading, hedging, and short-term positioning, especially when spot markets become highly volatile and bearish.
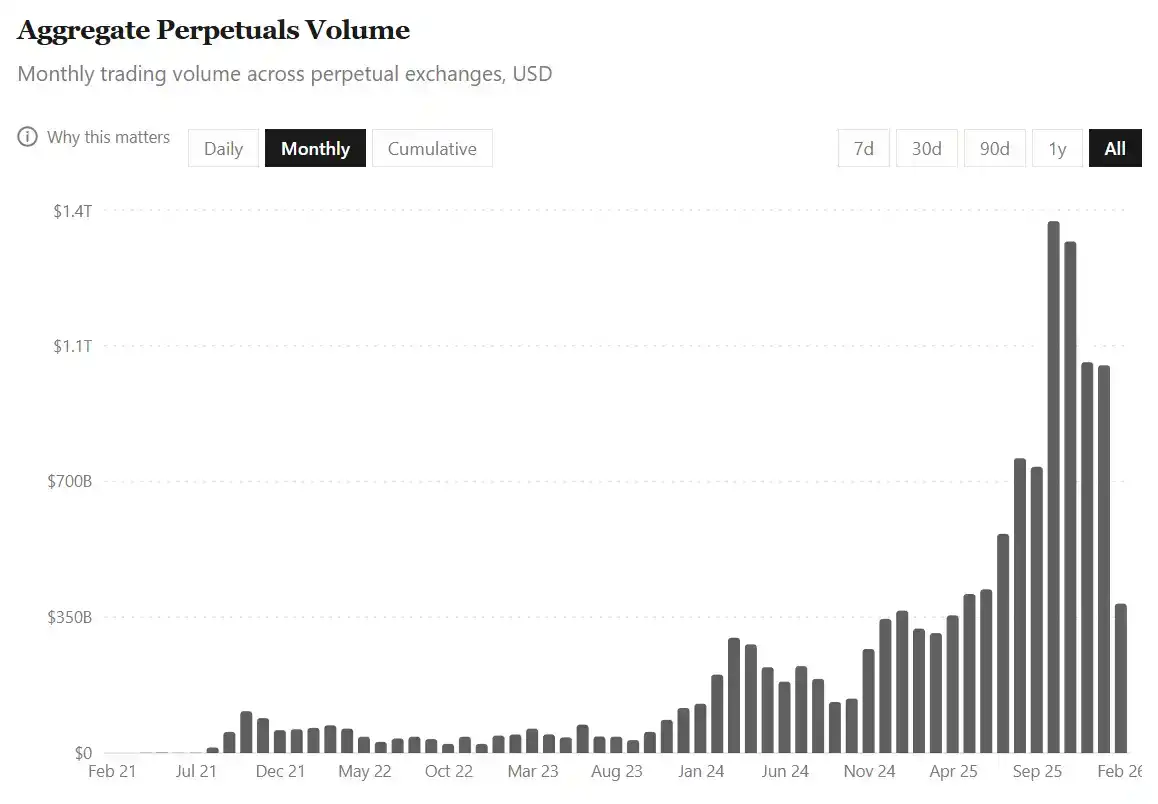
But there's a catch. With such massive activity, it's easy to misread volume metrics. Especially because perpetual trading isn't just about buying assets and holding them long-term; it also involves repeatedly adjusting bet sizes using leverage within shorter time frames.

Therefore, when market turnover accelerates rapidly, a question inevitably arises: Do record-breaking volumes reflect more capital inflows, or the same capital cycling faster?

This is where observing Open Interest (OI) becomes meaningful. If volume reflects capital flow, then OI measures outstanding risk exposure. On perpetual exchanges, OI refers to the total dollar value of active, unsettled long and short contracts held by traders.
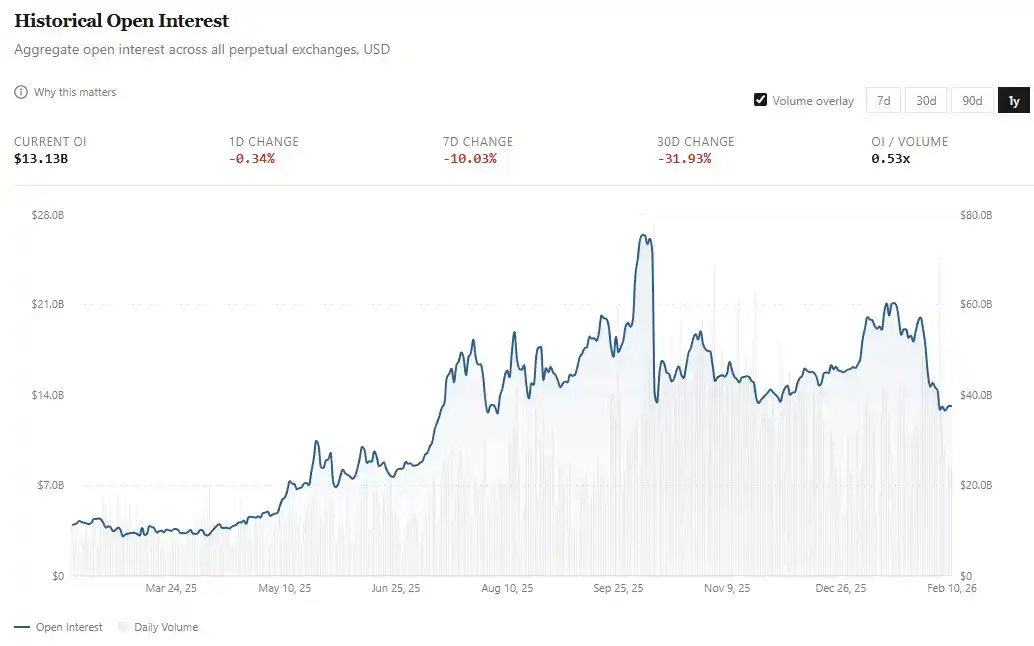
If perpetual trading is being adopted by the mass market, we would hope to see not only larger capital flows but also proportionally growing open interest.

· Last February, OI averaged around $4 billion;

· Now, that number has more than tripled to approximately $13 billion. In fact, the average for the entire January reached about $18 billion before dropping by about 30% in the first week of February.

While perpetual trading volume doubled over the past five months, OI grew by about 50% (from $13 billion to ~$18 billion, then back to $13 billion). To better understand this, I looked at the capital efficiency (i.e., OI as a percentage of daily volume) over the past year.
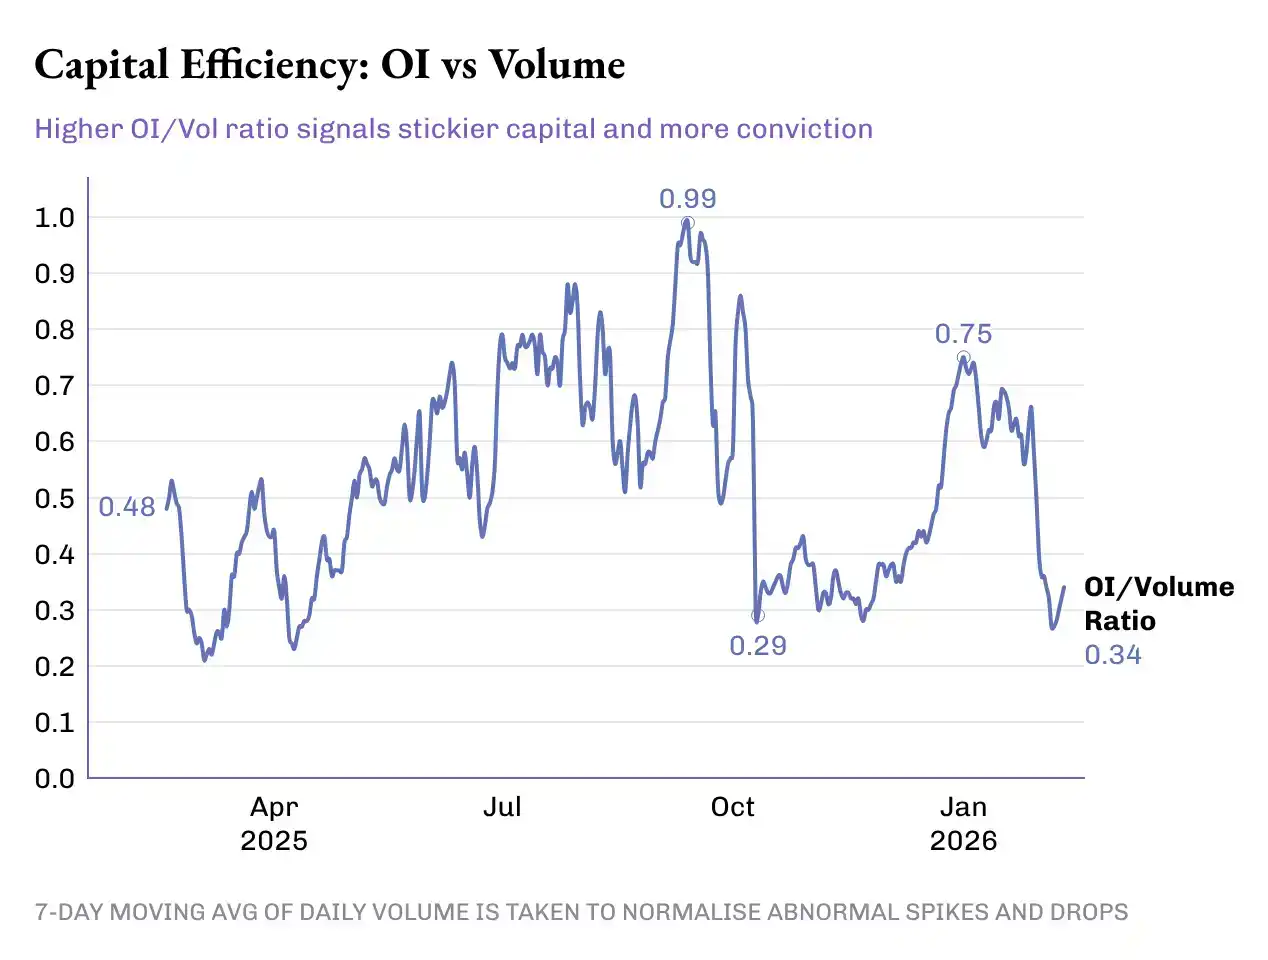
The OI/Volume ratio jumped 50% from last year's 0.33x to 0.49x today. But this progress wasn't smooth; the 50-basis-point increase in the ratio went through multiple peaks and troughs:

· Phase 1 (Feb - May 2025): The Dormant Period. The OI/Volume ratio averaged ~0.46x, with average OI of ~$4.8 billion and average daily volume of ~$11.5 billion.

· Phase 2 (June - Mid-Oct): The Leap. The ratio averaged ~0.72x. During this period, average OI rose to $14.8 billion, and average daily volume was $23 billion. This marked not only record-high volumes but also increased risk exposure and greater capital commitment to these derivatives.

· Phase 3: Market Reversal. This phase began with the massive liquidation on October 10th, which wiped out over $19 billion in leveraged positions within 24 hours. From mid-October to late December, the OI/Volume ratio fell to ~0.38x, driven primarily by volume growth while open interest largely stagnated. October, November, and December saw the three highest monthly volumes in 2025, averaging over $1.2 trillion per month. During the same period, OI averaged around $15 billion, slightly below the average of the previous three months.

Protocol Level

Here, I want to add more dimensions at the protocol level for perpetual markets. This helps us understand how efficiently perpetual exchanges convert trading activity into "sticky capital" and revenue.
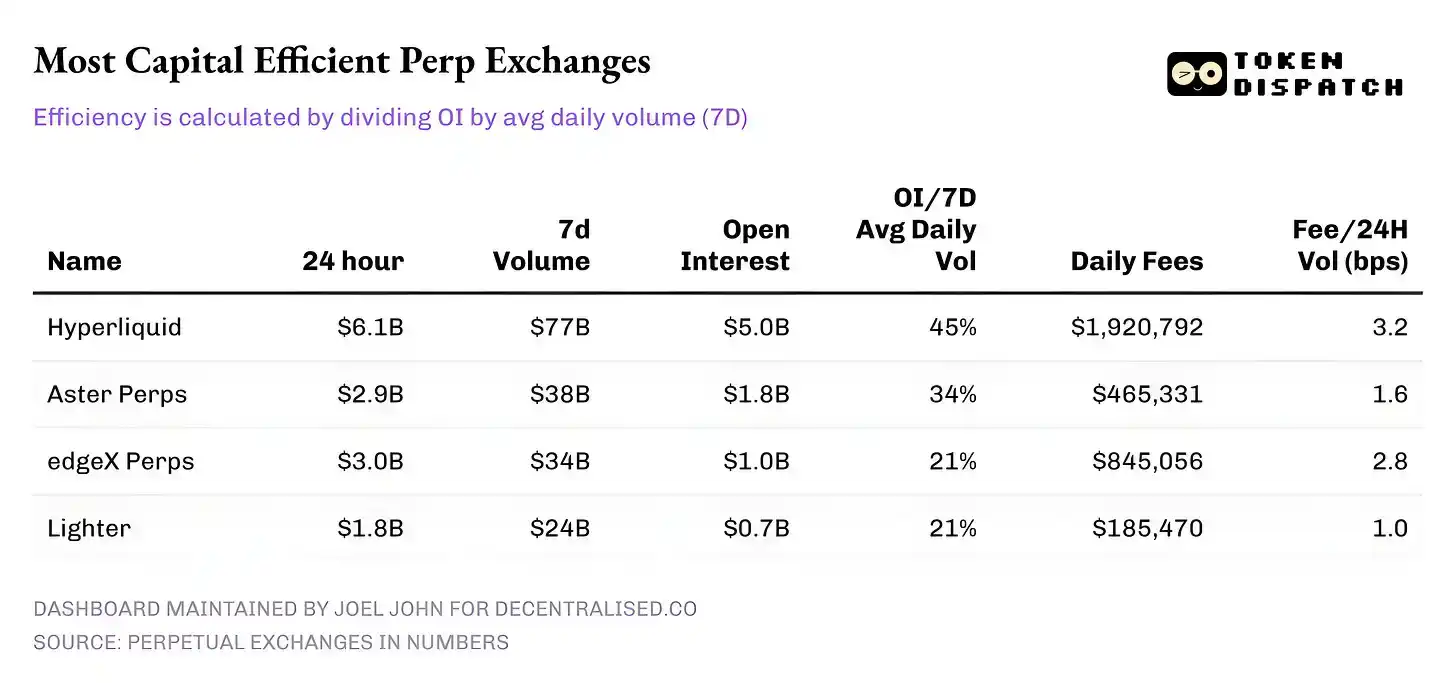
As of February 10th, here's how the top five perpetual exchanges by 24-hour volume performed:

· Hyperliquid: Its ratio of OI to 7-day average daily volume is over 45%, able to convert a large share of volume into lasting positions. This suggests that for every $10 traded on the platform, $4.50 is invested in active positions. This is important because a high OI ratio leads to tighter spreads, deeper liquidity, and confidence in scaling trades without slippage.

· Hyperliquid's fee revenue reinforces this story. Its take rate is about 3.2 basis points, converting the largest share of 24-hour volume into fee income.

· Aster: Currently ranked second, it maintains a decent capital efficiency (OI/Vol) of 34%, despite having almost half the volume of Hyperliquid. However, its monetization is noteworthy – with a lower take rate (~1.6 bps), Aster clearly prioritizes capital retention on its platform over fee maximization.
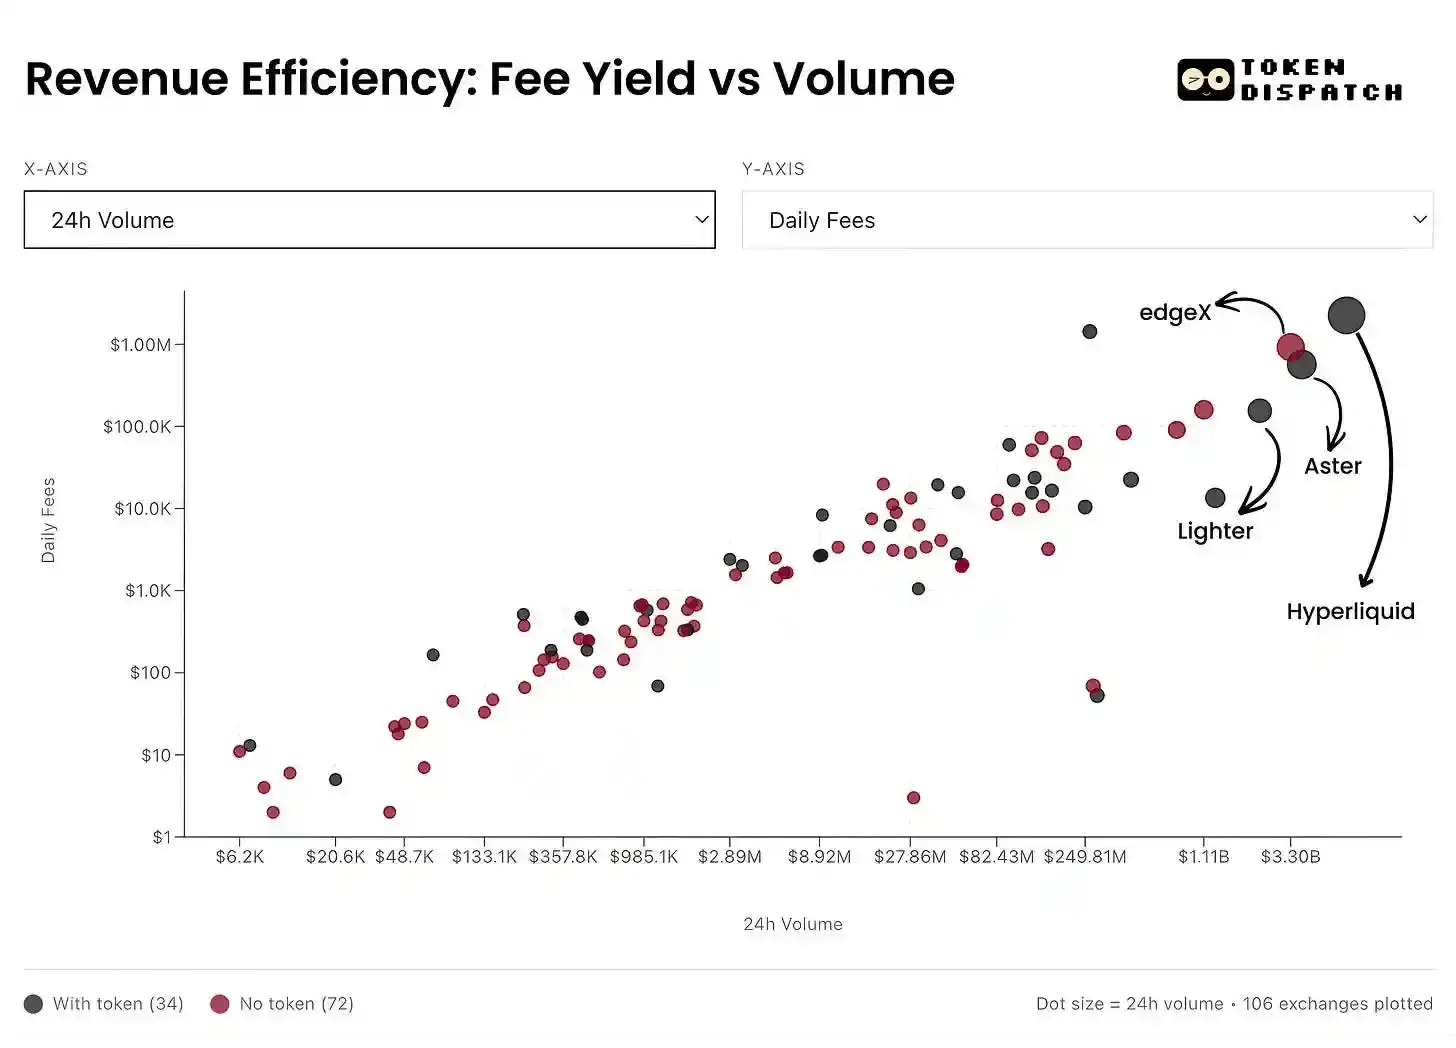
· edgeX and Lighter: Both perform similarly on the capital efficiency ladder, with an OI/Vol of 21% each. However, edgeX's fee monetization is comparable to Hyperliquid's, at 2.8 bps.

Summary

It's remarkable that today's perpetual contract market is no longer a simple growth story; it requires a nuanced reading of multiple metrics. At the macro level, volume is exploding: the growth in cumulative trading volume over six months exceeded the total of the previous four years. But the picture only becomes clear when OI and volume are read together.

A clearer victory lies in the growth of the OI/Volume ratio. This is a direct signal that "patient capital" is willing to trust and bet on the various products and markets emerging in perpetual exchanges.

What's more worth watching in the future is how individual players will evolve from here and what they choose to optimize. Over time, platforms that can optimize "trading conviction" and achieve sustainable monetization will be far more important than those that merely rely on rewards and incentives to dominate volume leaderboards.


Perguntas relacionadas

QWhat are Perpetual Futures (Perps) and how do they differ from traditional futures contracts?

APerpetual Futures (Perps) are a type of financial derivative contract that allows market participants to speculate on the price of an asset without an expiration date. They differ from traditional futures by providing instant access, leverage, and the absence of broker onboarding processes, jurisdictional paperwork, or adherence to traditional market hours.

QAccording to the article, what key metric should be analyzed alongside trading volume to understand the true health of a perpetual market?

AThe key metric that should be analyzed alongside trading volume is Open Interest (OI). While volume reflects the flow of capital, OI measures the amount of outstanding risk exposure, indicating the total dollar value of active, unsettled long and short contracts held by traders.

QWhat does the OI/Trading Volume ratio measure, and why is its increase considered a positive signal?

AThe OI/Trading Volume ratio measures capital efficiency. An increase in this ratio is a positive signal because it indicates that a larger share of the volume is being converted into lasting, 'patient capital' and open positions, which suggests greater trader confidence, deeper liquidity, and narrower spreads.

QWhich perpetual trading protocol was highlighted for having the highest capital efficiency (OI/Volume ratio) and a strong take rate?

AHyperliquid was highlighted for having the highest capital efficiency, with an OI/7-day average daily volume ratio of over 45%, and a strong take rate of approximately 3.2 basis points, converting the largest share of its volume into fee revenue.

QWhat major market event in October is cited as the start of a phase where the OI/Volume ratio declined significantly?

AThe phase where the OI/Volume ratio declined significantly began with a massive liquidation event on October 10th, which wiped out over $19 billion in leveraged positions within 24 hours.

Leituras Relacionadas

Strategy's Loss in the Second Quarter Reaches $8.22 Billion Amid Bitcoin Decline

Strategy, the largest corporate holder of Bitcoin, reported a net loss of $8.22 billion for the second quarter. This loss was primarily driven by an $8.32 billion unrealized loss on its Bitcoin holdings due to a decline in the asset's price during the period. Despite these paper losses, the company increased its Bitcoin holdings to 843,775 BTC, a 25% growth since the start of the year. As part of a new monetization strategy, Strategy sold approximately $218.4 million worth of Bitcoin, mainly to fund dividends for preferred shareholders, with $216 million of that sold after Q2 ended. The company also built a $3.75 billion cash reserve, which it claims is sufficient to cover over two years of dividend and interest payments, aiming to insulate itself from Bitcoin's volatility while meeting obligations. Following the earnings release, Strategy's stock (MSTR) rose 4.7% in regular trading but corrected slightly after-hours. This pattern reflects how the company's accounting results are heavily tied to Bitcoin's price swings, even as its long-term strategy remains unchanged. The report indicates that Strategy is maintaining its core strategy of accumulating Bitcoin while building a financial buffer. This quarterly loss follows a recognizable pattern, with the company posting significant unrealized losses in previous quarters (e.g., $12.4 billion in Q4 2025 and ~$12.5 billion in Q1 2026) due to fair-value accounting. A key technical shift is its new monetization program, which introduces periodic selling pressure on the market, transitioning Strategy from a pure accumulator to a participant that occasionally adds supply. A critical question remains: how long can the cash reserve cover dividend obligations if a Bitcoin price downturn persists beyond two years?

cryptonews.ruHá 21m

Strategy's Loss in the Second Quarter Reaches $8.22 Billion Amid Bitcoin Decline

cryptonews.ruHá 21m

Will Terrorist Durov Ban Russian Officials?

Telegram founder Pavel Durov publicly reacted to being labeled a "terrorist" by Russian authorities, stating the designation came after he refused demands for mass surveillance and censorship on the platform. In a Telegram post, he highlighted that this status formally bans him from "publishing information online." Durov concluded with a statement widely circulated: Russian officials "clearly don't understand who can ban whom on the internet." This remark suggests Durov could potentially restrict official Russian government and officials' channels on Telegram, which continue to operate on the platform despite its formal blocking in Russia. The situation parallels previous, slow-moving state directives, like switching officials to domestic cars, contrasted with the current push to migrate all government communication to the Russian-made messenger MAX by 2030. However, reports indicate many officials still use Telegram via workarounds, fearing surveillance on MAX, while alternatives like BiP and KakaoTalk recently became inaccessible in Russia without a VPN. Durov has not specified any immediate actions against state channels. His statement is an initial response, with further developments depending on the authorities' reaction. The dynamic differs from 2020 when Russian regulators lifted a block on Telegram; now, Durov implies control from within the platform itself over the official accounts that persisted through that earlier blockade.

cryptonews.ruHá 21m

Will Terrorist Durov Ban Russian Officials?

cryptonews.ruHá 21m

DeepSeek V4 Official Version Arrives, New Capabilities Emerge, Value-for-Money King Enters the Fray

On July 31st, DeepSeek officially launched the public API beta for its DeepSeek-V4-Flash model. A key highlight is its performance on multiple Agent benchmark tests, reportedly nearing or even surpassing the level of the V4-Pro preview version from three months ago. Notably, the Flash model achieves this with significantly smaller scale (130B active parameters vs. Pro's 490B), suggesting that post-training optimization and data quality may be as crucial as raw model size. DeepSeek emphasized that the V4-Flash-0731 uses the same model architecture and size as its preview version, with improvements attributed solely to "re-trained post-training." The update also marks the official debut of DeepSeek's self-developed Agent framework, "Harness." The move signals DeepSeek's strategic push to position its cost-effective Flash model as a competitive base for Agent applications—scenarios requiring autonomous planning, tool usage, and complex task execution—where inference speed and cost are critical. By natively supporting OpenAI's Responses API format and adapting for code-generation scenarios, DeepSeek aims not just to be a cheaper alternative but to establish its own ecosystem in the Agent era. This release follows DeepSeek's record-breaking ~$50 billion fundraising round roughly two months prior, underscoring market confidence in its technology and commercialization prospects. The company is reportedly preparing for another funding round at a valuation of approximately $71 billion. The Flash model's advancement represents a step in fulfilling the high expectations that come with this valuation, setting the stage for the impending release of the V4-Pro official version and intensifying competition in the global Agent landscape.

marsbitHá 26m

DeepSeek V4 Official Version Arrives, New Capabilities Emerge, Value-for-Money King Enters the Fray

marsbitHá 26m

Trading

Spot
活动图片