Bitcoin Prints Biggest Monthly Win In A Year Amid Renewed Market Optimism

bitcoinistPublicado em 2026-05-03Última atualização em 2026-05-03

Fear still hangs over the crypto market even as Bitcoin closed April with its strongest monthly gain in 12 months. The Crypto Fear & Greed Index registered a reading of 39 on Friday — firmly in “Fear” territory — a sign that many investors remain cautious despite the month’s upbeat finish.

Two Green Candles After A Long Dry Spell

Bitcoin returned 12% in April, its best monthly performance since April 2025, when it gained 14%. The gain ended a streak of five straight red monthly candles.

“After 5 consecutive red monthly candles, Bitcoin has now closed 2 in the green, causing some relief in the market,” crypto trader Daan Crypto Trades wrote on X.

Still, the April result came in just below the coin’s historical average for the month, which sits at 13%, according to CoinGlass data.

Bitcoin started April near $66,000 and is currently trading around $78,400 — still about 35% below its all-time high of $125,100, reached last October.

Analysts Split On What Happens Next

With May now open, market watchers are divided on where Bitcoin goes from here. Crypto analytics firm CryptoQuant issued a warning that the April rally may have been built on shaky ground.
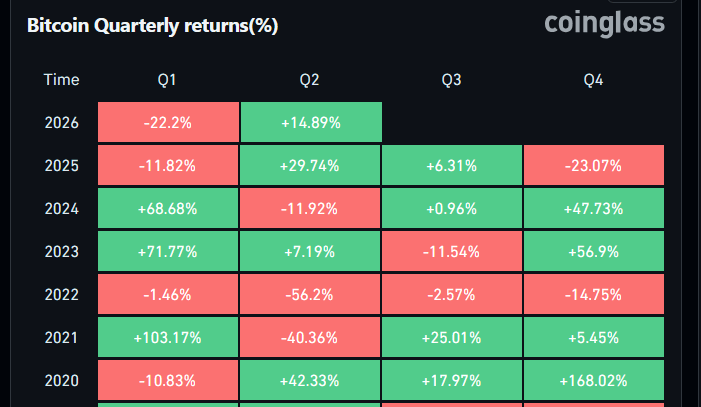
Source: Coinglass

According to the firm, the move was driven largely by futures traders rather than deeper structural demand, raising the possibility of a multi-month price decline ahead.

On the other side of the debate, MN Trading Capital founder Michael van de Poppe argued that Bitcoin doesn’t need a headline-grabbing catalyst to push back past $100,000.

“There doesn’t need to be a narrative that pushes the price upwards,” he wrote on X Friday. Bitcoin last traded above $100,000 on November 13 — about a month after a $19 billion crypto market liquidation event on October 10.

Crypto analyst Jelle offered a shorter-term take, writing simply: “We hit the ground running again next week.”

BTCUSD currently trading at $78,473. Chart: TradingView

History Points To A Solid May — But It’s No Guarantee

Based on CoinGlass data, Bitcoin has historically returned an average of 7.78% in May, making it one of the more favorable months on the calendar.

Some market participants are leaning on that track record to stay optimistic. Reports indicate that many traders believe Bitcoin’s historical patterns tend to repeat, though analysts have long cautioned that past performance in crypto markets carries no real predictive weight.

Featured image from MetaAI, chart from TradingView

Criptomoedas em alta

Leituras Relacionadas

STRC Hits Historic Low, Saylor's Perpetual Motion Machine Grinds to a Halt

STRC, the perpetual preferred stock issued by MicroStrategy to fund its Bitcoin purchases, hit a historic low of $85.32, a 17% discount to its $100 par value. Designed as a "digital credit engine" to trade stably near par and enable continuous share issuance for buying Bitcoin, its plunge signals a breakdown in this model. Three key factors drove the decline: 1. Bitcoin's price fell over 50% from its peak, trading around $63,000 amid hawkish Fed signals. 2. MicroStrategy's cash reserves were depleted after a $1.5 billion convertible note repayment, slashing the dividend coverage for STRC's 11.5% yield to ~7 months. The company then sold 32 BTC to cover dividends—Michael Saylor's first Bitcoin sale since 2022—damaging the "never sell" narrative. 3. A competing Bitcoin-backed preferred stock, Strive's SATA, offers a higher yield (~13%) and daily dividends, drawing investors away from STRC. The drop triggers a negative cycle: STRC below par halts ATM share issuances, cutting off a key funding source for Bitcoin buys and potentially forcing more BTC sales for dividends, further eroding confidence. While Saylor argues the model is mathematically sound—needing only 2.3% annual Bitcoin growth to sustain itself—the market is testing the resilience of the leveraged Bitcoin treasury strategy in a bear market. The STRC price now reflects rising skepticism about this financial machinery's durability during downturns.

marsbitHá 13m

STRC Hits Historic Low, Saylor's Perpetual Motion Machine Grinds to a Halt

marsbitHá 13m

A Guide to Grayscale’s ‘Bottom Fishing’: Using Cash Flow to Assess Cryptocurrency Value

**Title:** Grayscale's Guide to Bottom-Fishing: Valuing Cryptoassets Using Cash Flows **Summary:** This report by Grayscale Research presents a fundamental valuation framework for cryptocurrency assets, moving beyond pure speculation to analyze those with underlying cash flows. It distinguishes between "commodity-like" assets (e.g., Bitcoin) and "cash-flow" assets, primarily within DeFi. Using the leading decentralized lending protocol Aave as a case study, the analysis applies traditional financial methodologies like Discounted Cash Flow (DCF) and Price-to-Earnings (P/E) multiples. Key findings indicate that AAVE tokens are currently undervalued. Despite recent challenges, the protocol's strong revenue growth, ~50% net profit margin, and diversified treasury support a fundamental valuation range of $80-$100 per token (compared to a ~$75 market price at the time of writing). In a base-case scenario driven by stablecoin adoption and regulatory clarity, the fair value could rise to around $175 within a year. The report emphasizes that protocol success does not automatically translate to token value. It critically examines the "value capture" mechanisms—such as buybacks, burns, and staking rewards—that channel protocol profits to token holders. Furthermore, it addresses the legal and governance complexities of Decentralized Autonomous Organizations (DAOs), noting their difference from traditional corporate equity but highlighting how robust, transparent governance can align protocol economics with holder interests. The conclusion is that the crypto market is maturing, with capital increasingly flowing towards projects with demonstrable fundamentals, real adoption, and disciplined capital allocation, creating opportunities for value-based investors.

marsbitHá 1h

A Guide to Grayscale’s ‘Bottom Fishing’: Using Cash Flow to Assess Cryptocurrency Value

marsbitHá 1h

After semiconductors lead the gains, are funds buying into AI orders or a macroeconomic rebound?

After US-Iran talks led to a temporary ceasefire and framework for reopening the strategic Strait of Hormuz, U.S. stocks rose on June 18, with the Nasdaq gaining 1.9%. The semiconductor and AI hardware sectors outperformed. This rally stemmed primarily from reduced geopolitical risk, which lowered oil prices and inflation expectations, easing discount rate pressure on high-valuation growth stocks like tech. The key question is not whether tech rebounded, but the nature of the rebound. The market appears to be selectively repricing AI infrastructure plays rather than broadly chasing AI narratives. Gains were concentrated in chips, optical interconnects, memory, and domestic manufacturing—segments tied to tangible data center build-outs and capital expenditure. Intel's ~10% surge, fueled by a Trump statement about potential Apple collaboration, exemplifies this mixed dynamic. It reflects policy catalysts and domestic manufacturing sentiment more than confirmed fundamentals. Meanwhile, strong earnings from companies like Astera Labs (revenue up 93% YoY) provided concrete evidence of AI-driven demand in hardware. In essence, the rally represents a risk-premium recalibration. Lower Middle East tensions opened a valuation repair window, and capital flowed first into AI infrastructure segments with visible near-term revenue streams. The sustainability of this move hinges on upcoming Q2 earnings, specifically continued strength in cloud provider capex, AI server orders, and hardware company guidance. Policy hopes alone are insufficient; the cycle needs validation from orders and financials.

marsbitHá 1h

After semiconductors lead the gains, are funds buying into AI orders or a macroeconomic rebound?

marsbitHá 1h

Trading

Spot
Futuros

Artigos em Destaque

Como comprar WIN

Bem-vindo à HTX.com!Tornámos a compra de WINkLink (WIN) simples e conveniente.Segue o nosso guia passo a passo para iniciar a tua jornada no mundo das criptos.Passo 1: cria a tua conta HTXUtiliza o teu e-mail ou número de telefone para te inscreveres numa conta gratuita na HTX.Desfruta de um processo de inscrição sem complicações e desbloqueia todas as funcionalidades.Obter a minha contaPasso 2: vai para Comprar Cripto e escolhe o teu método de pagamentoCartão de crédito/débito: usa o teu visa ou mastercard para comprar WINkLink (WIN) instantaneamente.Saldo: usa os fundos da tua conta HTX para transacionar sem problemas.Terceiros: adicionamos métodos de pagamento populares, como Google Pay e Apple Pay, para aumentar a conveniência.P2P: transaciona diretamente com outros utilizadores na HTX.Mercado de balcão (OTC): oferecemos serviços personalizados e taxas de câmbio competitivas para os traders.Passo 3: armazena teu WINkLink (WIN)Depois de comprar o teu WINkLink (WIN), armazena-o na tua conta HTX.Alternativamente, podes enviá-lo para outro lugar através de transferência blockchain ou usá-lo para transacionar outras criptomoedas.Passo 4: transaciona WINkLink (WIN)Transaciona facilmente WINkLink (WIN) no mercado à vista da HTX.Acede simplesmente à tua conta, seleciona o teu par de trading, executa as tuas transações e monitoriza em tempo real.Oferecemos uma experiência de fácil utilização tanto para principiantes como para traders experientes.

372 Visualizações TotaisPublicado em {updateTime}Atualizado em 2025.03.21

Como comprar WIN

Discussões

Bem-vindo à Comunidade HTX. Aqui, pode manter-se informado sobre os mais recentes desenvolvimentos da plataforma e obter acesso a análises profissionais de mercado. As opiniões dos utilizadores sobre o preço de WIN (WIN) são apresentadas abaixo.

活动图片