AAOI Breaks Through Bull Flag! Amazon Lock-up + Profits Double, Still Worth Chasing?

Publicado em 2026-08-17Última atualização em 2026-08-17

Resumo

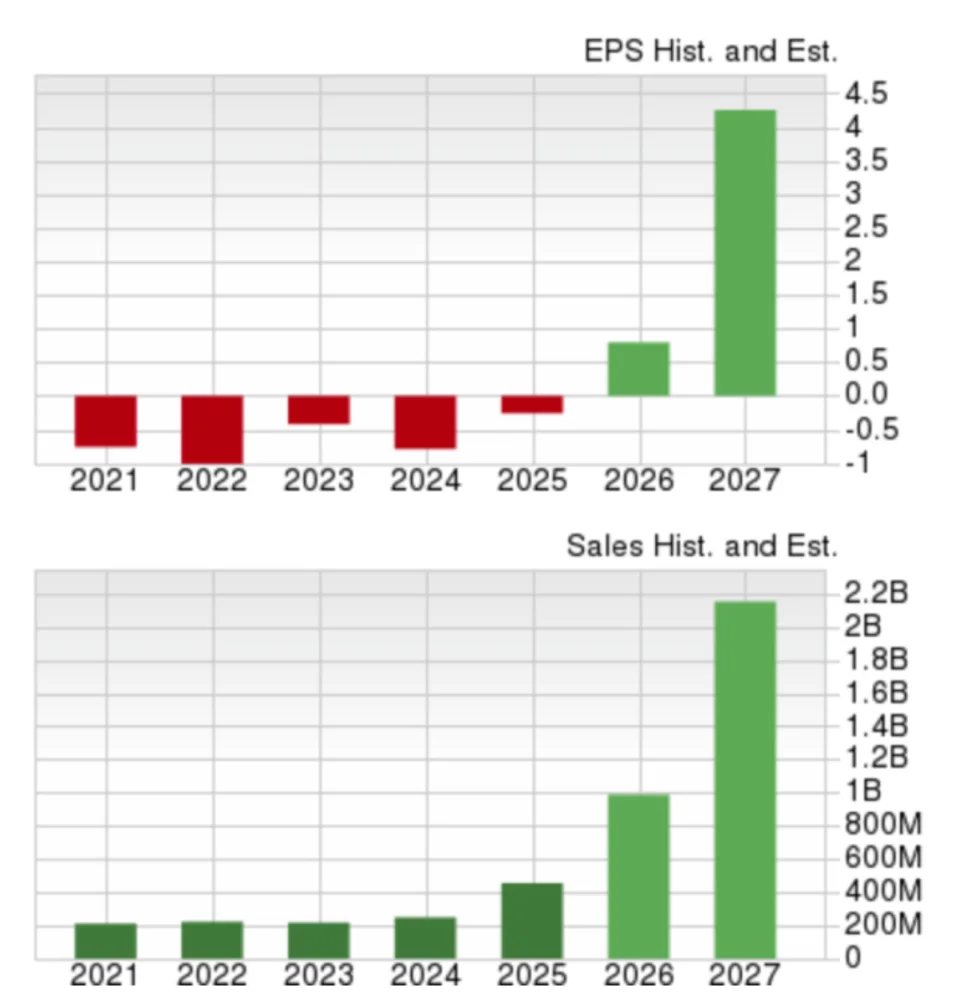
Analysts predict AAOI's EPS and revenue growth rates will reach triple digits in 2026 and 2027.

AAOI's hottest business area is the artificial intelligence data center market. In order to establish a foothold in the AI market, major tech companies are building some of the largest commercial data centers in history to train complex AI models. These massive data centers are equipped with thousands of Nvidia (NVDA) Graphics Processing Units (GPUs). Traditionally, GPUs were connected using copper cables. However, traditional copper interconnects have physical limitations in transmission distance, power consumption, and heat dissipation. Furthermore, copper prices have surged significantly over the past year, making optical fiber interconnects more attractive for these applications.

Therefore, AAOI's current revenue and profit growth rates are both in the high double digits. However, analysts in the Zacks consensus estimate predict that AAOI's EPS and revenue growth rates will reach triple digits in 2026 and 2027.
Amazon Deal Provides Revenue Visibility

Last year, Applied Optoelectronics, Inc. (AAOI) announced a major, multi-year agreement with Amazon (ticker: AMZN). Amazon will invest up to 8 million shares of AAOI stock in exchange for the supply of AAOI's advanced optical transceivers and data center networking products. This agreement provides AAOI with multi-year revenue security and validation from a leading hyperscale data center operator.

Rising Profit Margins

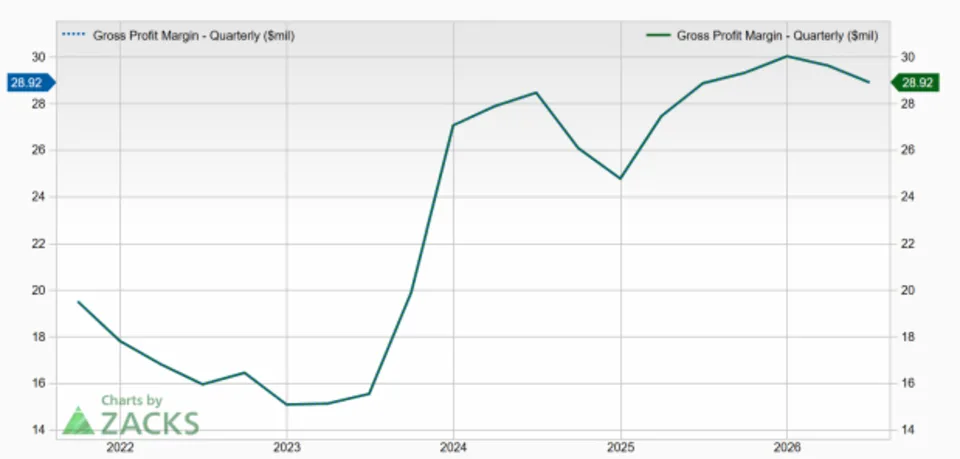
The company's profit margins have grown significantly, nearly doubling since 2023.
Geopolitical Insulation

As Western nations seek to reduce supply chain risks associated with Chinese optical suppliers, AAOI stands to benefit. The company's primary manufacturing base is located in Texas, making it one of the few domestic US optical manufacturers.

AAOI Technical Analysis

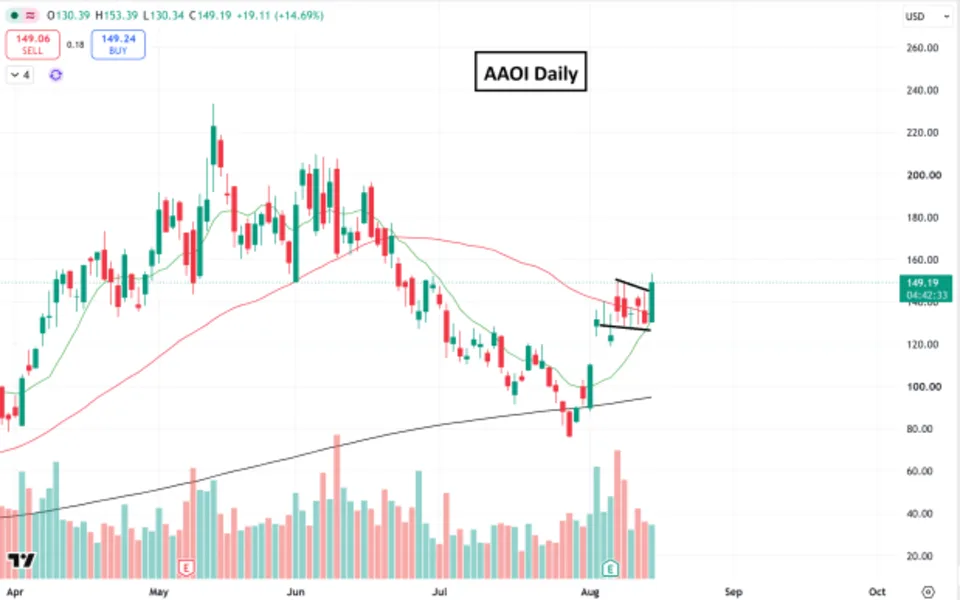
AAOI stock has reclaimed its 50-day moving average and broken out from a perfect bull flag pattern.
Conclusion

With traditional copper-based infrastructure being replaced by high-speed optical transceivers, AAOI's vertical integration, expanding profit margins, and multi-year agreements position it to fully capitalize on the AI boom.

Leituras Relacionadas

Wall Street Morning Report: S&P Earnings Growth Hits 30-Year High, Nvidia Becomes SpaceX's 6th Largest Shareholder

Wall Street Morning Report: S&P 500 earnings growth hits a 30-year high; Nvidia becomes SpaceX's 6th largest shareholder. Market Summary: U.S. stocks ended slightly lower on Friday after record highs, with the S&P 500 posting a weekly gain. Weaker-than-expected July retail sales data significantly reduced market expectations for a September Fed rate hike. Key Themes: * **Macro & Rates:** The probability of the Fed holding rates steady in September rose to ~70%. Geopolitical tensions in the Middle East supported oil prices near $90. Focus this week is on a $16B 20-year Treasury auction testing investor demand amid high yields. * **Corporate Earnings:** S&P 500 Q2 earnings grew 31%, the fastest pace since 1992 excluding recession recoveries, driving a valuation reset. * **AI & Tech Sector Rotation:** The AI investment narrative faces scrutiny over financing and return timelines. Semiconductor stocks saw divergence: memory (SanDisk, Micron) and optical communication (Applied Optoelectronics) surged, while Broadcom fell sharply on credit rating downgrade concerns over AI leasing exposure. * **Notable Moves:** Nvidia disclosed a ~$21B stake in SpaceX. AMD rose 6.5% after a record debt issuance. Reddit rallied ahead of its S&P 500 inclusion. This Week's Highlights: * **Fed Minutes (Thu):** Key for gauging policy divergence and September rate outlook. * **Key Earnings:** Alibaba, Walmart, Nvidia, AMD. * **Events:** Seoul AI Summit, World Robot Conference, potential恒生指数 rebalancing. * **Data:** U.S. jobless claims, Japan core CPI, Korea early export data (a leading indicator for semiconductors).

marsbitHá 17m

Wall Street Morning Report: S&P Earnings Growth Hits 30-Year High, Nvidia Becomes SpaceX's 6th Largest Shareholder

marsbitHá 17m

BTC in Range-Bound Consolidation, HYPE Daily Rebound Confirmed | Invited Analysis

**Market Analysis: BTC Consolidates in Range, HYPE Shows Daily Rebound Confirmation (Weekly Outlook)** **BTC Analysis:** The market is at a key juncture. Bitcoin is undergoing a daily correction, with a critical focus on whether it can find support and stabilize above the $60,950 level. The adjustment that began from the May 6th high has formed a complex seven-segment structure on the daily chart. Three potential paths are identified: 1. **Continuation of the c-wave rally** (primary scenario), targeting $67,300 initially, then $69,500-$71,000. 2. **Range-bound consolidation** between $60,950 and $65,500, forming an "ascending中枢" before an upward breakout. 3. **Breakdown and secondary探底** if support at $60,950-$61,500 fails. Analysis favors the first two scenarios. The 4-hour chart suggests the current adjustment phase is nearing completion near the strong $60,950-$61,500 support zone. **BTC Strategy:** * **Key Levels:** Support at $62,268, $60,950-$61,500, $57,820. Resistance at $65,500, $67,300, $69,500-$71,000. * **Mid-term:** Current model indicates a bearish structure with ~20% short exposure. Consider adding to shorts (up to 50%) only if price rallies to $69,500-$71,000, shows clear stagnation, and model confirms. * **Short-term (30% capital):** Two tactical plans: * **A) Test shorts** near strong resistance ($69,500-$71,000) upon signs of weakness. * **B) Test longs** near strong support ($60,950-$61,500) upon stabilization signals. **HYPE Analysis:** HYPE has established a daily rebound from the August 2nd low. The 4-hour chart shows a five-segment上升 structure with a formed "ascending中枢". The current (76-77) segment is crucial. Two outcomes are possible: 1. **Breakout (Central离开段):** If price breaks and holds above the $58-$58.5 resistance zone, the uptrend continues. Monitor for momentum背驰 between the initial and breakout segments. 2. **Consolidation (Central Extension):** Failure to hold above $58-$58.5 leads to a return to中枢 consolidation, requiring new signals for direction. **HYPE Strategy:** * **Key Levels:** Support at $50-$52, $45. Resistance at $58.5-$60, descending channel upper rail, $72.97. * **Watch:** Whether price can break/hold above $58-$58.5 to confirm the breakout. * **Action:** * **Existing longs (from $50-$52):** Move stop-loss above entry cost. * **New entrants:** Consider light longs only on a confirmed breakout above $58.5-$60 with a tight stop-loss. Exit quickly if momentum背驰 appears. **General Risk Management:** * Set initial stop-loss immediately upon entry. * Move stop-loss to breakeven at +1% profit. * Trail stop-loss upwards by 1% for every subsequent 1% gain to lock in profits. **Disclaimer:** Market conditions change rapidly. This analysis is for informational purposes only and not investment advice. Trading carries significant risk.

marsbitHá 20m

BTC in Range-Bound Consolidation, HYPE Daily Rebound Confirmed | Invited Analysis

marsbitHá 20m

Not Chasing AI or Buying Back Shares, Can 'Stingy' Jingdong Still Succeed?

On August 13th, JD.com (JD.US) released its Q2 2026 earnings, delivering a mixed and generally "flat" performance that met low expectations but offered few positives. Overall revenue declined by approximately 3% year-over-year (YoY) to ~¥346.4 billion, aligning with weakened domestic consumption trends. While group operating profit saw a YoY improvement, this was primarily due to reduced losses in the food delivery segment compared to the high-cost "delivery war" period of the previous year. Key details reveal deeper concerns: revenue from JD's core domestic retail segment fell 4.7% YoY. While electronics sales declined less than feared (~12% YoY), growth in daily necessities and advertising services plummeted by about 10 percentage points each, raising doubts about the segment's mid-term growth momentum post-subsidy adjustments. Logistics revenue growth also slowed to 5.9% as the delivery boom faded. Profitability presented a nuanced picture. The retail segment's operating margin edged up slightly YoY but failed to deliver the significant beats seen in past quarters, suggesting efficiency gains may be nearing limits. Losses from the New Businesses segment (including food delivery and overseas ventures) remained elevated at ~¥9.9 billion, as increased overseas investment partially offset reductions in delivery subsidies. Notably, JD's shareholder returns weakened significantly, with share buybacks in H1 2026 annualizing to only about 5% of market cap. The company opted to park cash in short-term investments rather than boost returns, drawing criticism. Looking ahead, JD's performance hinges on a potential recovery in China's e-commerce sentiment in H2 2026 and the scale of ongoing losses in new ventures. While not burdened by massive AI capex like some peers, and offering relative defensive stability, the lack of positive earnings surprises and diminished shareholder returns provide little compelling reason for investors to favor the stock in the near term.

marsbitHá 30m

Not Chasing AI or Buying Back Shares, Can 'Stingy' Jingdong Still Succeed?

marsbitHá 30m

Trading

Spot
活动图片