
A $20 Million Loss Lesson: For Buying the Dip in U.S. Stocks, Just Remember These 'Three Dos and Three Don'ts'

marsbitPublicado em 2026-02-14Última atualização em 2026-02-14

Resumo

"Losing 20 Million: A Painful Lesson on Bottom-Fishing in the U.S. Stock Market — Remember the 'Three Dos and Three Don'ts'" The author shares hard-earned insights after significant losses, concluding that while timing the peak is crucial for A-shares, bottom-fishing is key for U.S. stocks. The U.S. market's long-term upward trend makes buying the dip a core strategy, though it is psychologically challenging for many investors accustomed to A-shares' volatility. The article defines market corrections into three levels based on decline magnitude and duration: daily (5%+ drop or 2+ weeks), weekly (10%+ or 4+ weeks), and monthly (15%+ or 4+ months). Only 7 monthly corrections occurred in the S&P 500 over 20 years, each driven by macro events like rate hikes or crises. The core of U.S. stock bottom-fishing is a disciplined, batched approach. The "Three Dos and Three Don'ts" are: 1. Do plan batched entries; don’t make impulsive trades. 2. Prioritize "buying enough" over "buying cheap." 3. Use time-based batches (e.g., buying every few weeks) over price-based batches. For weekly corrections, a three-batch plan over ~10 weeks is suggested. For rarer monthly corrections, a 6-month plan with decreasing batch sizes (1/2, 1/3, 1/6) is advised. The strategy assumes the market’s long-term growth and relatively low volatility. The article also categorizes downturns: natural pullbacks, valuation-driven adjustments, and systemic crises (e.g., 2008, 2020). While black swan events are unp...

Author: SOL, the Unfathomable

After losing $20 million, I finally understood the probabilities of investing: for A-shares, the most important thing is to exit at the top; for U.S. stocks, the most important thing is to buy the dip.

Exiting the top in A-shares, especially a major top, is both the easiest and the most difficult. It's easy because the top of A-shares is typically a peak of euphoria; in hindsight, the word "major top" is almost written on the chart.

It's difficult because A-shares only make money when going long, and the stock market generally rises over the long term. Exiting the top locks in profits but doesn't make money by itself, and human nature is inherently greedy.

In contrast, the most important thing for U.S. stocks is to buy the dip. Looking at the market over the past 20 years, buying on every dip has been the most important investment rule.

One could say that for money already invested, it's simply a matter of holding on; the key is when to buy the dip with new money? And for investing in U.S. stocks, the easiest and most difficult thing is also buying the dip.

It's easy because buying the dip in U.S. stocks means "buy a little on small dips, buy a lot on big dips, don't buy when there's no dip."
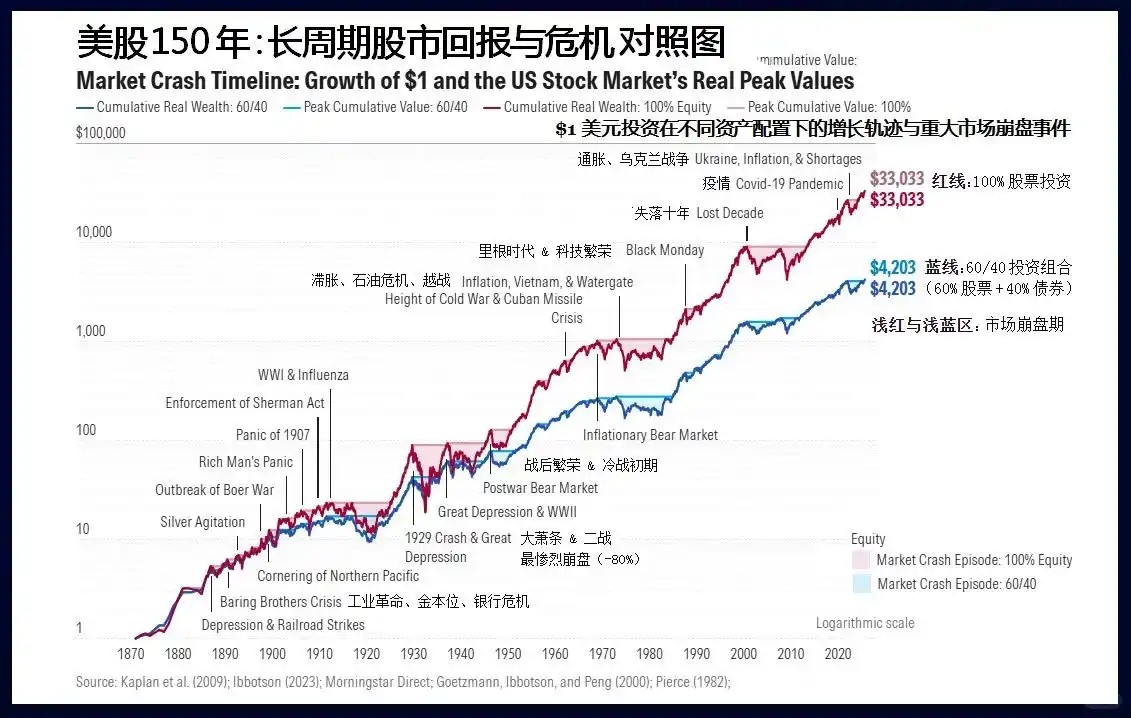
Since 1776, everyone who has bet against America has ultimately ended in their own miserable failure.

It's most difficult because most people come from A-shares, where they've experienced "buying the dip halfway down the mountain," suffering from "dip-buying PTSD syndrome." They always want to buy lower to give themselves some safety cushion, resulting in not daring to buy during the dip and then chasing the rebound.

Therefore, when a dip-buying opportunity arises in U.S. stocks, everyone must clarify two questions:

1. Under normal circumstances, how much does a typical U.S. stock correction fall?

2. If a black swan event occurs and the fall seems endless, what should be done?

1. How deep are U.S. stock corrections? First, let's define what a "correction" is.

Corrections are usually divided into three levels: daily, weekly, and monthly. A round of decline must meet one of two conditions: magnitude or duration (everyone's definition may differ; this article only represents my standard).

  • Daily level: A drop of 5% or more from the highest point, or a duration of more than two weeks (referring to the time span from the highest to the lowest point);
  • Weekly level: A drop of 10% or more from the highest point, or a duration of more than 4 weeks;
  • Monthly level: A drop of 15% or more from the highest point, or a duration of more than 4 months.

Meeting one of the two conditions is sufficient. Some corrections are not deep in magnitude but drag on for a long time; others are the opposite. After clarifying the definition, buying the dip essentially has two goals:

  • Goal one: Buy all the positions you want
  • Goal two: Buy as cheaply as possible

Market trends are always clear in hindsight but confusing in real-time. When a correction is happening, we can only be sure of two things—how much it has fallen from the previous high to today, and how many days it has been falling?

It could continue to fall, consolidate, or start rising again.

So these two goals conflict. Buying too quickly might achieve goal one but at a higher price;

But if you only focus on buying cheap, you might miss out and the price could rise without you.

This requires us to have a probabilistic understanding of the magnitude of corrections in the historical trends of U.S. stocks to set a reasonable goal.
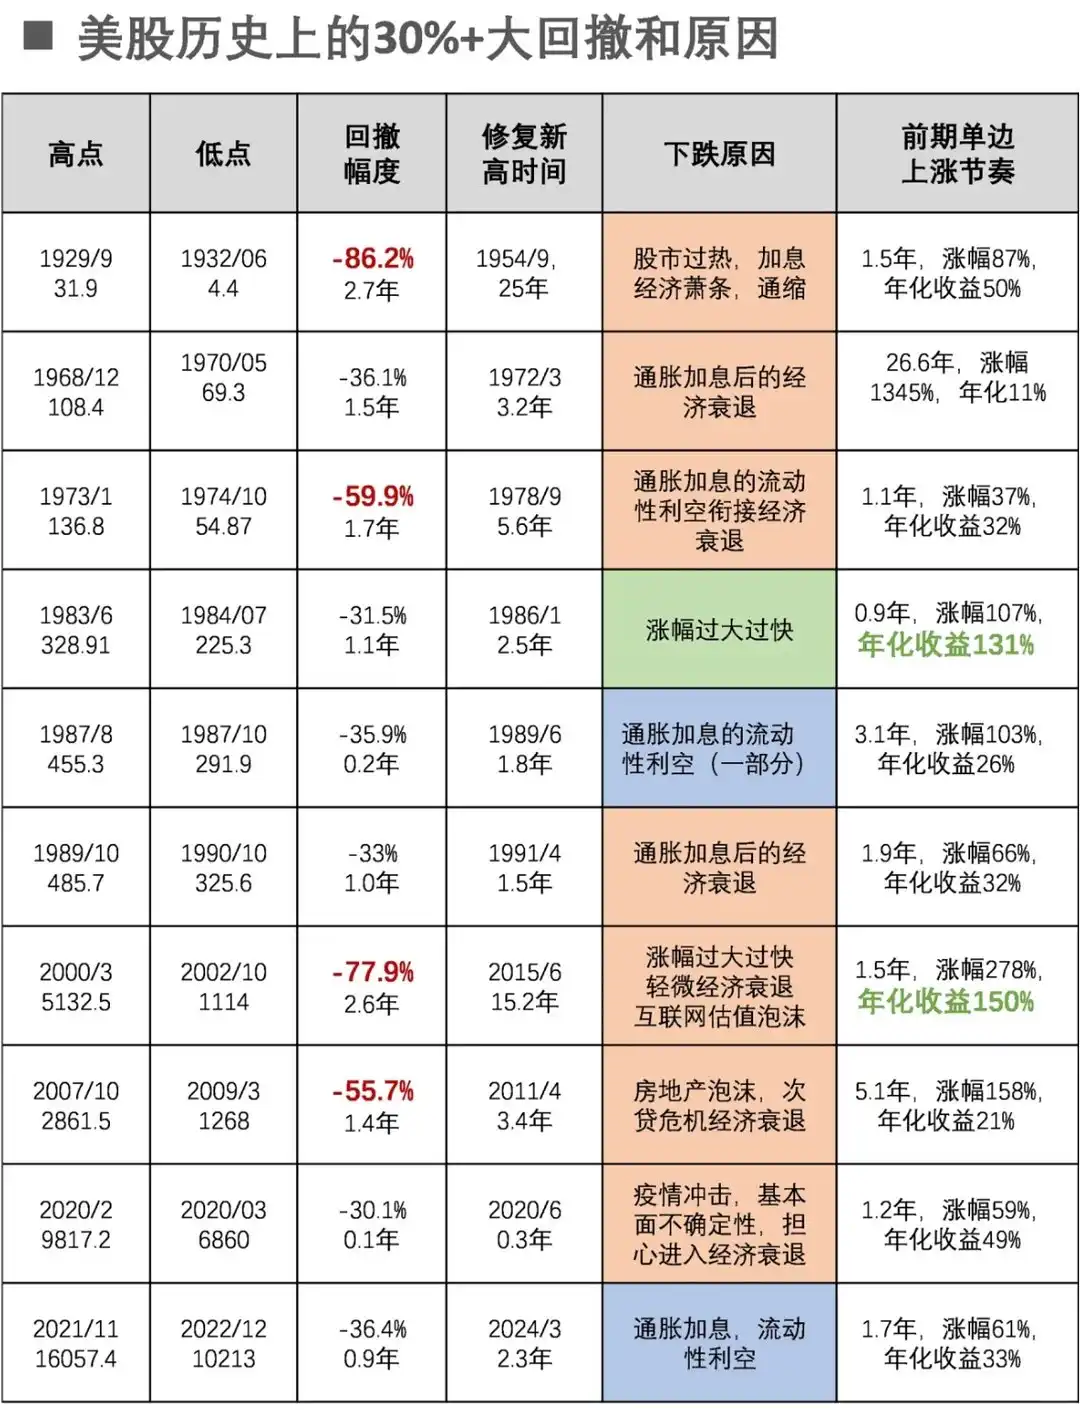
Major Drawdowns of 30%+ in U.S. Stock History and Their Causes

Taking the S&P 500 Index as an example, there have been only 7 monthly-level corrections in the past 20 years since 2004, with reasons分别为:

  • Jan-Oct 2022: The most aggressive interest rate hike cycle in 40 years
  • Feb-Mar 2020: Global public health event
  • Sep-Dec 2018: Trade war combined with interest rate hikes
  • Jul 2015 - Feb 2016: Chinese economic slowdown combined with interest rate hike expectations
  • Apr-Sep 2011: Deepening European debt crisis
  • Apr-Jun 2010: European debt crisis and Goldman Sachs fraud scandal
  • Oct 2007 - Mar 2009: Subprime mortgage crisis

So monthly-level corrections in U.S. stocks are still very rare, occurring on average once every three years, each with macro-fundamental reasons. From September 2011 to July 2015, there was a 44-month period without one, a proper long bull market.

Weekly-level corrections are more frequent, happening 2-3 times a year, and don't necessarily require fundamental reasons; just rising too much can lead to a correction.

Therefore, when buying the dip, the first thing to judge is whether this is a weekly-level or a monthly-level correction?

But stock movements are influenced by various new pieces of information, making accurate prediction difficult. The Fed isn't your family's business; negative and positive news won't arrive according to your plan—fortunately, you can still decide your own goal.

You need to think about a question, imagine it's haggling with a vendor: if you can only choose one goal between "buying" and "buying cheaply," which do you choose?

If it's the former, you should assume the correction is weekly-level and plan accordingly. This way, even if it turns out to be a monthly-level correction, you can still complete your first goal. Similarly, if your goal is "buying cheaply," you should prepare a dip-buying plan for a monthly-level correction.

However, generally, I recommend making "buying" the primary goal, especially when you have idle cash. First, because monthly-level corrections occur only every three years, the probability is indeed low. Second, with idle cash, if you don't buy U.S. stocks, you might end up buying other high-risk products.

With a goal, the plan becomes much simpler.

2. Time Plan vs. Price Plan: The First Question in Buying U.S. Stock Dips—When to Start the Plan?

Taking a weekly-level correction's dip-buying as an example, as long as it doesn't hit a new high for two weeks, a daily-level correction is already happening, and you should prepare a dip-buying plan for a weekly-level correction.

The core of buying U.S. stock dips is two words—scale in.
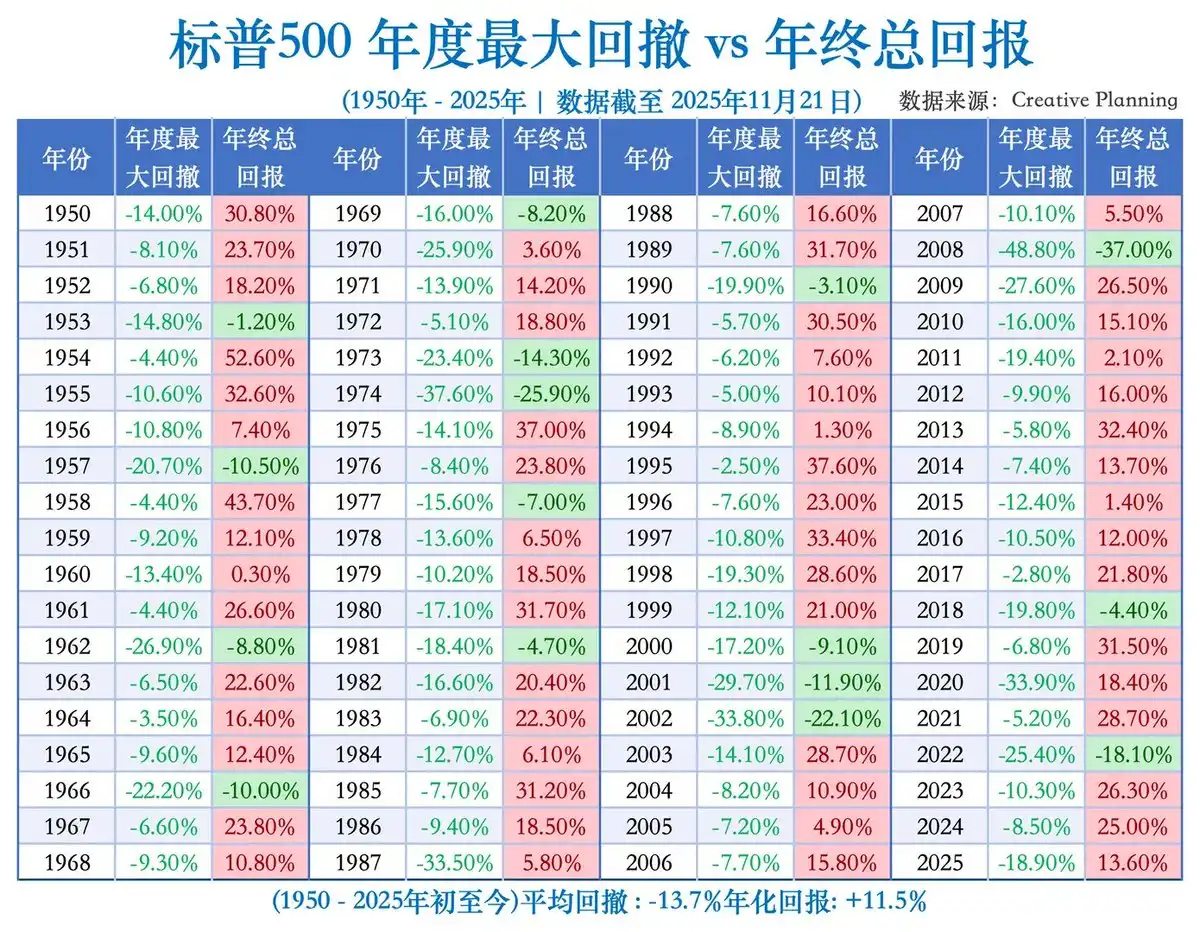
There are two types of scaling-in plans: one is time-based scaling, buying at fixed time intervals; the other is price-based scaling, buying when the price falls to certain levels. Based on the trends of the past 20 years, for weekly-level corrections (excluding monthly-level ones), the average time from high to bottom is 10 weeks. Thus, time-based scaling can be divided into three batches: starting from the high, buy the dip every three weeks afterward, with a longer interval between the second and first batches.

Price-based scaling can also be divided into three batches, buying one batch at a 3% drop from the high. If the maximum drop is 10%, the entire dip-buying plan can be completed.

The completion probabilities of these two plans differ. The time plan can generally be completed unless it's only a daily-level correction that quickly hits new highs—which isn't regrettable, as you've at least seized a daily-level correction opportunity to add positions.

But the price-based plan might not be completed. Many weekly-level corrections in U.S. stocks only last longer without reaching a 10% drop.

For weekly-level corrections, with "completing the dip buy" as the primary goal, "time-based scaling" should be prioritized. Even if the drop hasn't reached the target, once the correction time arrives, execute the scaling-in plan.

Now, considering a dip-buying plan targeting monthly-level corrections: the average time to bottom is 6.5 months, but it varies greatly. So, adopt the mindset of "probably won't complete the buy" and buy as much as possible.

Don't average the position sizes; instead, use a front-heavy approach: three batches at 1/2, 1/3, and 1/6 of the total plan.

The time plan can be batched as: first month, third month, sixth month. The price plan can be batched as: 3% drop, 8% drop, 15% drop. Often, when you target a "monthly-level" correction, you end up completing a weekly-level correction's dip-buying plan but with insufficient volume. Hence, I initially suggest focusing on the weekly-level correction plan as much as possible.

Buying U.S. stock dips can be simply summarized as three dos and three don'ts:

1. Do make a scaling-in plan; don't make random decisions or trade impulsively during the session;

2. Prioritize "buying enough" over "buying cheaply";

3. Prioritize "time-based scaling" over "price-based scaling." Buying U.S. stock dips is a very mechanical plan, and the premise of this plan is the long-term upward and relatively low-volatility trend of U.S. stocks.

But the stock market is ultimately a place of human博弈, and economic operations themselves are unpredictable. Black swan events can happen at any time and will inevitably happen.

If the correction's duration or depth exceeds the plan, how should you respond? If a black swan event occurs, what should be done?

3. Black Swan Events

The above corrections are divided into monthly and weekly levels, which has the advantage of clear standards. But even among monthly-level corrections, differences are significant. For instance, 2008 and 2020 were actually economic crises, not mere stock market corrections.

Thus, market adjustments can also be categorized into three types based on causes:
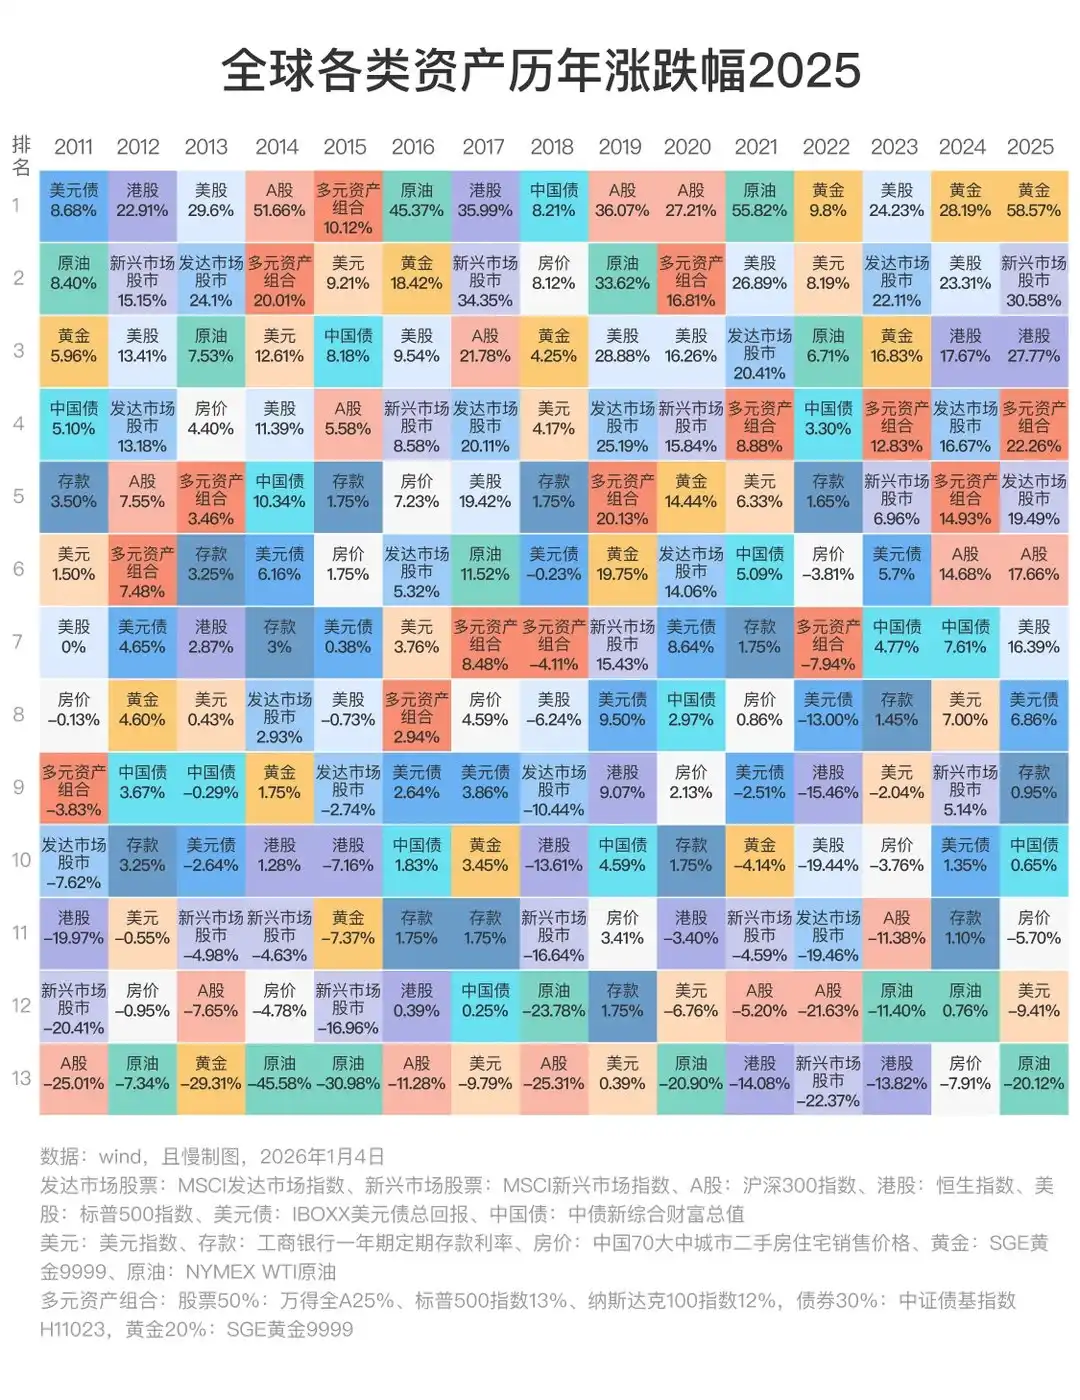
1. Natural correction due to excessive cumulative gains, but macro fundamentals are generally positive—Most daily and weekly-level corrections fall into this category.

2. Correction due to overvaluation combined with economic recession or a shift to hawkish monetary policy—A minority of weekly and most monthly-level corrections belong here.

3. Economic crisis or major recession caused by systemic risk—A minority of monthly-level corrections or long-term bear markets fall into this category.

In the past 20 years, the 2008 subprime crisis and the 2020 public health event belong to the third type. The former fell 58% in over a year; the latter fell 35% in two months. So the third situation exceeds our dip-buying plan and requires separate analysis.

However, crises and corrections are indistinguishable at the beginning. When U.S. stocks started falling in 2007, the market thought it was an economic recession. After the Fed began cutting rates, the market rebounded. By early 2008, investors were already buying the dip aggressively.

Therefore, during the dip-buying process, continuously observe whether new events have occurred initially or whether the initial causes of the decline have worsened.

Taking recent deep declines as examples: A standard bear market like the 27% drop in 2022 is actually the easiest to judge. It's driven by standard macro logic; everyone is discussing rate hikes; all prices are soaring; every month, data tells you it's worse than the last. At most, you might have losses at the initial confirmation of the dip buy; later, you'll naturally know it's a protracted battle, requiring an extended dip-buying timeline.

A "once-in-a-lifetime" crash like the 36% drop in one month during the 2020 public health event, triggered by non-economic black swan factors, is indeed panic-inducing short-term, but once it's over, it's over. In this case, you can only endure.

The most difficult was the 58% drop during the 2008 financial crisis, which was a mix of the above two situations. A crisis event during an ordinary recession triggered a deep recessionary bear market. It couldn't be predicted, only responded to.

Going further back, the 2000 dot-com bubble burst was a rare暴跌 caused by excessive valuation, which in turn dragged down the economy. But the valuation levels then were much, much higher than now. It was a discernible gray rhino event, but no one wanted to "get off first."

Synthesizing these types of U.S. stock declines, you'll find that it's best not to predict U.S. stock declines in advance. The most important thing is to face reality and respond after it happens; the sky won't fall.

Of course, having no expectations and making timely and correct responses after the fact requires you to pay attention to the market. You can't just allocate like wealth management without management. You still need to assess, after a certain stage of decline, whether it might evolve into a crisis.


Criptomoedas em alta

Perguntas relacionadas

QWhat are the 'three dos and three don'ts' for bottom-fishing in the U.S. stock market as summarized in the article?

AThe three dos and three don'ts are: 1. Do make a batch plan; don't make random decisions or emotional trades during the session. 2. Prioritize 'buying enough' over 'buying cheap'. 3. Prioritize 'time-based batching' over 'price-based batching'.

QAccording to the author, what is the most important rule for investing in U.S. stocks over the past 20 years?

AThe most important investment rule for U.S. stocks over the past 20 years is to buy on every dip.

QHow does the article define a monthly-level correction for the U.S. stock market?

AA monthly-level correction is defined as a drop of 15% or more from the highest point, or a time span lasting 4 months or more from the peak to the trough.

QWhat are the only two things one can be sure of during a market correction, as stated in the article?

ADuring a market correction, the only two things one can be sure of are how much it has fallen from the previous high to the present day and how many days it has been falling.

QWhat are the three types of market adjustments classified by cause in the article?

AThe three types are: 1. Natural adjustments due to excessive cumulative gains, with macro fundamentals generally sound. 2. Adjustments caused by overvaluation combined with an economic recession or a shift to hawkish monetary policy. 3. Economic crises or major recessions caused by systemic risks.

Leituras Relacionadas

After Three Consecutive Quarters of Decline, Can the Crypto Market Find a Window for Stabilization in Q3?

The cryptocurrency market has just concluded its worst-performing quarter since 2022, with total capitalization dropping 12.6% to $2.1 trillion. All core metrics indicate capital is leaving the sector, not just rotating within it. Bitcoin fell 14.2% and Ethereum dropped 25.4% in Q2, breaking their previous correlation with US tech stocks. A key driver is the reversal in US spot Bitcoin ETF flows, which saw a net outflow of approximately $4.67 billion in Q2, including a record monthly outflow near $4.5 billion in June. While recent data suggests long-term holders are accumulating again, sustained ETF outflows mean continued selling pressure. Market focus is now singularly on the Federal Reserve. The upcoming July FOMC meeting is seen as the most critical event for Q3. A dovish signal could support Bitcoin reclaiming a $68,000-$84,000 range, while a hawkish stance might establish a new trading band around $50,000-$56,000. Additionally, regulatory uncertainty persists, with the progress of the crucial *CLARITY Act* stalling in the Senate, reducing its perceived 2026 passage probability to 40-45%. Despite the broad downturn, a few sectors showed growth. Prediction markets saw nominal volume surge 48.7% year-over-year to $113.8 billion, and tokenized collectibles transaction volume rose 143% quarterly to $1.4 billion. The Real-World Asset (RWA) tokenization sector also continued steady growth, now representing ~$28.1 billion in on-chain value. The market's foundation for an extreme crash appears limited, with Bitcoin price hovering near its 200-week moving average. However, the trading paradigm has shifted from narrative-driven speculation to decisions based on price action, policy developments, and interest rate expectations, making a broad sentiment-driven rally unlikely in the near term.

marsbitHá 14h

After Three Consecutive Quarters of Decline, Can the Crypto Market Find a Window for Stabilization in Q3?

marsbitHá 14h

BIT Trading Moment: BTC Still Suppressed by Weekly 200 EMA, Rejection May Restart Decline; Storage and Semiconductors that Surged Last Night Begin Falling in Evening Trading

**Crypto & Stock Market Wrap: Bitcoin Tests Resistance, Stocks Retreat After AI Surge** Bitcoin consolidates around $66,000, facing key resistance near $68,000—an area seen as a major psychological and technical hurdle where previous rallies have failed. Analysts note the cryptocurrency is caught between its 200-week moving average (~$63,333) and 200-week EMA (~$68,328). A clear break above $68k is needed to signal a stronger bullish trend, while a rejection could lead to a retest of $63k support. Market sentiment remains cautious, with low futures open interest pointing to a low-liquidity rebound rather than a full bull market. Bitcoin spot ETFs saw another $203 million inflow. US stock futures pointed lower after a strong Tuesday session led by a massive rebound in semiconductors and memory stocks. The rally was fueled by renewed optimism about AI-driven hardware demand, with Micron, SanDisk, and SK Hynix surging. However, those gains reversed in pre-market trading. Super Micro Computer (SMCI) soared over 20% after hours on strong guidance and a record backlog. Other standouts included Rocket Lab and nuclear energy plays Oklo and X-Energy. Rising oil prices (Brent above $91) and climbing Treasury yields (10-year near 4.64%), however, are reigniting inflation concerns and acting as a headwind for equities. In Asia, markets were mixed. South Korea's KOSPI pared early gains to close slightly higher as semiconductor stocks like SK Hynix gave back initial surges. Japan's Nikkei edged lower as the yen hit a fresh 38-year low against the dollar, raising fears of potential market intervention. Key events to watch include the Samsung Galaxy launch, AMD's AI event, and a slew of major tech earnings from Alphabet, Tesla, and IBM after the close on Wednesday, followed by the ECB meeting and Intel's earnings on Thursday.

marsbitHá 14h

BIT Trading Moment: BTC Still Suppressed by Weekly 200 EMA, Rejection May Restart Decline; Storage and Semiconductors that Surged Last Night Begin Falling in Evening Trading

marsbitHá 14h

Former CFTC Chairman, Circle President Tarbert: Preaching Long-Termism While Cashing Out $30 Million Himself

Former CFTC Chairman and Circle President Heath Tarbert has consistently advocated for a long-term vision in public, urging patience from investors as Circle’s stock price has fallen significantly from its peak. However, it has been revealed that since Circle’s IPO, Tarbert has continuously sold his CRCL shares through pre-arranged trading plans, cashing out approximately $30 million, without making any public market purchases. This contrast between his public messaging and personal actions has drawn criticism. Tarbert joined Circle in July 2023 as Chief Legal Officer, leveraging his regulatory experience to help guide the company through its IPO and expansion. Despite promoting stablecoins as long-term infrastructure, he established a 10b5-1 trading plan just before Circle went public, leading to substantial stock sales over the following year. In March 2026, he initiated another plan to sell more shares. His career trajectory highlights a pattern of moving between high-level regulatory roles and influential positions in the financial sector. After resigning as CFTC Chairman in early 2021, he joined Citadel Securities as Chief Legal Officer just 27 days later, during a period of intense regulatory scrutiny for the firm. He later joined Circle, aiding its efforts to navigate regulatory challenges for its public listing. While Tarbert's expertise in policy and compliance is valuable to companies like Circle, his actions—advocating long-term confidence while personally divesting—raise questions about the alignment between his public statements and his private financial decisions, leaving investors who followed his advice to bear the market risks.

marsbitHá 14h

Former CFTC Chairman, Circle President Tarbert: Preaching Long-Termism While Cashing Out $30 Million Himself

marsbitHá 14h

Gate Research Institute: The 'Wall Street-ization' Wave of Crypto Financial Products – Competition or Integration?

The article titled "Gate Research Institute: Are Crypto Financial Products Sparking a 'Wall Street' Wave—Competition or Convergence?" explores the evolving relationship between the crypto ecosystem and traditional finance (TradFi). The piece begins by reflecting on Bitcoin's original 2009 vision of decentralization, disintermediation, and moving away from banks. It then contrasts this with the 2024 landscape, where key crypto assets like Bitcoin are increasingly held through Wall Street products like ETFs issued by giants like BlackRock. The article questions whether this signifies that TradFi is systematically taking over the rights to issue, price, custody, and distribute crypto financial assets. The core argument is that this is not a zero-sum takeover but rather a bidirectional convergence where each side addresses the other's weaknesses. Crypto offers 24/7 global markets, programmable settlement, and open access but lacks compliant channels, institutional-grade custody, deep fiat liquidity, and mainstream distribution. TradFi possesses these but is constrained by legacy systems, limited operating hours, and slow settlement. Two primary convergence paths are highlighted: * **Path A (CEX to TradFi):** Exemplified by Gate, which has progressed from offering tokenized stocks and CFDs to providing direct, real stock trading (US, Hong Kong, South Korea) within its platform, using USDT. * **Path B (TradFi to Crypto):** Exemplified by Robinhood, which has integrated crypto trading, acquired exchanges like Bitstamp, and is moving traditional assets like stocks onto the blockchain via tokenization and its own Layer 2. Both paths are ultimately competing to become the next-generation, unified financial account—a "super account" where users can seamlessly trade cryptocurrencies, stocks, ETFs, RWA (Real World Assets), and tokenized treasury products in one interface. The growth of RWA and tokenized treasuries (e.g., BlackRock's BUIDL) is presented as the asset-layer fusion, providing stable, yield-bearing assets on-chain and acting as a bridge between the two worlds. In conclusion, the "Wall Street-ization" of crypto is framed as a mutual transformation. Decentralized ideals persist in the protocol layer, while at the application layer, a more efficient, global, and accessible unified capital market is emerging from this convergence. The future competition lies not between crypto exchanges and stockbrokers, but between platforms vying to offer the most comprehensive asset coverage, liquidity, and user experience within a single account.

marsbitHá 14h

Gate Research Institute: The 'Wall Street-ization' Wave of Crypto Financial Products – Competition or Integration?

marsbitHá 14h

Trading

Spot

Artigos em Destaque

O que é SOLANA

HarryPotterWifHatMyroWynn10Inu,$solana: Uma Mergulho no Projeto de Meme Coin Trendy Introdução No panorama em constante evolução das criptomoedas, projetos inovadores surgem continuamente, capturando a imaginação de investidores e entusiastas. Um desses projetos é o HarryPotterWifHatMyroWynn10Inu,$solana, uma moeda meme que começou a esculpir seu nicho dentro da comunidade cripto. Este artigo tem como objetivo fornecer uma visão abrangente do projeto, elucidando seu propósito, arquitetura, criador, investidores e marcos notáveis ao longo da jornada. O que é HarryPotterWifHatMyroWynn10Inu,$solana? Visão Geral HarryPotterWifHatMyroWynn10Inu,$solana é um projeto de moeda meme estruturado na blockchain Solana – uma plataforma conhecida pela sua escalabilidade e rapidez. Com o objetivo de trazer alegria e criatividade para o espaço cripto, este projeto não serve apenas como um token de negociação, mas também como um catalisador para a geração e partilha de conteúdo meme. Esta comunidade, no seu núcleo, é incentivada a participar ativamente, proporcionando um ecossistema dinâmico onde a criatividade e a colaboração prosperam. Objetivos e Metas Na sua essência, o projeto visa fomentar um ambiente onde os entusiastas de meme possam congregar, partilhar e criar conteúdo meme novo. Esta abordagem orientada pela narrativa infunde entusiasmo dentro da comunidade, impulsionando o envolvimento e ao mesmo tempo lançando luz sobre as robustas funcionalidades inerentes à blockchain Solana. Ao construir um projeto focado na comunidade, HarryPotterWifHatMyroWynn10Inu,$solana também deseja explorar o impacto social das moedas digitais como meio de expressão. Quem é o Criador de HarryPotterWifHatMyroWynn10Inu,$solana? A identidade do criador por trás de HarryPotterWifHatMyroWynn10Inu,$solana permanece envolta em mistério. O projeto foi estruturado de tal forma que a propriedade foi renunciada; portanto, ele prospera como uma iniciativa liderada pela comunidade. Esta descentralização promove transparência e participação democrática entre todos os intervenientes envolvidos. Tal abordagem está a tornar-se cada vez mais popular no mundo das moedas meme, onde o envolvimento da comunidade reina supremo. Quem são os Investidores de HarryPotterWifHatMyroWynn10Inu,$solana? Até agora, não há informações disponíveis publicamente sobre os investidores ou fundações específicas que apoiam HarryPotterWifHatMyroWynn10Inu,$solana. A ausência de investidores conhecidos enfatiza ainda mais a ética orientada para a comunidade do projeto, uma vez que este se mantém independente de estruturas financeiras tradicionais. Esta independência permite que o projeto desenvolva a sua identidade livre de pressões externas, confiando em vez disso no interesse coletivo da sua base de utilizadores. Como Funciona HarryPotterWifHatMyroWynn10Inu,$solana? Modelo Econômico O projeto emprega um modelo econômico único que sustenta sua funcionalidade e envolvimento dos utilizadores. As transações dentro de HarryPotterWifHatMyroWynn10Inu,$solana são projetadas para serem benéficas para todas as partes envolvidas. Cada negociação acarreta uma taxa, que é posteriormente redistribuída entre os detentores atuais, enquanto simultaneamente aumenta o fundo de liquidez. Os principais componentes deste modelo incluem: Mecanismo de Reflexão: Uma parte das taxas de transação é devolvida aos detentores, promovendo o investimento a longo prazo no token. Aquisição de Pool de Liquidez: Fundos são alocados para aumentar a liquidez, garantindo que as operações de compra e venda possam ser executadas sem problemas. Mecanismos de Queima: Uma parte dos tokens pode ser queimada para criar escassez, potencialmente aumentando o valor à medida que a demanda aumenta. Este design incentiva um ecossistema auto-sustentável que prospera com as interações e investimentos da comunidade. Envolvimento da Comunidade No coração de HarryPotterWifHatMyroWynn10Inu,$solana está o valor atribuído ao envolvimento da comunidade. Ao permitir que os utilizadores participem no desenvolvimento do projeto através de várias atividades, como criação e promoção de memes, o projeto promove um ecossistema vibrante onde a criatividade pode florescer. Linha do Tempo de HarryPotterWifHatMyroWynn10Inu,$solana A trajetória de HarryPotterWifHatMyroWynn10Inu,$solana apresenta vários eventos notáveis que moldaram sua posição atual na comunidade cripto: Criação: A data específica de criação permanece não divulgada, mas a origem do projeto está enraizada na cultura meme que permeia a era digital. Assunção da Comunidade: Após a renúncia da propriedade por seu criador, o projeto transitou para um modelo liderado pela comunidade, permitindo que todos os participantes tenham uma participação em seu sucesso. Audit e Coleção de NFT: Em uma tentativa de fortalecer a credibilidade, o projeto completou uma auditoria minuciosa, lançando simultaneamente uma coleção de NFT que serve para incorporação de sua ética centrada em memes. Parcerias e Desenvolvimento: O projeto está atualmente em processo de busca de parcerias potenciais com outros tokens e organizando o desenvolvimento de um website único e opções de merchandising baseadas em seus memes lendários. Pontos Chave Em resumo, HarryPotterWifHatMyroWynn10Inu,$solana assume um papel notável dentro do setor de moedas meme da criptomoeda. Aqui estão algumas das principais conclusões: Iniciativa Liderada pela Comunidade: O projeto prospera como um esforço colaborativo, incentivando contribuições ativas dos membros da sua comunidade enquanto se desliga das reivindicações de propriedade. Modelo Econômico Inovador: Utilizando mecanismos de reflexão, aquisição de liquidez e queima, cria um ambiente financeiro robusto e envolvente para os utilizadores. Envolvimento com NFT e Mercadorias: Com o lançamento de uma coleção de NFT, o projeto busca aprofundar o envolvimento em sua comunidade, reforçando o vínculo entre a cultura meme e moeda digital. Exploração de Parcerias: A iniciativa não está estagnada – o desenvolvimento contínuo e potenciais parcerias indicam uma abordagem visionária voltada para um crescimento sustentável. Conclusão À medida que HarryPotterWifHatMyroWynn10Inu,$solana continua a ganhar tração no panorama das criptomoedas, sua mistura única de envolvimento comunitário, estruturas econômicas inovadoras e integração da cultura meme delineiam seu potencial caminho à frente. Mesmo com o mistério que envolve suas origens e afiliações de investidores, o projeto captura uma história intrigante que fala à essência da inovação descentralizada. Em um mundo onde as criptomoedas são frequentemente vistas através de uma lente puramente financeira, HarryPotterWifHatMyroWynn10Inu,$solana demonstra que o movimento cripto incorpora criatividade, comunidade e colaboração. Seja você um investidor experiente ou um novato, a jornada em desenvolvimento deste projeto de moeda meme certamente serve como um estudo de caso envolvente digno de atenção.

524 Visualizações TotaisPublicado em {updateTime}Atualizado em 2024.12.03

O que é SOLANA

O que é SOLANA 2.0

BarbieCrashBandicootRFK777Inu, $SOLANA 2.0: Um Novo Jogador no Cenário Cripto Introdução ao BarbieCrashBandicootRFK777Inu, $SOLANA 2.0 No sempre evolutivo cenário das criptomoedas, novos participantes estão continuamente a capturar a atenção de investidores e entusiastas. Entre estes projetos emergentes está BarbieCrashBandicootRFK777Inu, representado pelo símbolo de criptomoeda $SOLANA 2.0. Esta iniciativa única combina elementos de glamour, aventura e cultura meme, propondo-se a desafiar as expectativas numa arena altamente competitiva. Com aspirações de crescimento e inovação, este projeto captura o espírito de um azarão a lutar contra gigantes estabelecidos. O que é BarbieCrashBandicootRFK777Inu, $SOLANA 2.0? No seu núcleo, BarbieCrashBandicootRFK777Inu é um projeto de criptomoeda que se inspira em várias referências culturais icónicas. Incluindo a elegância e charme associados à Barbie, a energia dinâmica de Crash Bandicoot e a determinação incansável representada por RFK, o projeto pretende oferecer uma experiência multifacetada no mundo das criptomoedas. O objetivo principal do projeto BarbieCrashBandicootRFK777Inu é fundir estes elementos díspares num ecossistema coeso que atraia um amplo público. Ao abraçar a whimsicalidade da cultura meme enquanto se mantém enraizado nos princípios da descentralização e do empoderamento financeiro, o projeto posicionou-se como uma opção atraente tanto para investidores experientes quanto para novatos no mundo cripto. Quem é o Criador do BarbieCrashBandicootRFK777Inu, $SOLANA 2.0? Apesar do crescente interesse em BarbieCrashBandicootRFK777Inu, as informações sobre o seu criador continuam a ser amplamente desconhecidas. O anonimato do seu fundador ou equipa de desenvolvimento levanta questões sobre a estrutura e governança do projeto. No mundo das criptomoedas, não é incomum que os projetos operem sem criadores públicos. Esta falta de informação pode desmotivar alguns potenciais investidores, enquanto outros podem vê-la como uma oportunidade de abraçar o espírito de descentralização que fundamenta muitas iniciativas de criptomoeda. Quem são os Investidores do BarbieCrashBandicootRFK777Inu, $SOLANA 2.0? Atualmente, há escassas informações disponíveis sobre as fundações ou organizações de investimento que apoiam BarbieCrashBandicootRFK777Inu. A falta de suporte de investimento detalhado do projeto destaca a natureza independente de várias criptomoedas. Neste caso, ainda permanece a incógnita se o financiamento do projeto virá do apoio da comunidade ou do suporte de entidades financeiras maiores. Como Funciona o BarbieCrashBandicootRFK777Inu, $SOLANA 2.0? BarbieCrashBandicootRFK777Inu é concebido com várias características que contribuem para a sua singularidade no espaço cripto saturado. Embora detalhes técnicos específicos permaneçam em segredo, espera-se que o projeto incorpore funcionalidades destinadas a melhorar o envolvimento dos utilizadores e fomentar o crescimento da comunidade. A combinação de influências variadas — desde a moda e aventura até o gaming — incentiva uma atmosfera inclusiva que atende a interesses diversos. Adicionalmente, os laços do projeto com o ecossistema $SOLANA 2.0 sugerem potenciais vantagens tecnológicas. Isto pode incluir velocidades de transação inovadoras, escalabilidade e custo-efetividade, alinhando-se com as capacidades técnicas da blockchain Solana. Os fundadores do projeto parecem estar a aproveitar esta base tecnológica para criar uma experiência comunitária duradoura e uma oferta de produtos substancial. Linha do Tempo do BarbieCrashBandicootRFK777Inu, $SOLANA 2.0 A jornada do BarbieCrashBandicootRFK777Inu contém vários marcos-chave, fornecendo uma visão sobre o desenvolvimento do projeto até agora: Conceitualização do Projeto: Ideias iniciais surgiram em torno da fusão de glamour, aventura e cultura meme, fornecendo a estrutura para o conceito único do projeto. Criação do Token: O token simbólico $SOLANA 2.0 foi estabelecido, concebido para incorporar as aspirações do projeto e atrair o interesse de investidores potenciais. Desenvolvimento do Projeto: Atualmente, o projeto está a passar por novos desenvolvimentos, com ênfase em desafiar os jogadores estabelecidos no espaço cripto e entregar ofertas inovadoras. Estes marcos refletem a trajetória de crescimento do projeto, enquanto destacam o seu compromisso em desenvolver uma experiência pioneira em criptomoedas. Pontos-Chave Sobre BarbieCrashBandicootRFK777Inu, $SOLANA 2.0 Conceito Único: BarbieCrashBandicootRFK777Inu destaca-se ao fundir elementos de glamour, aventura e cultura meme num único projeto de criptomoeda. Espírito de Azarão: O projeto abraça uma persona de azarão, visando desafiar projetos de criptomoeda estabelecidos e criar um nicho na indústria. Fase de Desenvolvimento: Esforços de desenvolvimento ativos estão em andamento, com a intenção de fornecer ofertas novas e inovadoras em alinhamento com as expectativas da comunidade e investidores. Conclusão BarbieCrashBandicootRFK777Inu, representado pelo símbolo $SOLANA 2.0, é uma nova entrada intrigante no mercado de criptomoedas. A sua mistura única de referências culturais e visão ambiciosa pode ressoar com aqueles que buscam valores alternativos em projetos no panorama cripto. Embora o estado desconhecido do seu criador e investidores possa levantar sobrancelhas, a ênfase do projeto em charme e aventura apresenta uma narrativa cativante que expande os limites do que as criptomoedas podem representar. À medida que o projeto continua a desenvolver-se, será interessante observar a sua evolução dentro do amplo cenário cripto e como se posiciona entre os seus concorrentes. Para aqueles envolvidos, BarbieCrashBandicootRFK777Inu pode muito bem desbloquear experiências surpreendentes que redefinem o envolvimento com ativos digitais. Por agora, à medida que o projeto avança, a sua jornada serve como um lembrete de que a inovação no espaço cripto não conhece limites, oferecendo tudo, desde excitação e entretenimento até a potencialidade de empoderamento financeiro.

132 Visualizações TotaisPublicado em {updateTime}Atualizado em 2024.12.03

O que é SOLANA 2.0

Como comprar SOL

Bem-vindo à HTX.com!Tornámos a compra de Solana (SOL) simples e conveniente.Segue o nosso guia passo a passo para iniciar a tua jornada no mundo das criptos.Passo 1: cria a tua conta HTXUtiliza o teu e-mail ou número de telefone para te inscreveres numa conta gratuita na HTX.Desfruta de um processo de inscrição sem complicações e desbloqueia todas as funcionalidades.Obter a minha contaPasso 2: vai para Comprar Cripto e escolhe o teu método de pagamentoCartão de crédito/débito: usa o teu visa ou mastercard para comprar Solana (SOL) instantaneamente.Saldo: usa os fundos da tua conta HTX para transacionar sem problemas.Terceiros: adicionamos métodos de pagamento populares, como Google Pay e Apple Pay, para aumentar a conveniência.P2P: transaciona diretamente com outros utilizadores na HTX.Mercado de balcão (OTC): oferecemos serviços personalizados e taxas de câmbio competitivas para os traders.Passo 3: armazena teu Solana (SOL)Depois de comprar o teu Solana (SOL), armazena-o na tua conta HTX.Alternativamente, podes enviá-lo para outro lugar através de transferência blockchain ou usá-lo para transacionar outras criptomoedas.Passo 4: transaciona Solana (SOL)Transaciona facilmente Solana (SOL) no mercado à vista da HTX.Acede simplesmente à tua conta, seleciona o teu par de trading, executa as tuas transações e monitoriza em tempo real.Oferecemos uma experiência de fácil utilização tanto para principiantes como para traders experientes.

1.7k Visualizações TotaisPublicado em {updateTime}Atualizado em 2026.06.02

Como comprar SOL

Discussões

Bem-vindo à Comunidade HTX. Aqui, pode manter-se informado sobre os mais recentes desenvolvimentos da plataforma e obter acesso a análises profissionais de mercado. As opiniões dos utilizadores sobre o preço de SOL (SOL) são apresentadas abaixo.

活动图片













