On August 20, 2026, Elon Musk responded on social network X to a post featuring a chart that predicts the U.S. national debt will grow to $50 trillion by 2030. The author of the chart marked this level as the point when "everything goes to hell." Musk limited himself to a brief remark: "Accurate chart" — with a laughing emoji.
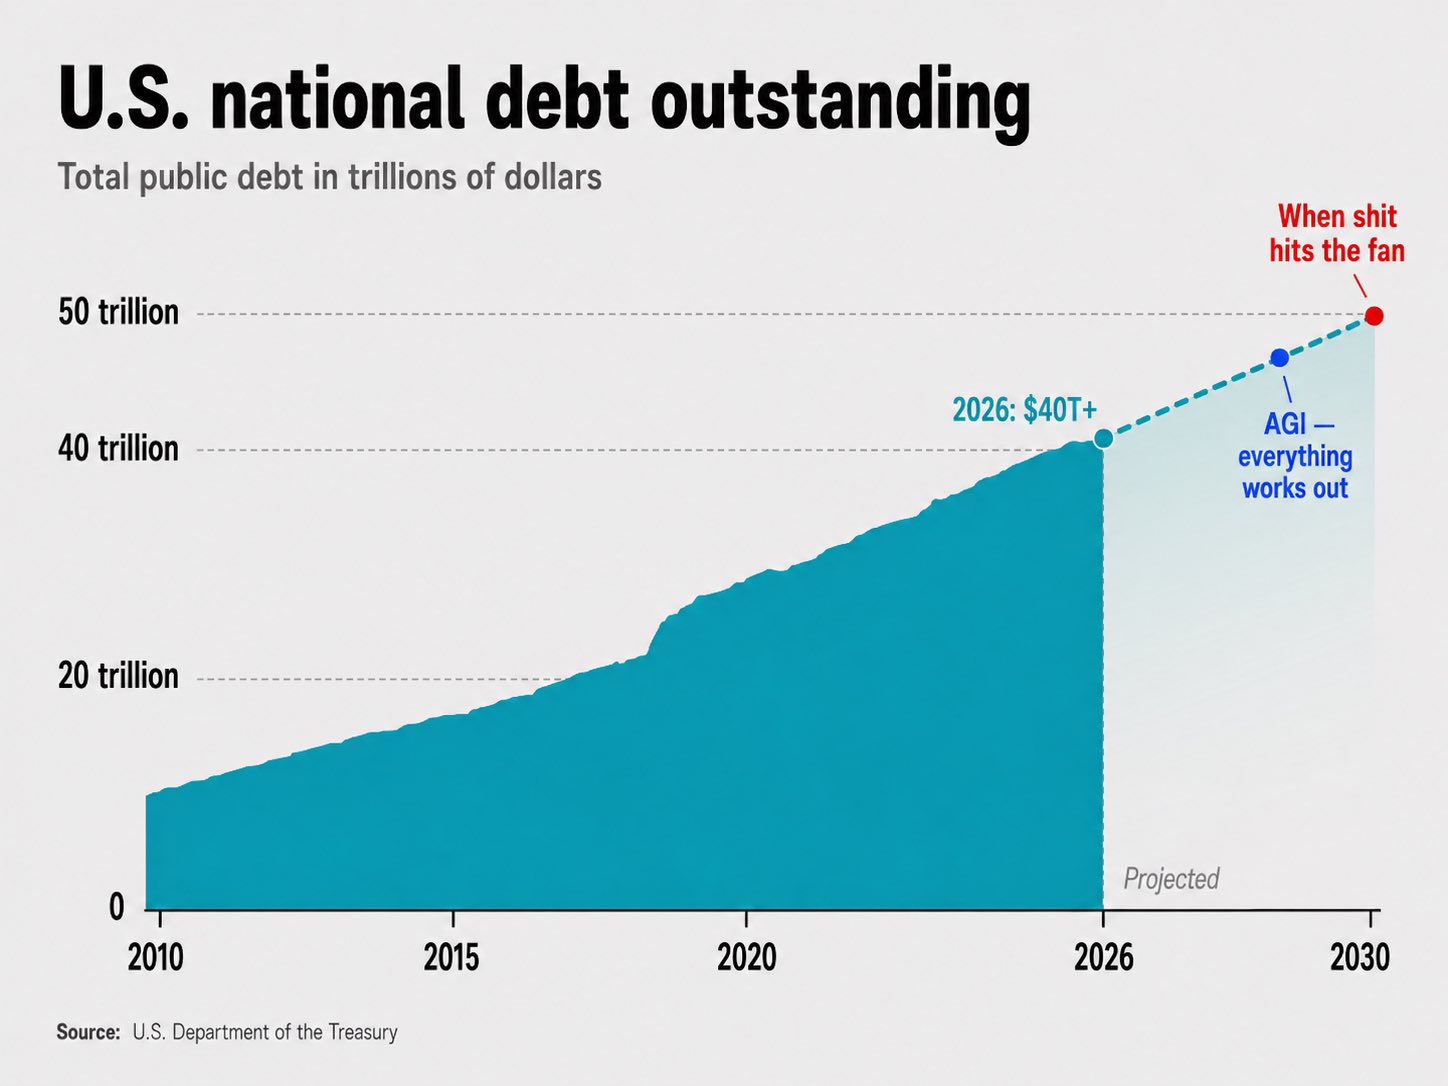
That mark is not far off. According to the U.S. Department of the Treasury, as of August 20, 2026, the total national debt was about $40.03 trillion. The indicator first exceeded the $40 trillion threshold two days earlier, on August 18. According to an estimate by the Peter G. Peterson Foundation, if current budgetary policy continues, the debt could reach $50 trillion within six years — roughly by the timeframe indicated on the chart that prompted Musk's reaction.
Previous Thresholds Were Passed Without Immediate Consequences
Concerns about the size of the debt are not new. In a speech announcing his candidacy for president back on June 16, 2015, Trump stated that with debt at $18 trillion, the country was heading toward $20 trillion and then $24 trillion — a level economists called the point of no return. Since that speech, the debt has more than doubled, and the U.S. economy has not stopped. The round debt figure itself did not prove to be a trigger for collapse — a point skeptics of such forecasts rightly noted.
But this does not mean the size of the debt is completely irrelevant. What matters is not the nominal amount, but what happens with its servicing as it grows — and here, 2026 has measurable differences from 2015, not just a feeling.
Debt Interest Payments Surpassed Defense Spending
According to the Congressional Budget Office, in the first 10 months of fiscal year 2026, interest payments on the national debt amounted to $963 billion — 14%, or $117 billion, more than in the same period the previous year. In the federal budget structure, this item is second only to Social Security. Earlier in the year, interest payments for the first time in history exceeded national defense spending: about $1.03 trillion versus $850 billion.
The average interest rate on Treasury securities has risen from 2.1% to 3.3% — not due to a one-time Federal Reserve decision, but because each new bond issuance must be placed at a higher cost than the previous one. This makes refinancing old debt more expensive, and new borrowing only increases the base on which interest accrues.
Dalio's Assessment: Three Years, Plus or Minus Two
Economist Ray Dalio warned in a Substack post on August 21, 2026, that if the current course is maintained, the U.S. could face a debt crisis "in three years, plus or minus two." His calculations for the current year's budget:
federal government revenues — about $5.5 trillion
expenditures — about $7.5 trillion
deficit — about $2 trillion
interest payments — about $1 trillion
debt volume to refinance — about $10 trillion
Based on this, Dalio recommends reducing the share of bonds in a portfolio and increasing the share of gold — to 10–15% of assets, as well as adding "a little" bitcoin, diversifying investments among countries with stable public finances.
A More Precise Criterion: Not the Debt Sum, but the Ratio of Interest Rate to Economic Growth
Dalio's assessment has a quantitative counterpart in Congressional Budget Office calculations — they answer not the question "what debt amount is dangerous," but "when debt becomes unmanageable." It's not about $40 trillion, not $50 trillion, and not any other specific sum — it's a separate, independent line of calculation that compares two metrics: the average interest rate the government pays on its debt and the economy's growth rate.
As long as the interest rate on debt is lower than the economic growth rate, debt can increase for decades and remain manageable even with a constant deficit: the economy grows faster than interest accumulates, so the debt burden relative to the size of the economy decreases over time on its own. This was the case for almost all of U.S. history — over the past 15 years, the real interest rate on debt averaged 0.9% with real economic growth of 2.2%.
The situation has been changing since 2023: new debt is being issued at rates of 4–5% per annum — higher than the expected long-term economic growth rate. As more and more of the old debt is refinanced at these higher rates, the average rate on the entire debt gradually rises. According to Congressional Budget Office calculations, the interest rate on debt will exceed the economic growth rate in fiscal year 2031 — this does not coincide with forecasts of reaching $50 trillion and is not directly linked to them: one line of calculation concerns the debt amount, the other — the quality of its servicing, and it is the latter, according to economists, that is significant on its own, regardless of the nominal debt sum at that moment.
After the point where the interest rate surpasses economic growth, the mechanism becomes self-sustaining, not one-time: growing debt pushes bond yields upward, higher yields slow economic growth by making credit more expensive for businesses and individuals, slower growth increases the burden of interest payments relative to the size of the economy, and the cycle repeats, accelerating. The Congressional Budget Office calls this a debt spiral.
Is There an Absolute Limit to Debt Growth?
The answer to the question of a limit depends on what is considered the boundary. If speaking of a formal legal limit, it does not exist: the debt ceiling in the U.S. is regularly raised or suspended by Congress, and $50 trillion is not a physical wall. However, the economic limit is determined not by policy, but by market capacity and creditor confidence.
The absolute mathematical limit is the point where the primary budget deficit (expenditures excluding interest) plus debt servicing requires such a volume of new borrowing that the market cannot absorb without explosive growth in yields. Historically, countries lost access to market financing at debt levels of 150–200% of GDP, but the U.S. possesses the unique advantage of being the issuer of the world's reserve currency. This allows them to borrow more and longer than any other country, as demand for dollars and Treasuries is created by the global trading system and central banks of other nations.
Nevertheless, the reserve currency privilege is not limitless. The limit is reached not when debt hits a specific sum, but when investors begin demanding a risk premium that the Treasury cannot pay without compromising stability. This threshold is dynamic: it decreases with high inflation, geopolitical fragmentation, and the emergence of alternative reserve assets. Thus, the limit of U.S. debt growth is not a fixed figure like $50 trillion, but a function of trust in the dollar as a safe asset. Once markets doubt the Fed's ability to maintain the value of debt without monetization, the limit will be reached regardless of the nominal sum.
What Happens When the Limit Is Reached: Three Adaptation Scenarios
When the cost of servicing debt becomes unacceptable to the market or the budget, the system will not necessarily "go to hell" instantly. Economic theory and historical precedents identify three main ways out of a debt impasse, each with consequences for the economy and society.
Scenario 1: Financial Repression and Monetization ("The Japanese Path")
The Federal Reserve artificially keeps bond yields below market levels through yield curve control (YCC) or direct purchases, essentially printing money to cover the deficit. This avoids a technical default, but at the cost of chronic inflation above target levels and gradual erosion of the real value of debt. The debt remains denominated in dollars, but the purchasing power of those dollars declines. For bondholders, this means negative real returns for decades. Many analysts now view this path as the most likely baseline scenario for the U.S., as it is politically the least painful in the short term.
Scenario 2: Harsh Fiscal Consolidation ("The Greek Path")
The government, under market pressure, is forced to sharply cut spending and raise taxes to achieve a primary surplus. As noted above, stabilizing the debt would require adjustments of $2.7 trillion annually. In practice, this would mean cuts to social programs, a freeze on military spending, and increased tax burdens on the middle class and businesses. This scenario leads to deep recession, social tension, and political instability, but preserves the balance sheet purity of the dollar. The likelihood of a voluntary choice of this path in the current U.S. political polarization is assessed as extremely low.
Scenario 3: Technical Default or Restructuring
The most destructive option, where the government declares a moratorium on payments or forcibly changes the terms of existing obligations. Given the dollar's status as a reserve currency, such a scenario would trigger a global financial shock comparable to 2008 but magnified many times over. The probability of this outcome is minimal as long as debt monetization remains possible, but it cannot be entirely ruled out in case of a sudden loss of confidence or political paralysis blocking a debt ceiling increase.
The choice between these paths is not binary. The most realistic trajectory is hybrid: a combination of moderate financial repression, gradual tax increases, and hidden inflation, stretched over decades. In this case, "collapse" looks not like an instant crash, but like a prolonged stagnation in living standards and declining competitiveness of the American economy.
What Such a Trajectory Means in Practice
According to the agency's own baseline forecast, even in a moderate version of such a spiral, debt will grow to 175% of GDP by 2056 — a level the U.S. has never reached, including during world wars. This in itself is not a single event in a specific year, but a long-term trajectory: the indicator will grow gradually throughout all thirty years, not "become such" instantly by that date.
The practical meaning of such a trajectory is examined separately by the Committee for a Responsible Federal Budget, describing six scenarios that uncontrolled debt growth could lead to: a sharp spike in bond yields and panic in financial markets; accelerated inflation if excessive deficits continue to fuel demand in the economy; forced sharp spending cuts or tax increases under market pressure; pressure on the currency exchange rate; risk to solvency on obligations; or a gradual erosion of growth rates and living standards without a single acute moment. According to the organization's assessment, to completely stop the increasing burden on the budget would require a primary surplus (excluding interest) of about 0.7% of GDP — roughly $2.7 trillion in spending cuts or tax increases by mid-century. Neither party has yet proposed a package of this scale.
Musk's reaction to the chart marking $50 trillion coincided with the moment when debt first crossed $40 trillion, and its servicing cost — defense spending. The round debt figure itself does not determine the crisis moment, as history of previous thresholds confirms. Congressional Budget Office calculations shift the focus from the question "what debt amount is dangerous" to "does the cost of servicing debt outpace economic growth rates" — and this shift, according to their forecast, occurs in 2031.
AI Opinion
From a historical pattern perspective, the financial repression scenario has a direct precedent: during the pandemic, the Fed and the U.S. Treasury created about four trillion dollars in liquidity over two years, which, according to trader Arthur Hayes, led to bitcoin growing about twenty-four times. The mechanism is similar to the "Japanese path" described in the article: artificially low yield holdings replace market financing with emission, and excess liquidity seeks assets with limited supply.
The difference is that pandemic-era emission covered a one-time demand shock, while debt monetization covers a structural deficit for decades ahead, meaning the liquidity inflow is stretched, not instantaneous. Does this mean a smooth rise in bitcoin over many years instead of a sharp spike like in 2020–2021, or will the market price in the monetization in advance, in one move?
end-content