Nvidia Vs. Dogecoin: A Historic Ratio Suggests A Possible Rotation, Says Trader

bitcoinistPublicado em 2026-01-21Última atualização em 2026-01-21

Resumo

Cryptocurrency trader Cryptollica suggests a major capital rotation may be imminent from AI-related equities, like Nvidia, into meme coins, particularly Dogecoin. The key signal is the DOGE/NVIDIA ratio, which has returned to a long-term support level that previously preceded massive Dogecoin outperformance in 2017 (100x) and 2021 (50x). The trader frames this as a shift from "The World’s Most Valuable Company" to "The World’s Most Famous Meme," arguing that when the AI trade cools, liquidity rotates into high-beta crypto assets. Supporting this view, Dogecoin's weekly RSI has hit a historically oversold level, which has only occurred four times in 12 years, each marking a significant cycle bottom and a major buying opportunity. While no explicit price target is given, the trader previously forecasted a medium-term goal of $1.30 for DOGE. At the time of writing, Dogecoin was trading at $0.1258.

Trader Cryptollica (@Cryptollica) is arguing that an old relative-value signal is “back” in crypto markets, pointing to the DOGE/NVIDIA ratio and an unusually depressed Dogecoin RSI reading as evidence that capital could rotate from AI-linked equities into high-beta meme coins.

Dogecoin Vs. Nvidia: Rotation Incoming?

In a post on X, Cryptollica said the DOGE/NVIDIA chart has returned to a long-term support zone that previously preceded outsized Dogecoin outperformance versus Nvidia in prior cycles. “THE SIGNAL IS BACK. IT’S HAPPENING AGAIN (2017... 2021... NOW),” the trader wrote.

“The last two times this specific signal flashed on the DOGE/NVIDIA chart, we saw the biggest wealth transfer in history. The crowd is chasing the AI top. The algorithm is loading the Meme bottom. (Altcoin bottom).”

Dogecoin vs Nvidia chart | Source: X @Cryptollica

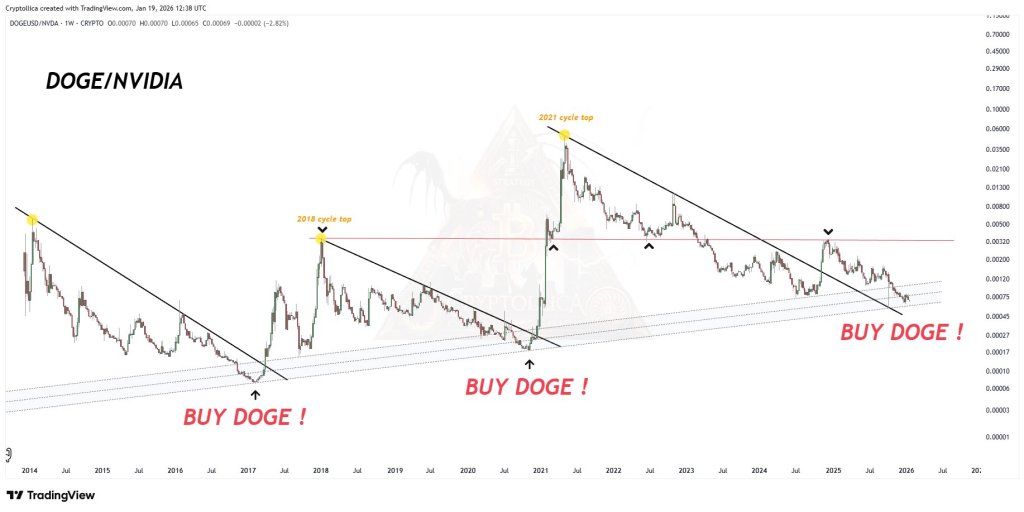
The core claim is less about Dogecoin in isolation and more about positioning on a ratio between what Cryptollica framed as two cultural extremes: “You are watching the wrong chart. This is the ratio of ‘The World’s Most Valuable Company’ (AI) vs. ‘The World’s Most Famous Meme’.” From that framing, the trader leans into a cycle-rhymes narrative, asserting that the ratio has repeatedly found channel support before a DOGE-led surge.

“Structure is repeating history,” Cryptollica wrote, attaching specific historical comparisons. “2017: Ratio hit channel support – DOGE outperformed NVDA by 100x. 2021: Ratio hit channel support – DOGE outperformed NVDA by 50x. NOW: We are back at the exact same support line.”

The posts also attach a broader liquidity-rotation story that has circulated in various forms across risk markets: when one trade stops working, capital seeks the next high-beta outlet: “When the AI Bubble exhales, that liquidity doesn’t vanish. It rotates into High-Beta Speculation,” the trader wrote. “The crowd is buying NVDA at the top. The algorithm is positioning for the DOGE reversal.”

Is Dogecoin An ‘Epic Buying Opportunity’?

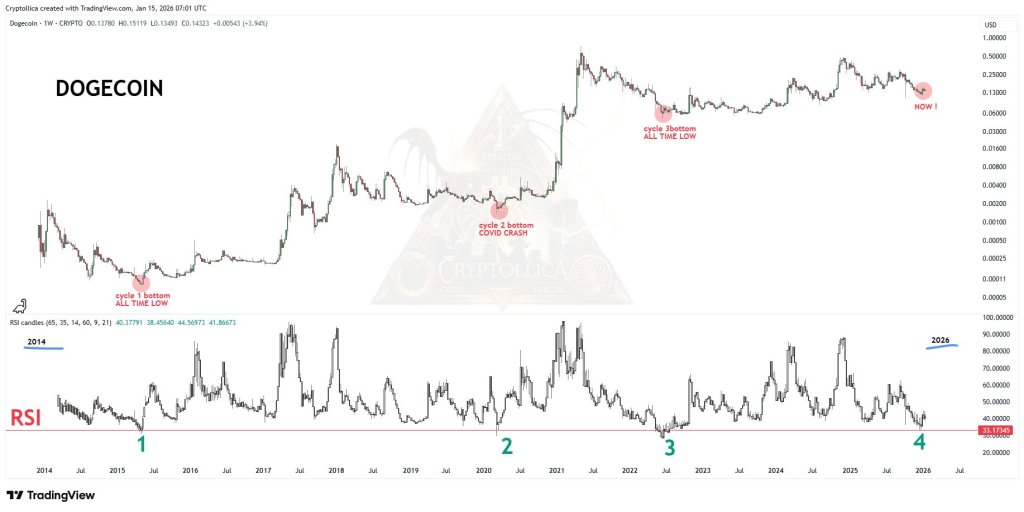
In another post, Cryptollica shifted from the ratio to Dogecoin’s weekly momentum indicator, sharing a second chart highlighting RSI levels and labeling prior cycle lows. “Here you are witnessing an opportunity that only comes around once every 12 years,” the trader wrote. “Over the past 12 years (2014–2026), Dogecoin’s RSI has dropped this low only 4 times. Every single one was an epic buying opportunity.”

The post describes those four moments as a sequence of cycle bottoms, including an “all-time low” first cycle bottom, a “cycle bottom + COVID crash,” a “last cycle bottom,” and “RIGHT NOW!” Cryptollica concluded with a blunt decision frame: “Math or emotions — which one decides for you?”

Dogecoin weekly RSI | Source: X @Cryptollica

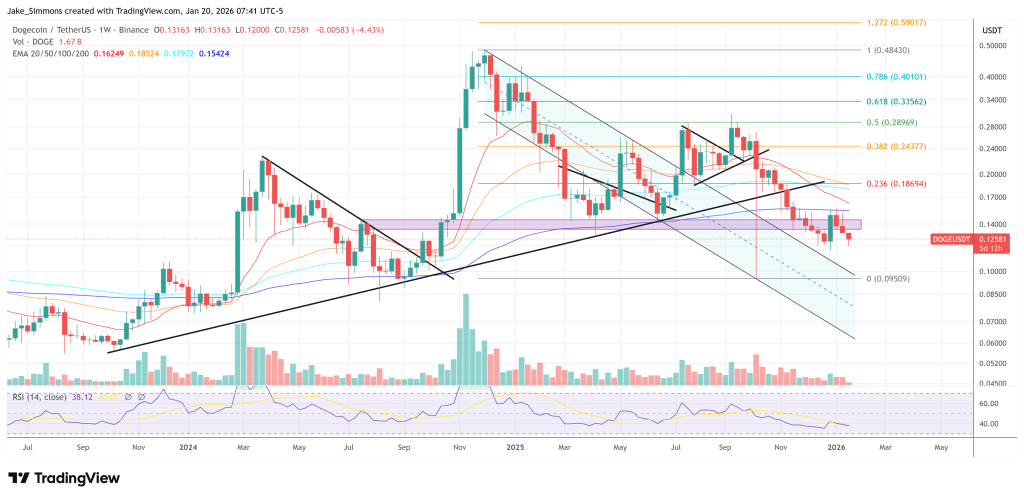
While neither post includes an explicit price target, the analyst said in early December that he expects Dogecoin to reach $1.30 over the medium term, citing a parallel channel top on the 3-day DOGE/USD chart.

At press time, DOGE traded at $0.12581.

DOGE continues to fall after 200-week EMA rejection, 1-week chart | Source: DOGEUSDT on TradingView.com

Perguntas relacionadas

QWhat is the main argument presented by trader Cryptollica regarding the DOGE/NVIDIA ratio?

ACryptollica argues that the DOGE/NVIDIA ratio has returned to a long-term support zone, which historically preceded massive outperformance of Dogecoin versus Nvidia, suggesting a potential capital rotation from AI-linked equities into high-beta meme coins like Dogecoin.

QAccording to the trader, what were the historical outcomes when the DOGE/NVIDIA ratio hit this channel support in 2017 and 2021?

AIn 2017, when the ratio hit channel support, DOGE outperformed NVDA by 100x. In 2021, when it hit the same support, DOGE outperformed NVDA by 50x.

QWhat broader market narrative does Cryptollica attach to this potential rotation signal?

ACryptollica attaches a broader liquidity-rotation narrative, stating that when the AI bubble 'exhales,' the capital doesn't vanish but instead rotates into high-beta speculation, like meme coins.

QWhat does Cryptollica claim about Dogecoin's weekly RSI reading, and how does he frame it?

ACryptollica claims that Dogecoin's weekly RSI has dropped to a very low level only 4 times in the past 12 years (2014-2026), and he frames each of these instances as an 'epic buying opportunity' that marked a cycle bottom.

QWhat was Cryptollica's medium-term price target for Dogecoin mentioned in the article?

AIn early December, Cryptollica cited a parallel channel top on the 3-day DOGE/USD chart and expected Dogecoin to reach $1.30 over the medium term.

Leituras Relacionadas

In a Losing Bear Market, Who Is Quietly Making a Fortune?

Amid a prolonged bear market where most crypto participants are losing money, a few projects continue to generate significant revenue. A closer look at Defillama’s revenue rankings reveals that profitable projects share simple and clear revenue models, primarily falling into two categories: spread income and transaction fees. Spread-based revenue models involve acting as capital intermediaries—absorbing funds at lower costs and deploying them at higher yields. Examples include stablecoin issuers like Tether and Circle, which earn from interest on reserve assets like U.S. Treasuries; lending protocols such as Aave, which profit from the spread between borrowing and deposit rates; and liquid staking services like Lido, which retain a portion of staking rewards as fees. Transaction fee models generate revenue by taxing activities like trading, token creation, or other on-chain actions. Platforms such as Hyperliquid and EdgeX (perpetual trading), Polymarket (event prediction), pump.fun and GMGN (meme trading), Aerodrome and Jupiter (spot trading), as well as Phantom (via swap fees) and NFT marketplaces like Courtyard and Fragment, all rely heavily on transaction fees. Notable exceptions include Grayscale (traditional asset management fees), Chainlink (oracle data service fees), and Titan Builder (which profited unusually from a large MEV capture incident). The key insight is that sustainable profitability in a bear market comes from straightforward revenue models combined with sophisticated product execution, liquidity management, and user engagement—not complex or high-risk strategies.

Odaily星球日报Há 12m

In a Losing Bear Market, Who Is Quietly Making a Fortune?

Odaily星球日报Há 12m

Trading

Spot
Futuros
活动图片