Bottom Building in Progress

insights.glassnodePublicado em 2026-07-08Última atualização em 2026-07-08

Resumo

Bitcoin's market presents a mixed but evolving picture as it potentially grinds toward a cyclical bottom. Macro conditions remain conflicted, with high liquidity countered by quantitative tightening and real yields. On-chain analysis reveals Bitcoin has traded in deep value territory for five months, a historically prolonged discount phase conducive for accumulation. However, long-term holder capitulation is now the dominant downward pressure, with daily realized losses hitting levels unseen since late 2022 and showing no signs of cooling yet. Off-chain, institutional ETF demand remains weak, with persistent monthly outflows and trading volumes still ~80% below the previous bull market peak. While outflows have eased from their June peak, a reversal to net inflows is not yet evident. Derivatives markets show a cautiously long tilt in positioning, with the put/call ratio at a 2026 low. Yet, options pricing still reflects elevated demand for downside protection, even as the absolute cost of that hedging has declined recently. In conclusion, the makings of a bottoming process are visible across on-chain, off-chain, and derivatives data, but key confirmation signals are missing. The market requires a sustained cooldown in long-term holder selling, stabilization in ETF flows, and a price reclaim above key cost basis levels before a definitive regime shift can be confirmed.

Macro Insight

Oil Breaks Away, Risk Recoils

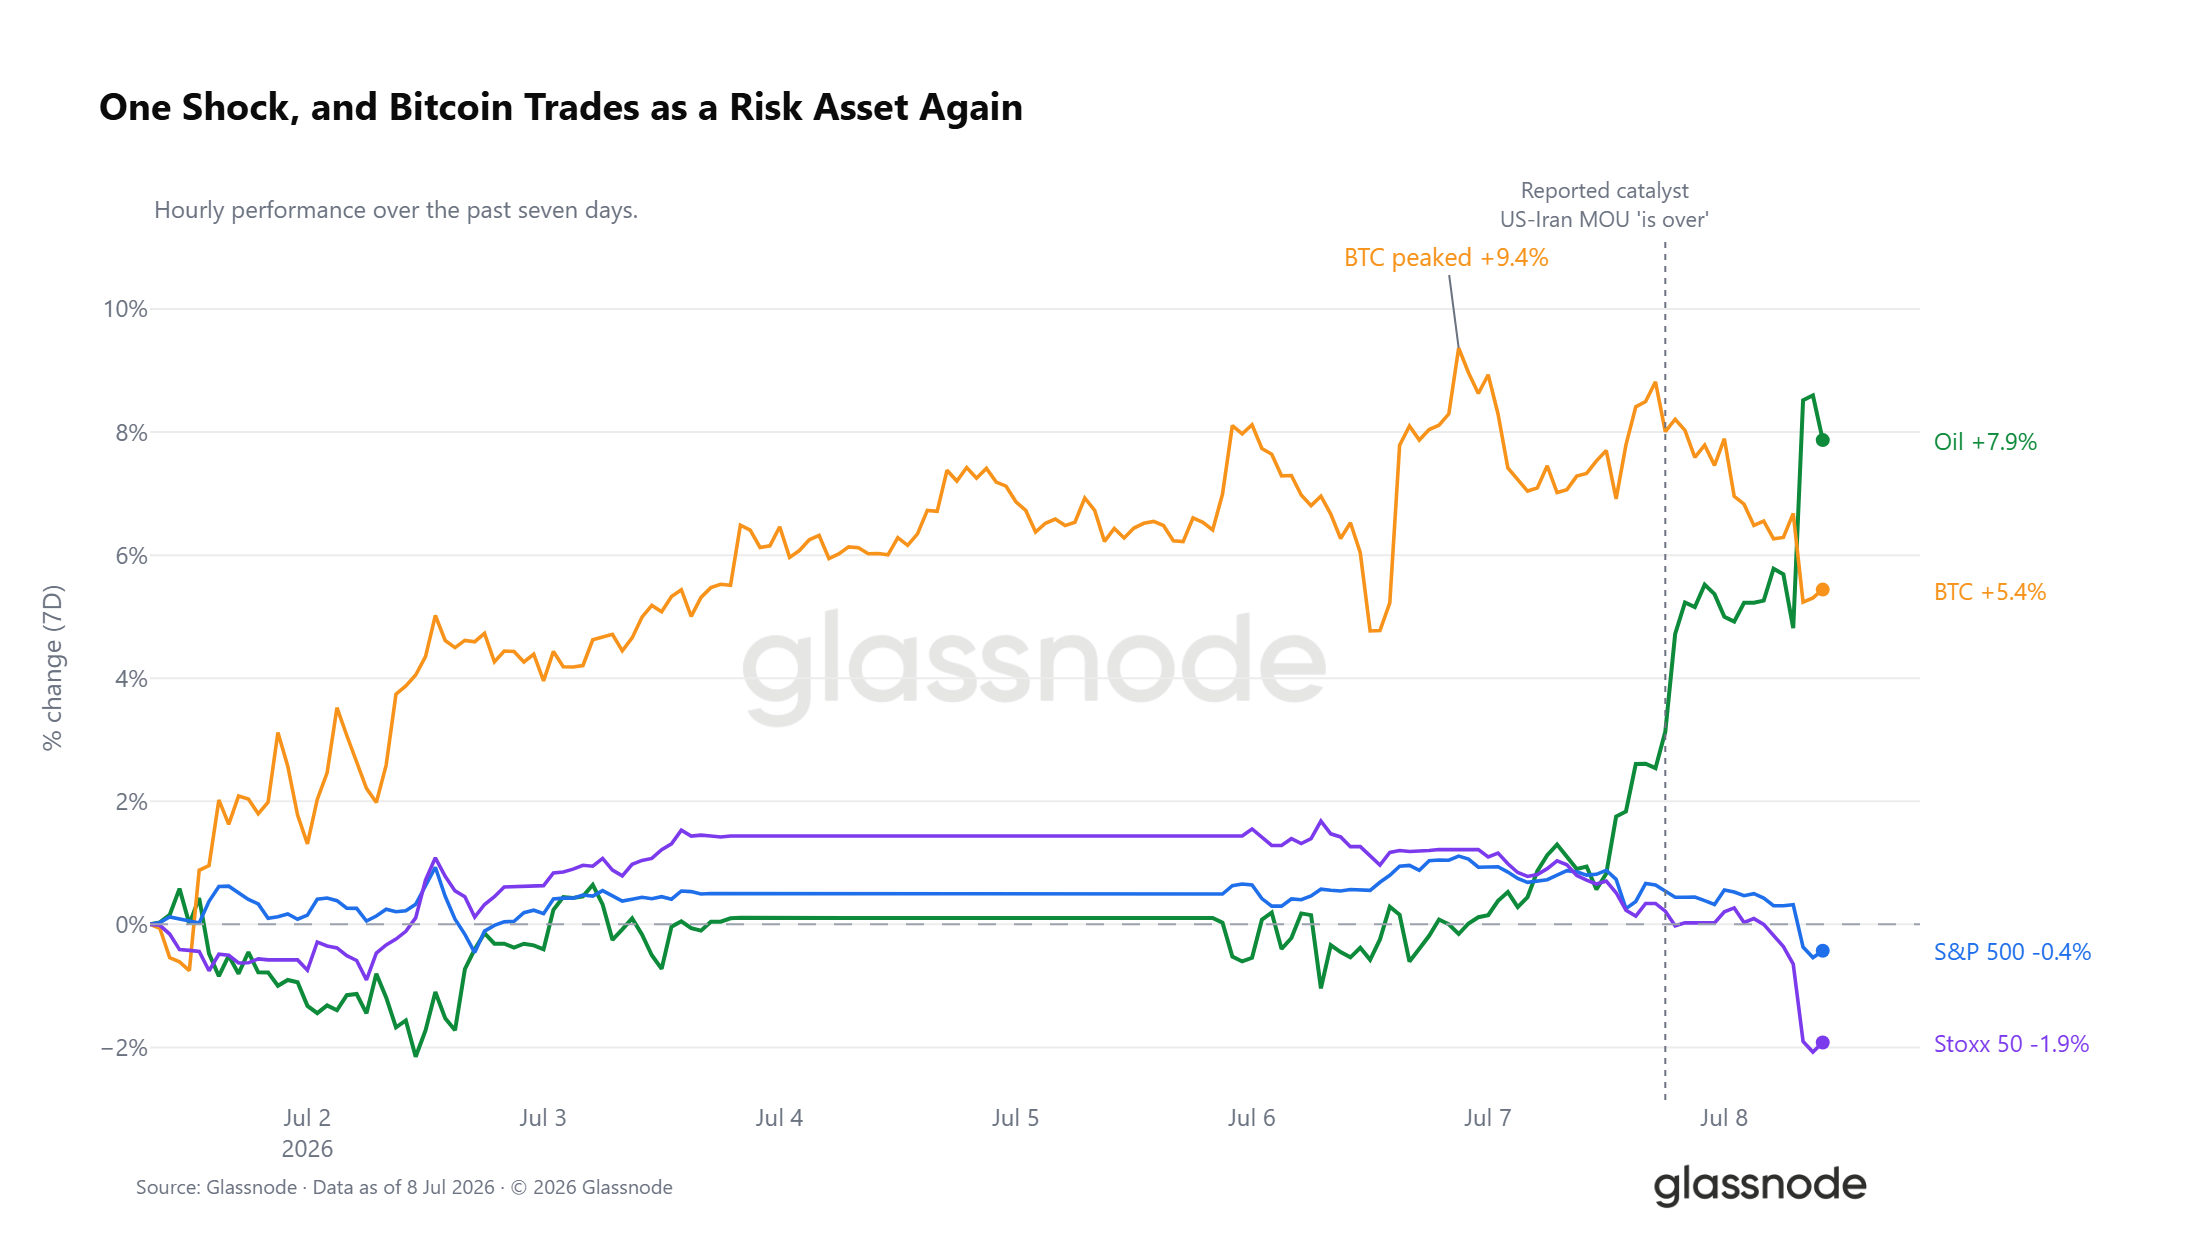
WTI crude has run to up 7.9% over the past seven days, with most of that leg happening in the last few hours after reports that the US-Iran memorandum of understanding had lapsed. The shock flipped the cross-asset tape. Bitcoin, up as much as 9.4% on the week, has rolled back to only a 5% weekly gain, while the S&P and Euro Stoxx both turned negative, the European index leading the move lower. For now, Bitcoin is trading strongly in line with risk assets.
Live Chart

Liquidity Backdrop Conflicted

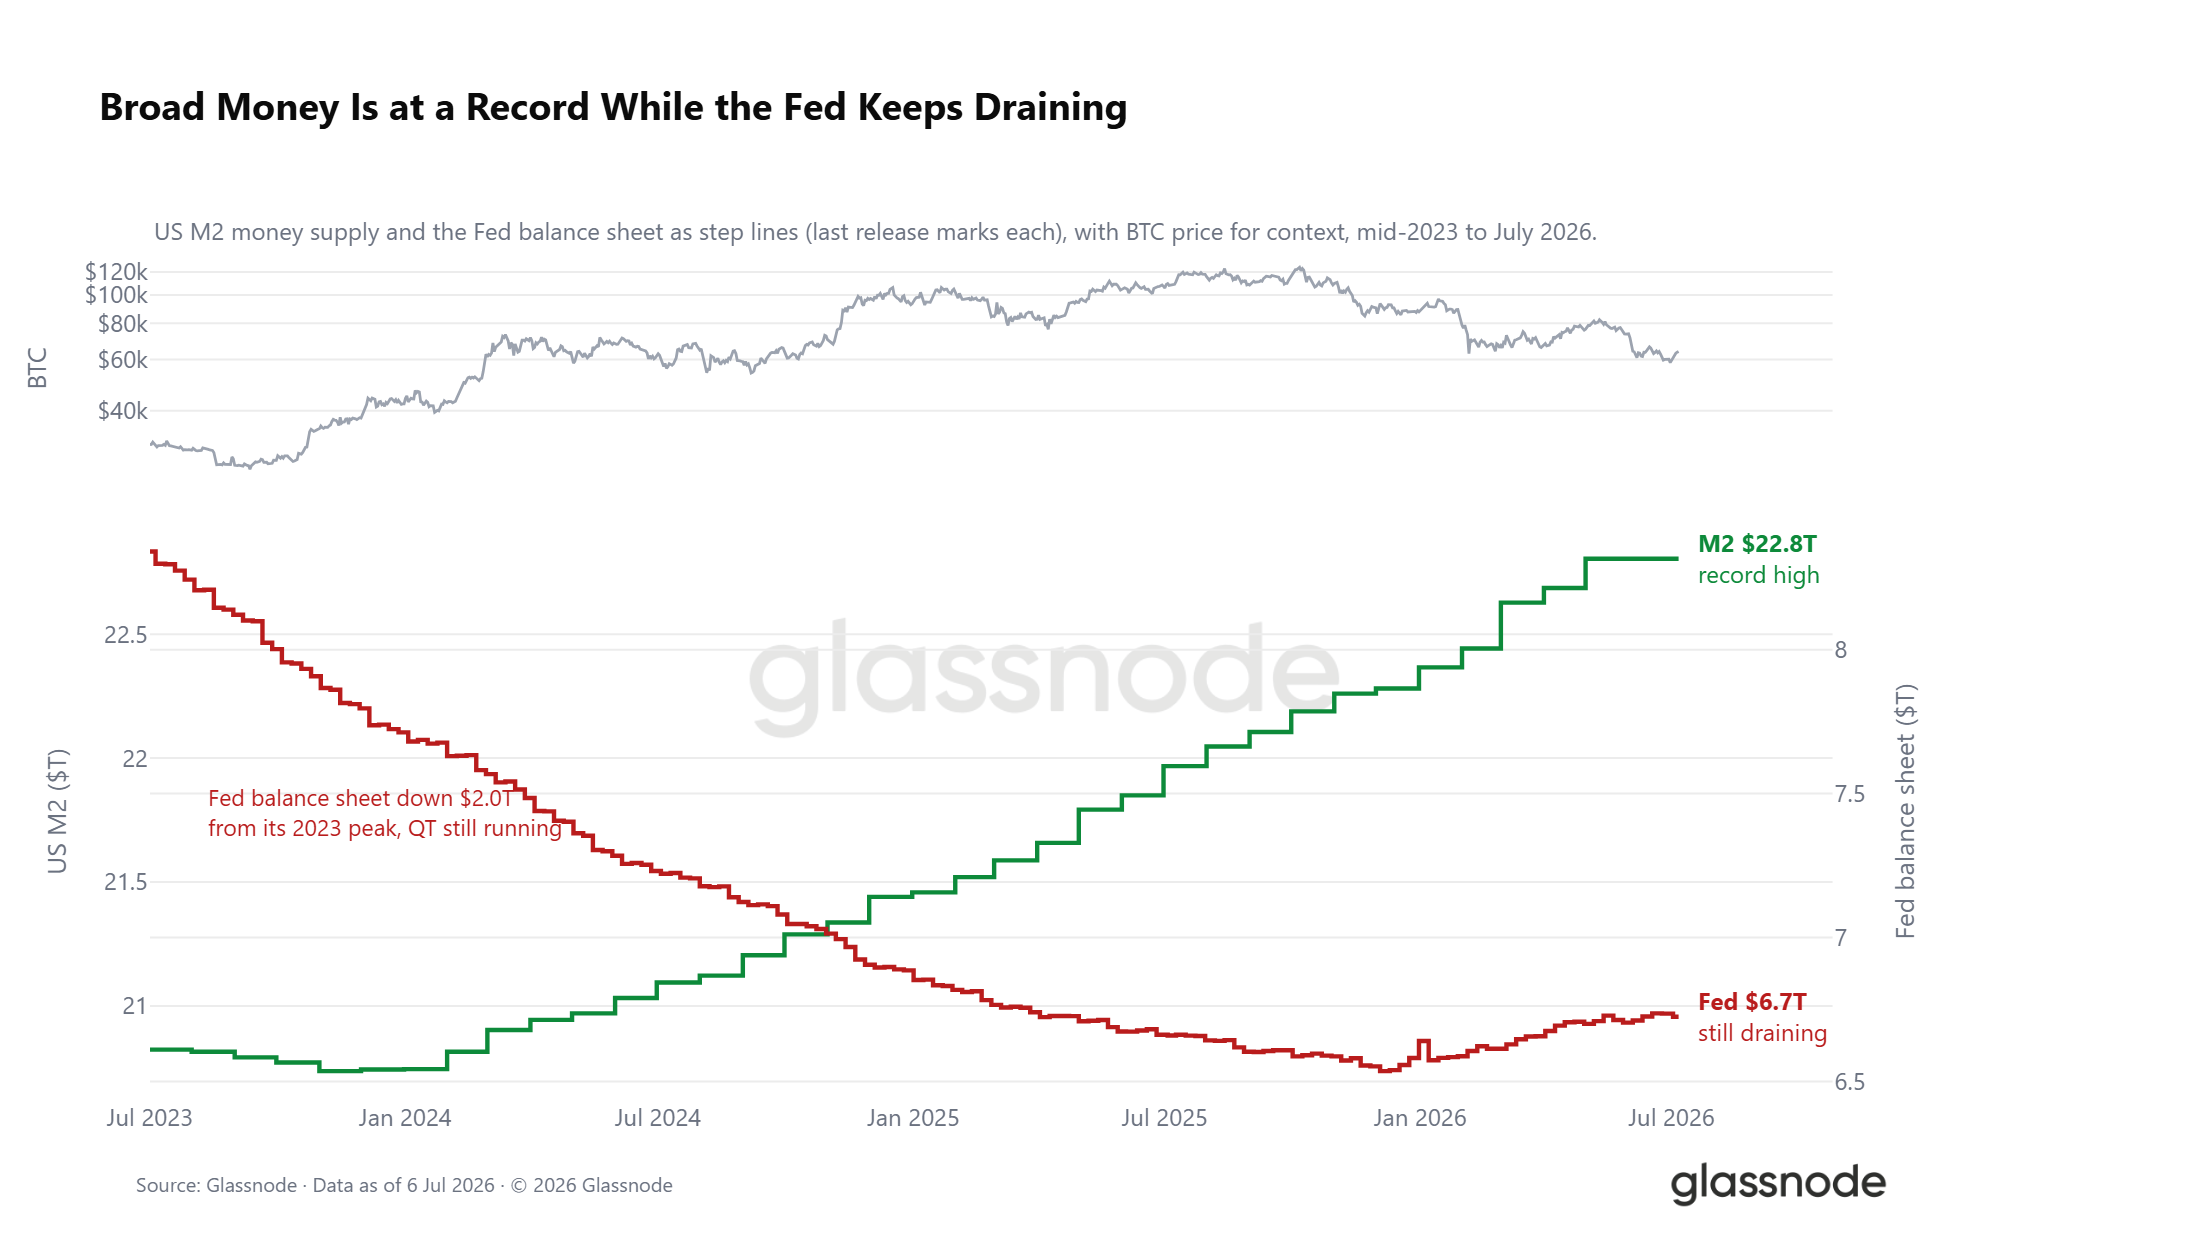
Underneath the shock, the liquidity backdrop is split. US M2 has pushed to a record $22.8 trillion, the slow tide that has historically led risk appetite, yet the Federal Reserve's balance sheet keeps draining, now $2.0 trillion below its 2023 peak. The tension is a rising broad-money base set against an ongoing quantitative drain, with real yields still near 1% keeping the cost of holding a non-yielding asset high. The macro door is not shut, but it is not yet firmly open.
Live Chart

On-chain Insight

Five Months in Deep Value

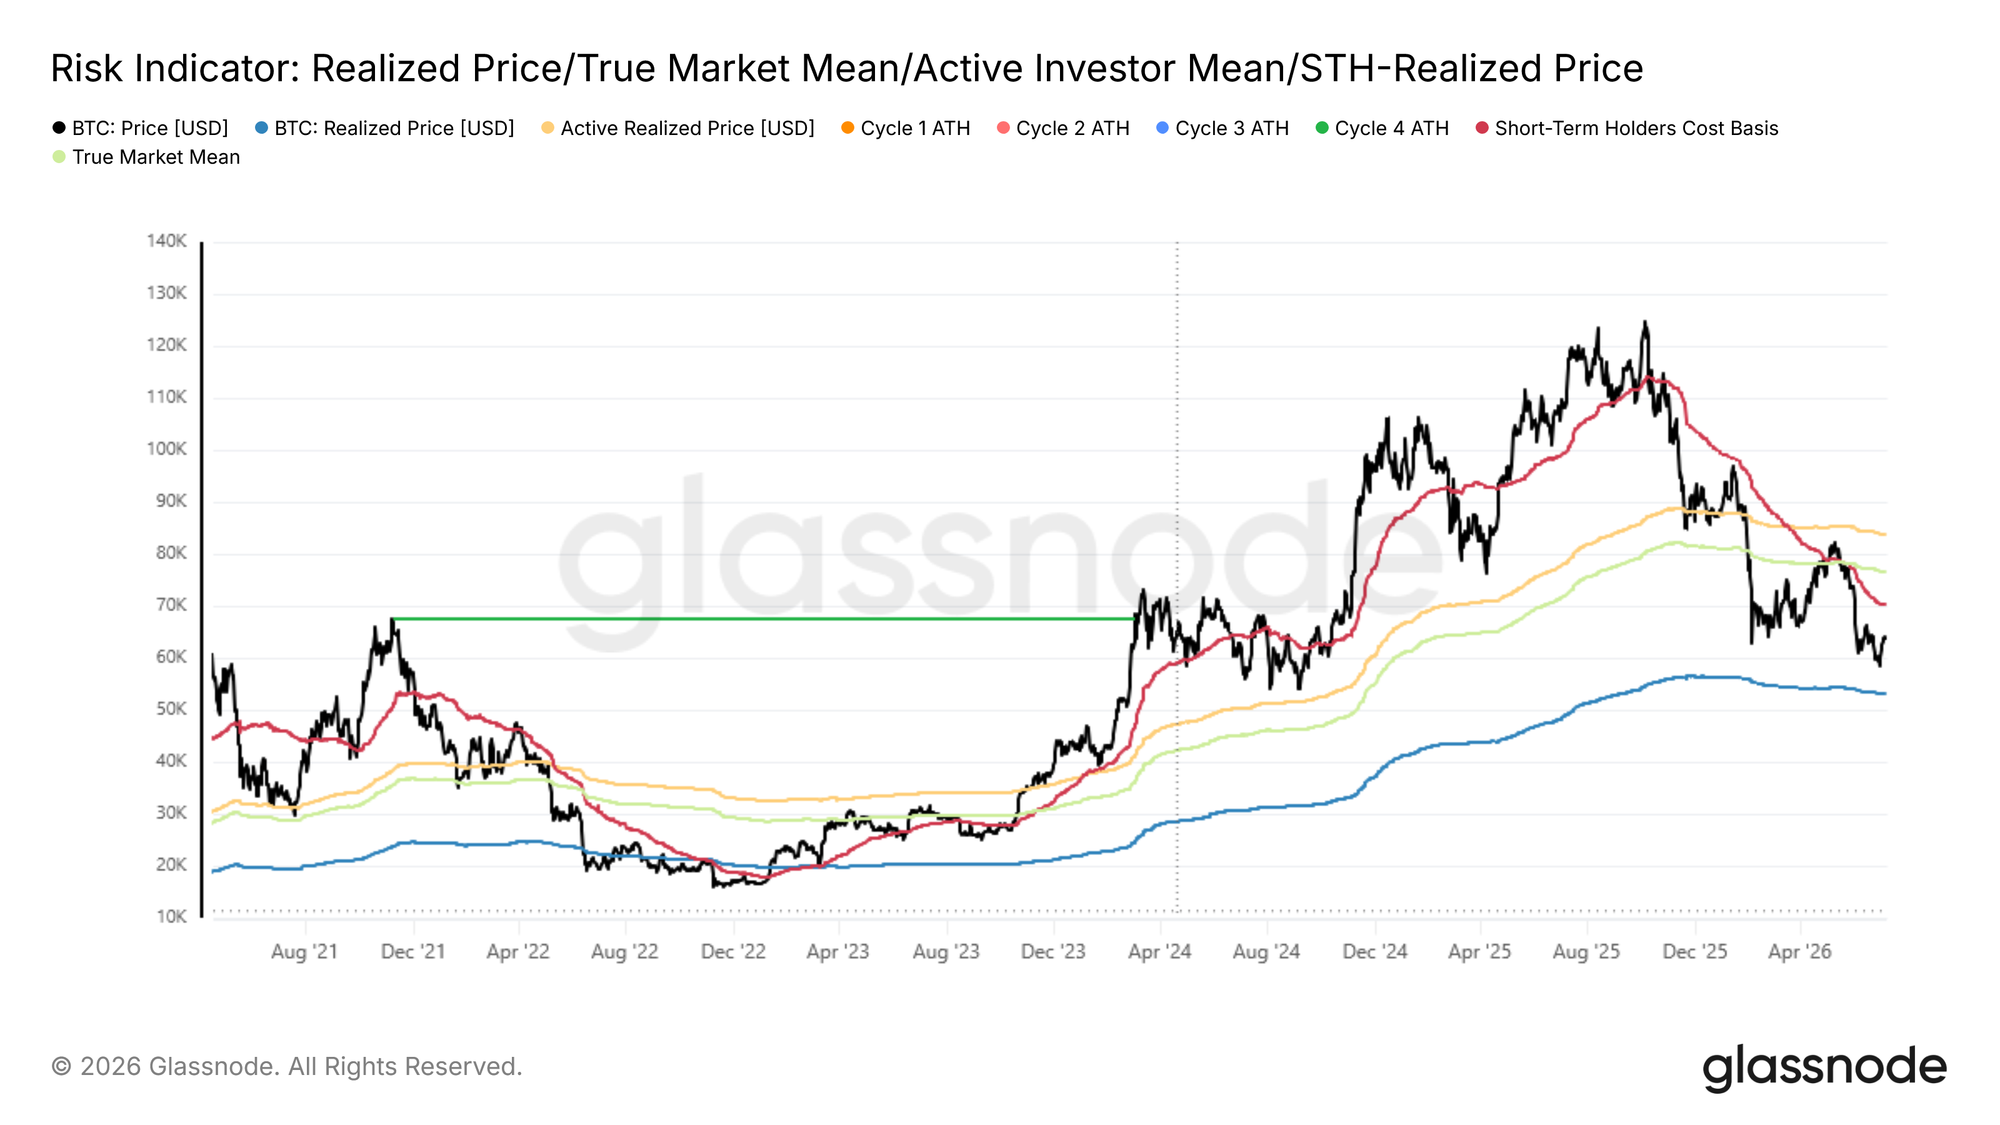
Bitcoin has bounced from $58.3k to $64.4k over the past week, a constructive near-term development but one that leaves price firmly below both the True Market Mean at $76.6k and the Short-Term Holder Cost Basis at $72.2k. Until these levels are reclaimed, the market remains in deep value territory and structurally vulnerable to any external negative catalyst. However, the duration of this discount phase deserves attention.

Since early February 2026, price has traded below both the active investor cost basis and the recent buyer breakeven level for approximately five months, making this one of the more extended deep value episodes in Bitcoin's history. Prolonged accumulation at such a discount, where new capital is consistently deployed below the cost basis of both recent buyers and the broader active market, has conventionally served as the foundation for cyclical bottoms and represents an attractive zone for value-oriented investors. While the evidence suggests this process is approaching its later stages, the lower band of the bear market range near the Realized Price at $53k remains a possibility that cannot be dismissed.
Live Chart

Top Buyers Driving the Sell Pressure

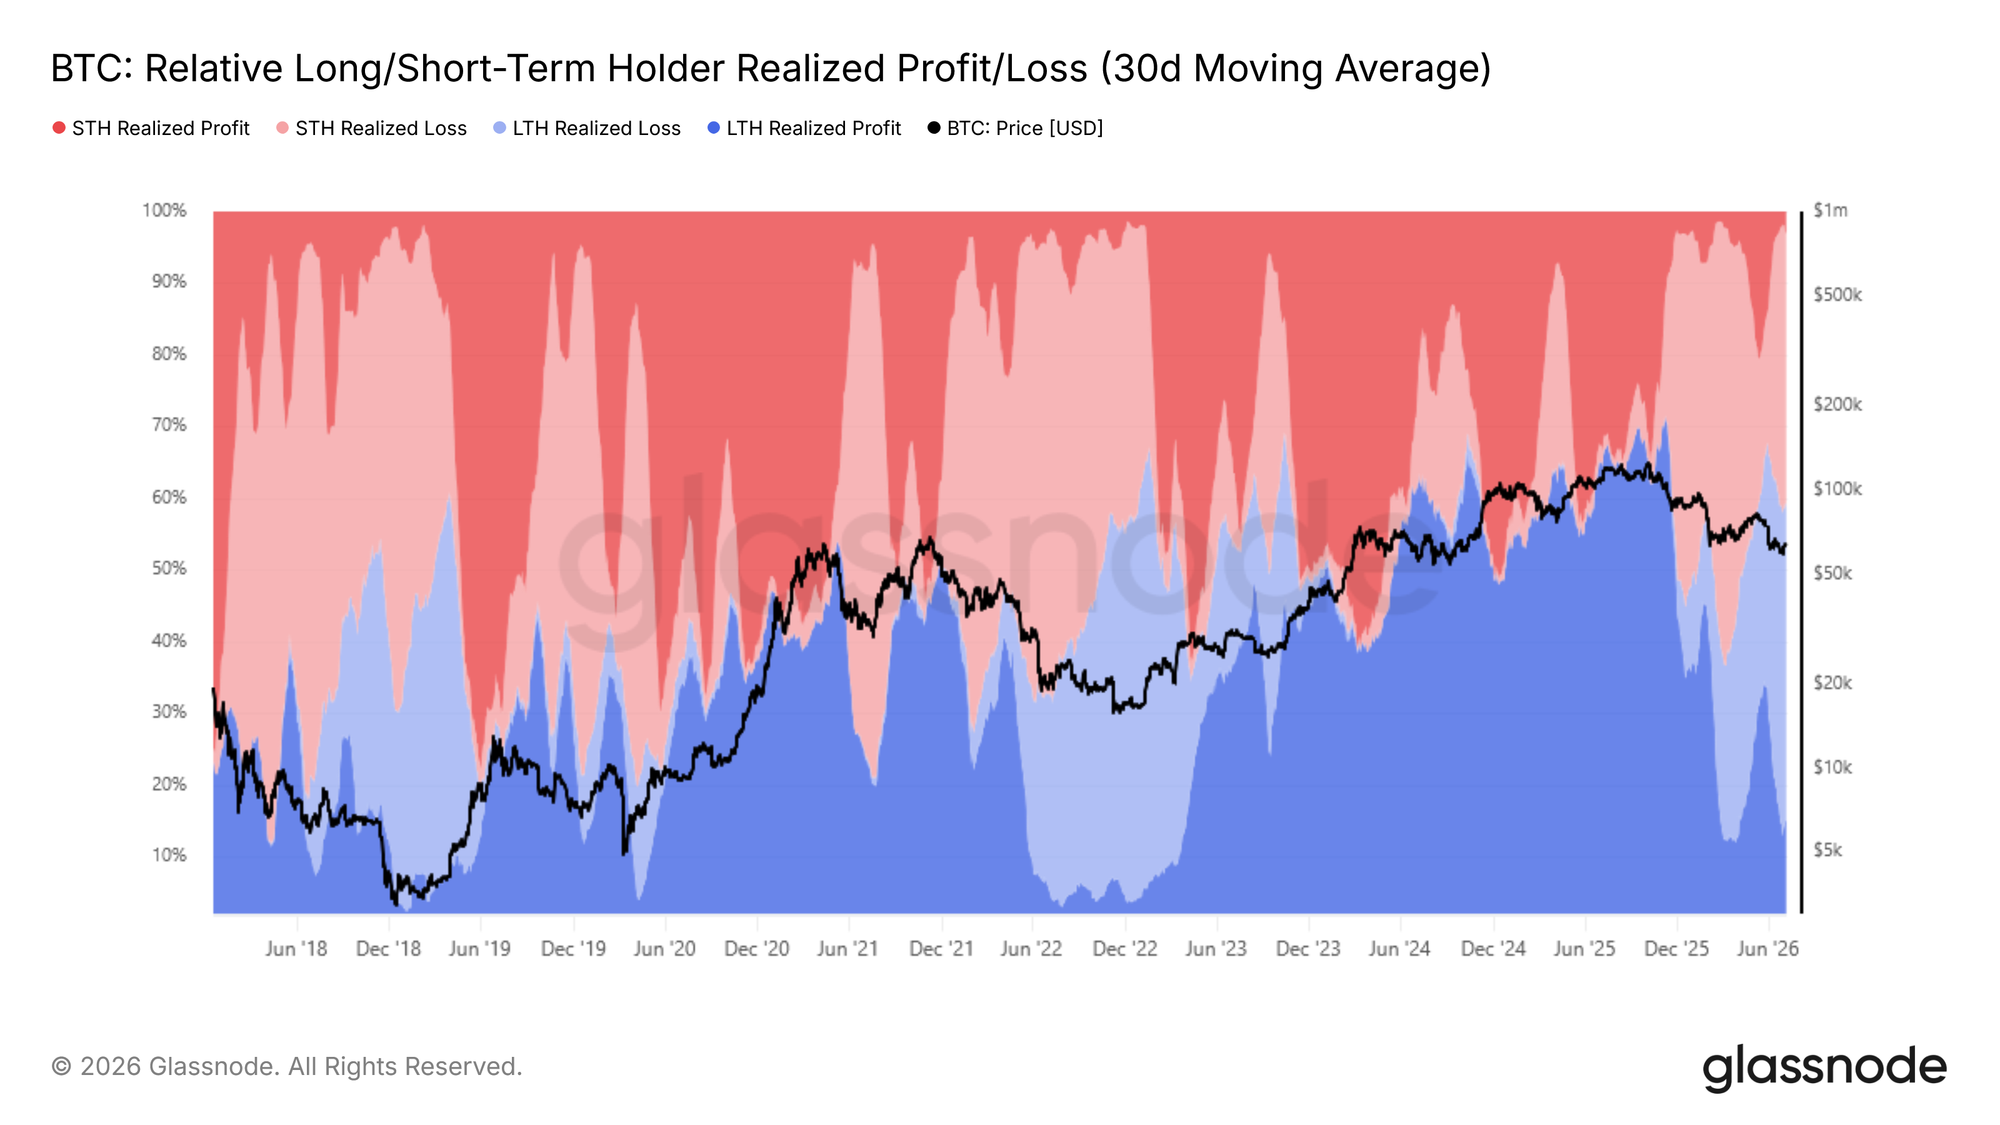
With the market potentially hammering a cyclical bottom, identifying the dominant source of downward pressure becomes the central question. The Relative Long/Short-Term Holder Realized Profit and Loss tracks the distribution of total realized value across long and short-term holder cohorts, capturing each group's share of aggregate profit and loss crystallized on-chain.

As price slipped below the True Market Mean, the share of total realized value attributed to long-term holder loss realization (30D-SMA) has grown from 15% in early February 2026 to 43% currently, making this cohort's frustration-driven capitulation the single largest force weighing on price. These are investors who acquired near the cycle top and have now held through months of drawdown, increasingly choosing to exit as the bear market stretches beyond their conviction threshold. This dynamic directly explains why price has struggled to reclaim the upper band of the current range, as each attempted recovery is met with a fresh wave of distribution from this underwater cohort.
Live Chart

Capitulation Not Yet Cooling

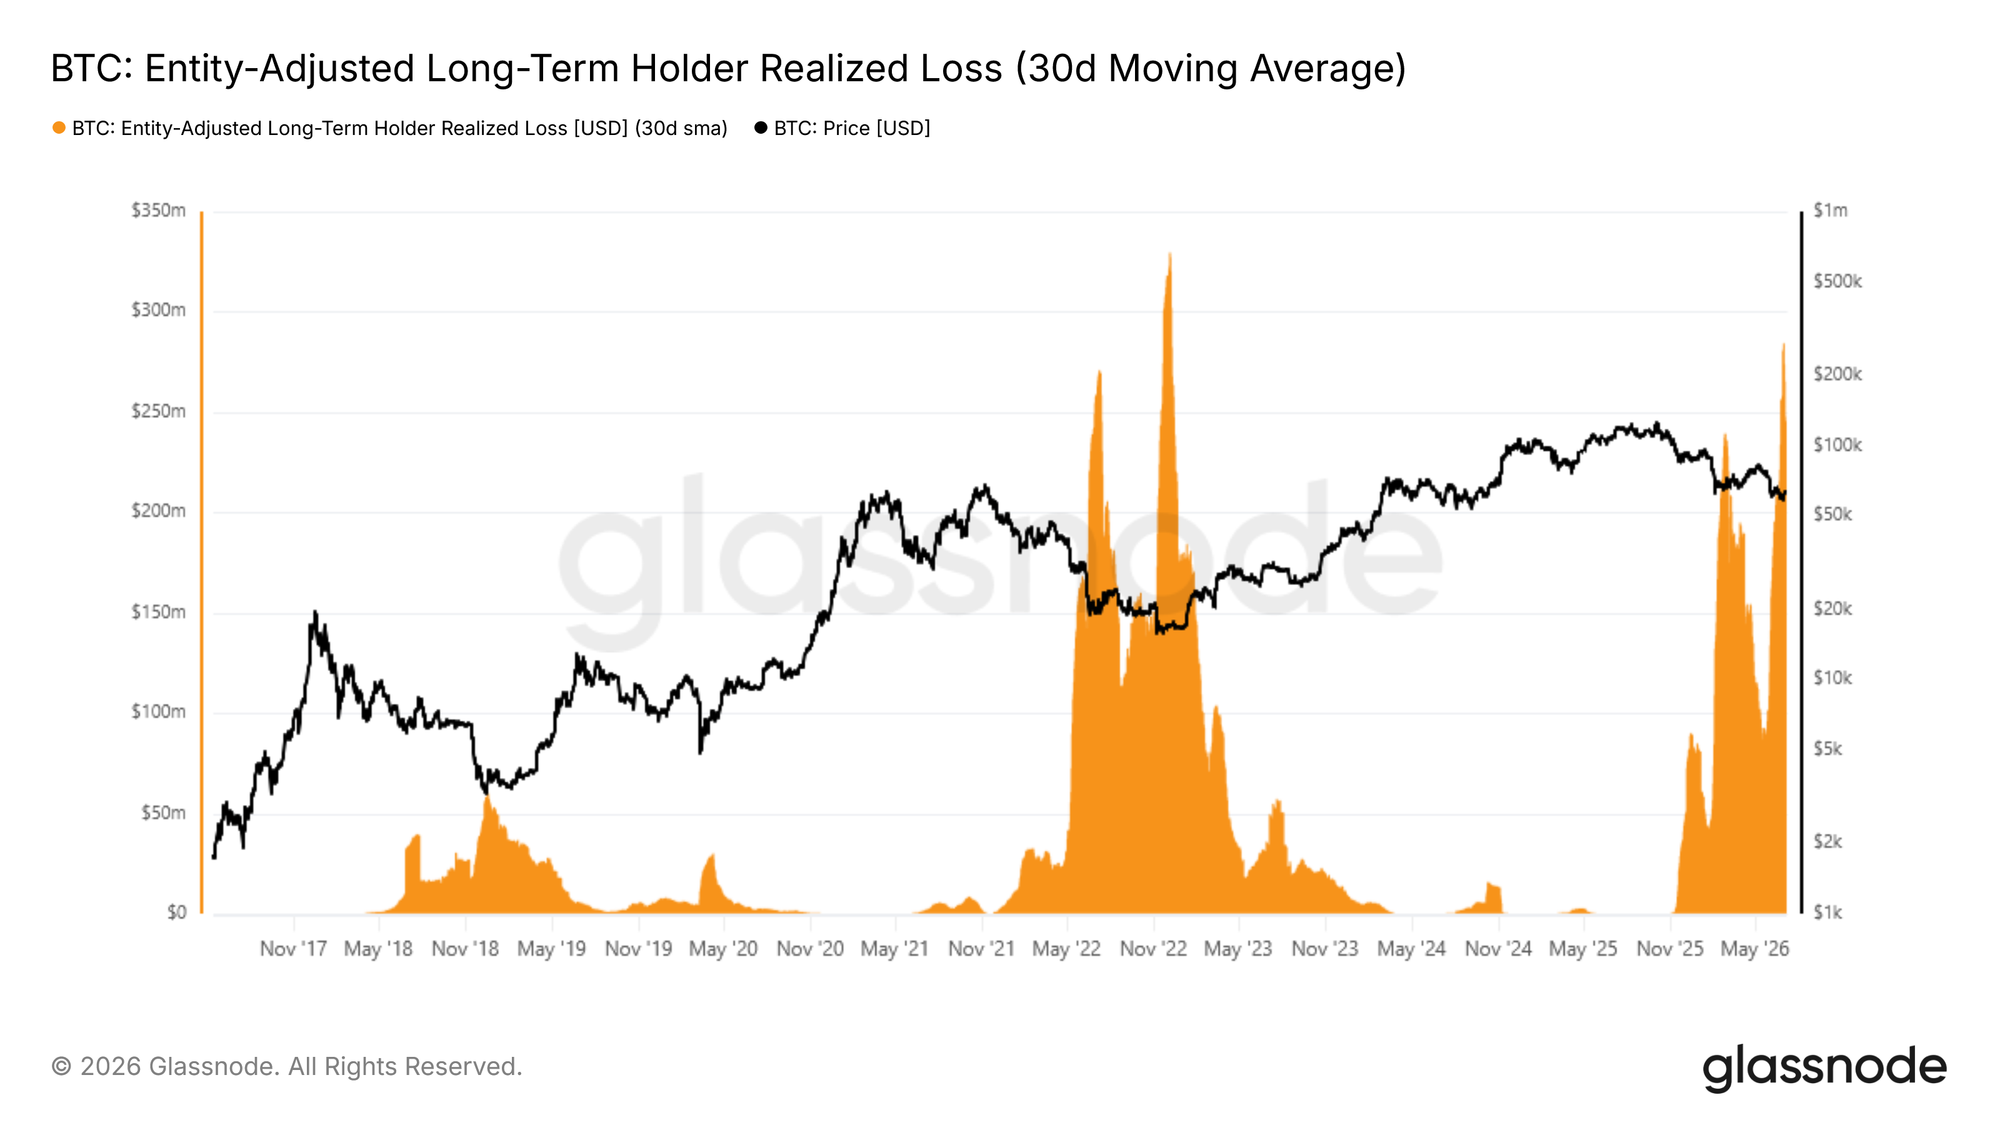
With long-term holder loss realization now the dominant downward force in the market, the next step is to gauge whether this pressure is beginning to subside. The Entity-Adjusted Long-Term Holder Realized Loss, smoothed by a 30-day SMA, measures the dollar value of losses crystallized by holders who acquired their coins more than 155 days ago, filtering out internal transfers to capture genuine capitulation activity.

This indicator recently printed a new peak at approximately $280M per day, the highest reading since December 2022, marking the second major spike in long-term holder sell pressure during this bear cycle. Critically, unlike the first spike which was followed by a partial cooldown, the current wave has not yet contracted to lower levels. Until this metric compresses meaningfully, the path toward a credible transition back to bull market conditions remains obstructed. In the coming weeks to months, the trajectory of this indicator will be among the most important signals for determining whether the market is approaching genuine sell-side exhaustion.
Live Chart

Off-chain Insight

ETF Outflows Easing, Not Resolved

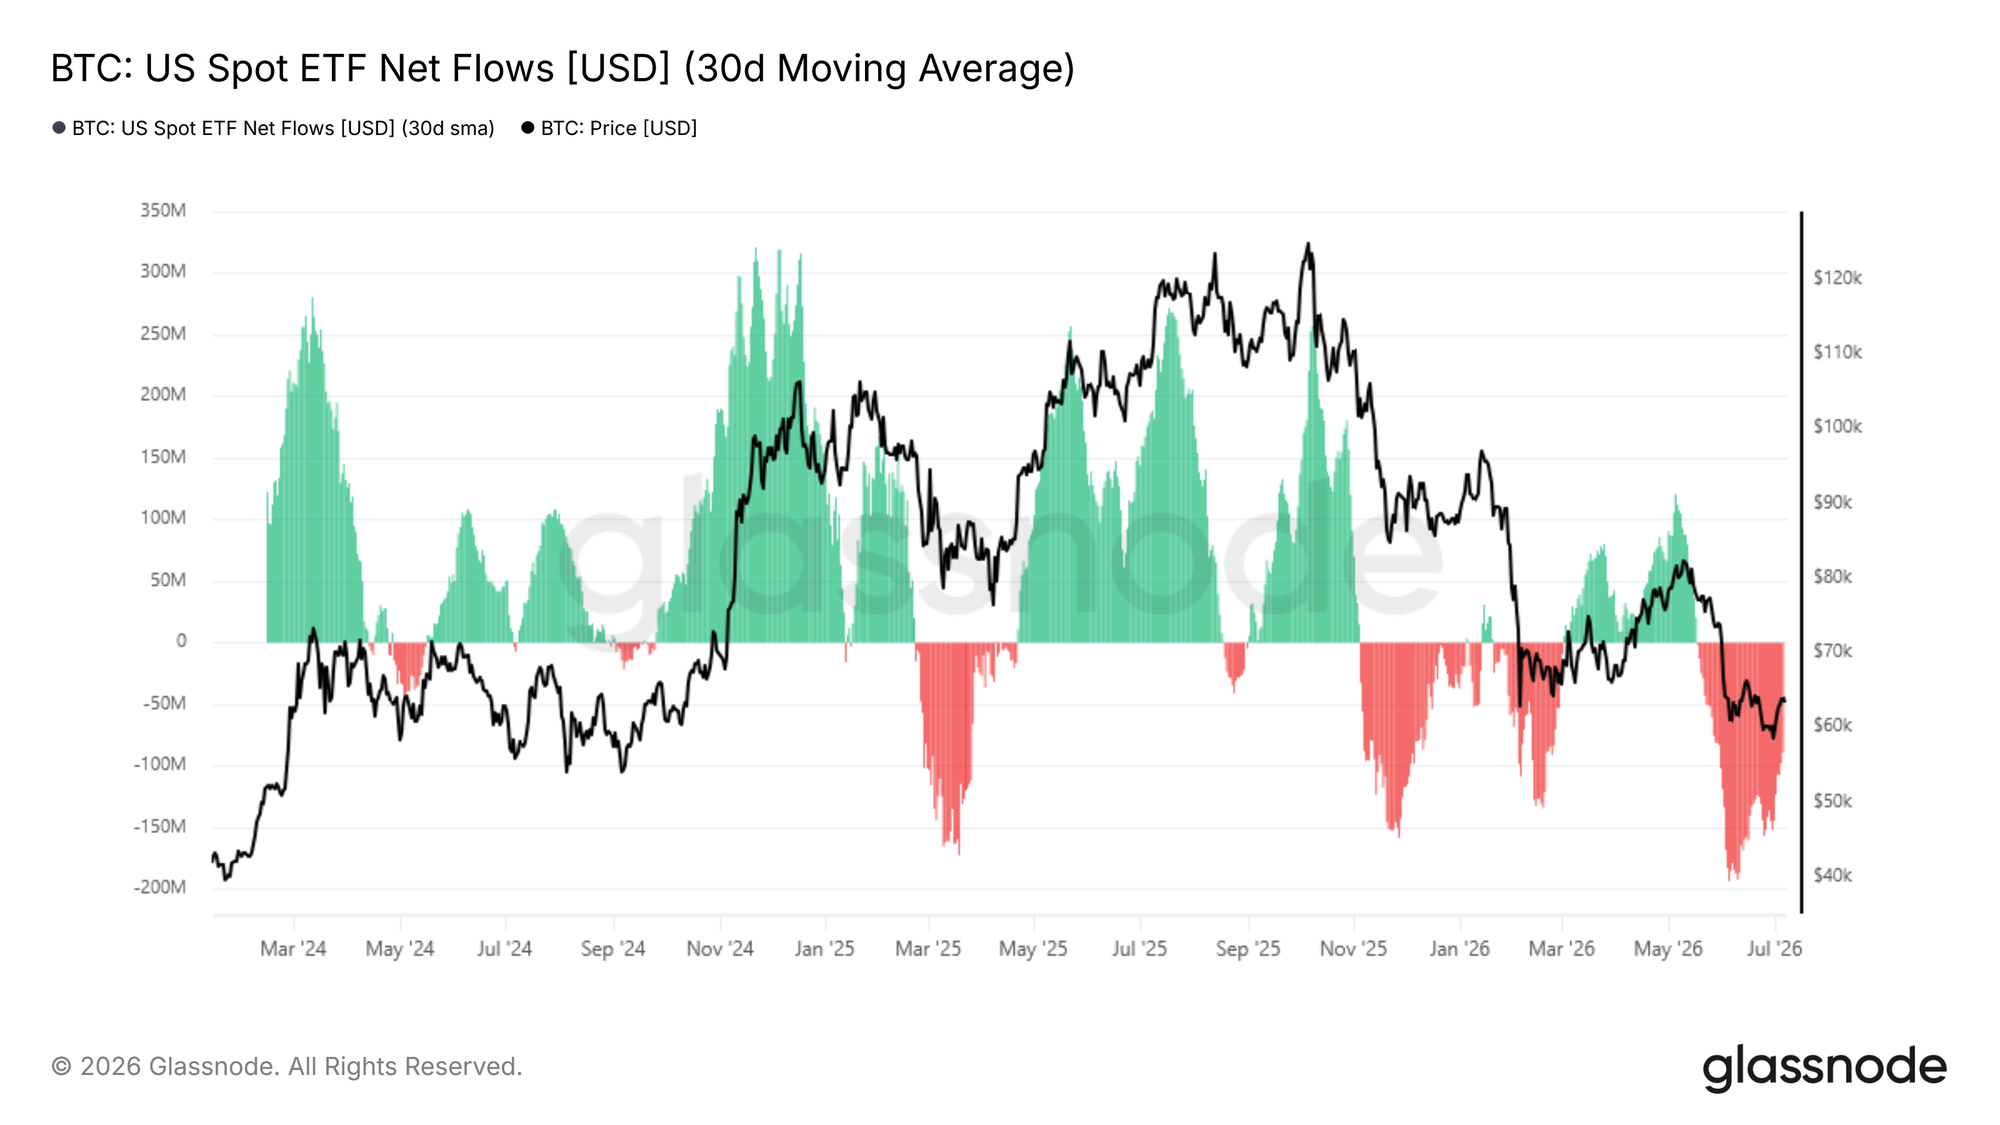
Shifting from the on-chain dimension to off-chain market dynamics, the behavior of ETF investors provides a complementary lens on institutional demand. The 30-day SMA of ETF Netflow captures the smoothed daily net capital entering or leaving US spot Bitcoin ETFs, filtering out single-day volatility to reveal the underlying trend in institutional positioning.

Since mid-May 2026, this indicator shifted into a net monthly outflow regime, peaking at -$193M per day in early June before cooling to -$88.9M per day currently. While the deceleration in outflow pace is a tentative positive, the market remains in a net bleeding state on a monthly basis, confirming that institutional demand has not yet stabilized. Further compression toward neutral levels would be a necessary precondition before any speculation about a potential expansion in the near term can be supported by this data layer.
Live Chart

Institutional Volume Still Muted

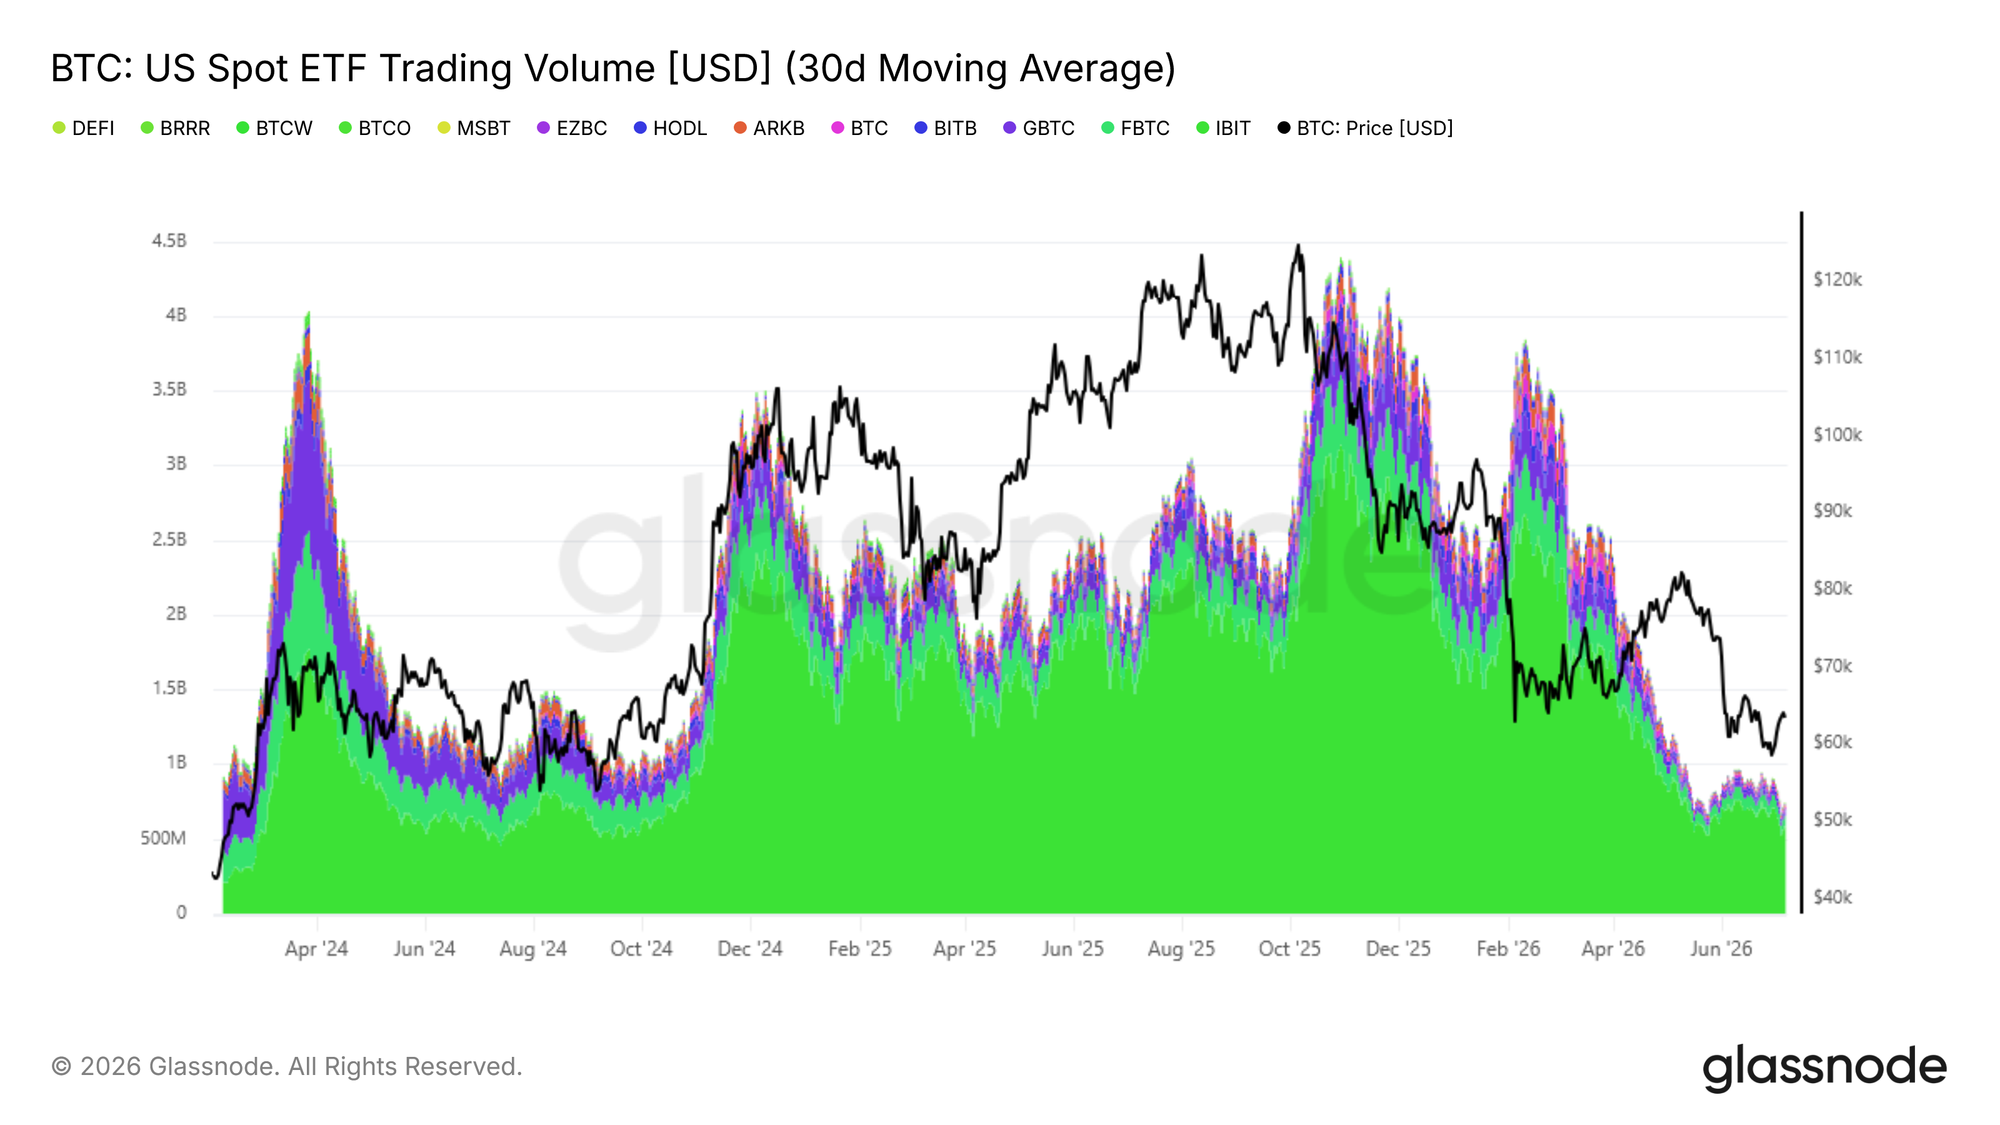
Alongside net flows, the US Spot ETF Trading Volume provides a complementary read on whether institutional confidence is recovering. The 30-day SMA of daily ETF trading volume has been ranging between $650M and $950M per day, a level comparable to the Q4 2024 environment and the same time ~80% below the $4.4B per day peak recorded in October 2025.

While the current volume range reflects baseline institutional participation, it remains deeply muted relative to bull market peaks, indicating that conviction among ETF investors has not meaningfully returned. A sustained expansion in daily trading volume alongside a compression of net outflows would together constitute the minimum conditions for confirming a revival in institutional demand. Until both signals emerge in tandem, the off-chain data continues to reinforce the broader bearish regime identified through on-chain metrics.
Live Chart

Derivatives Short Appetite Satiated

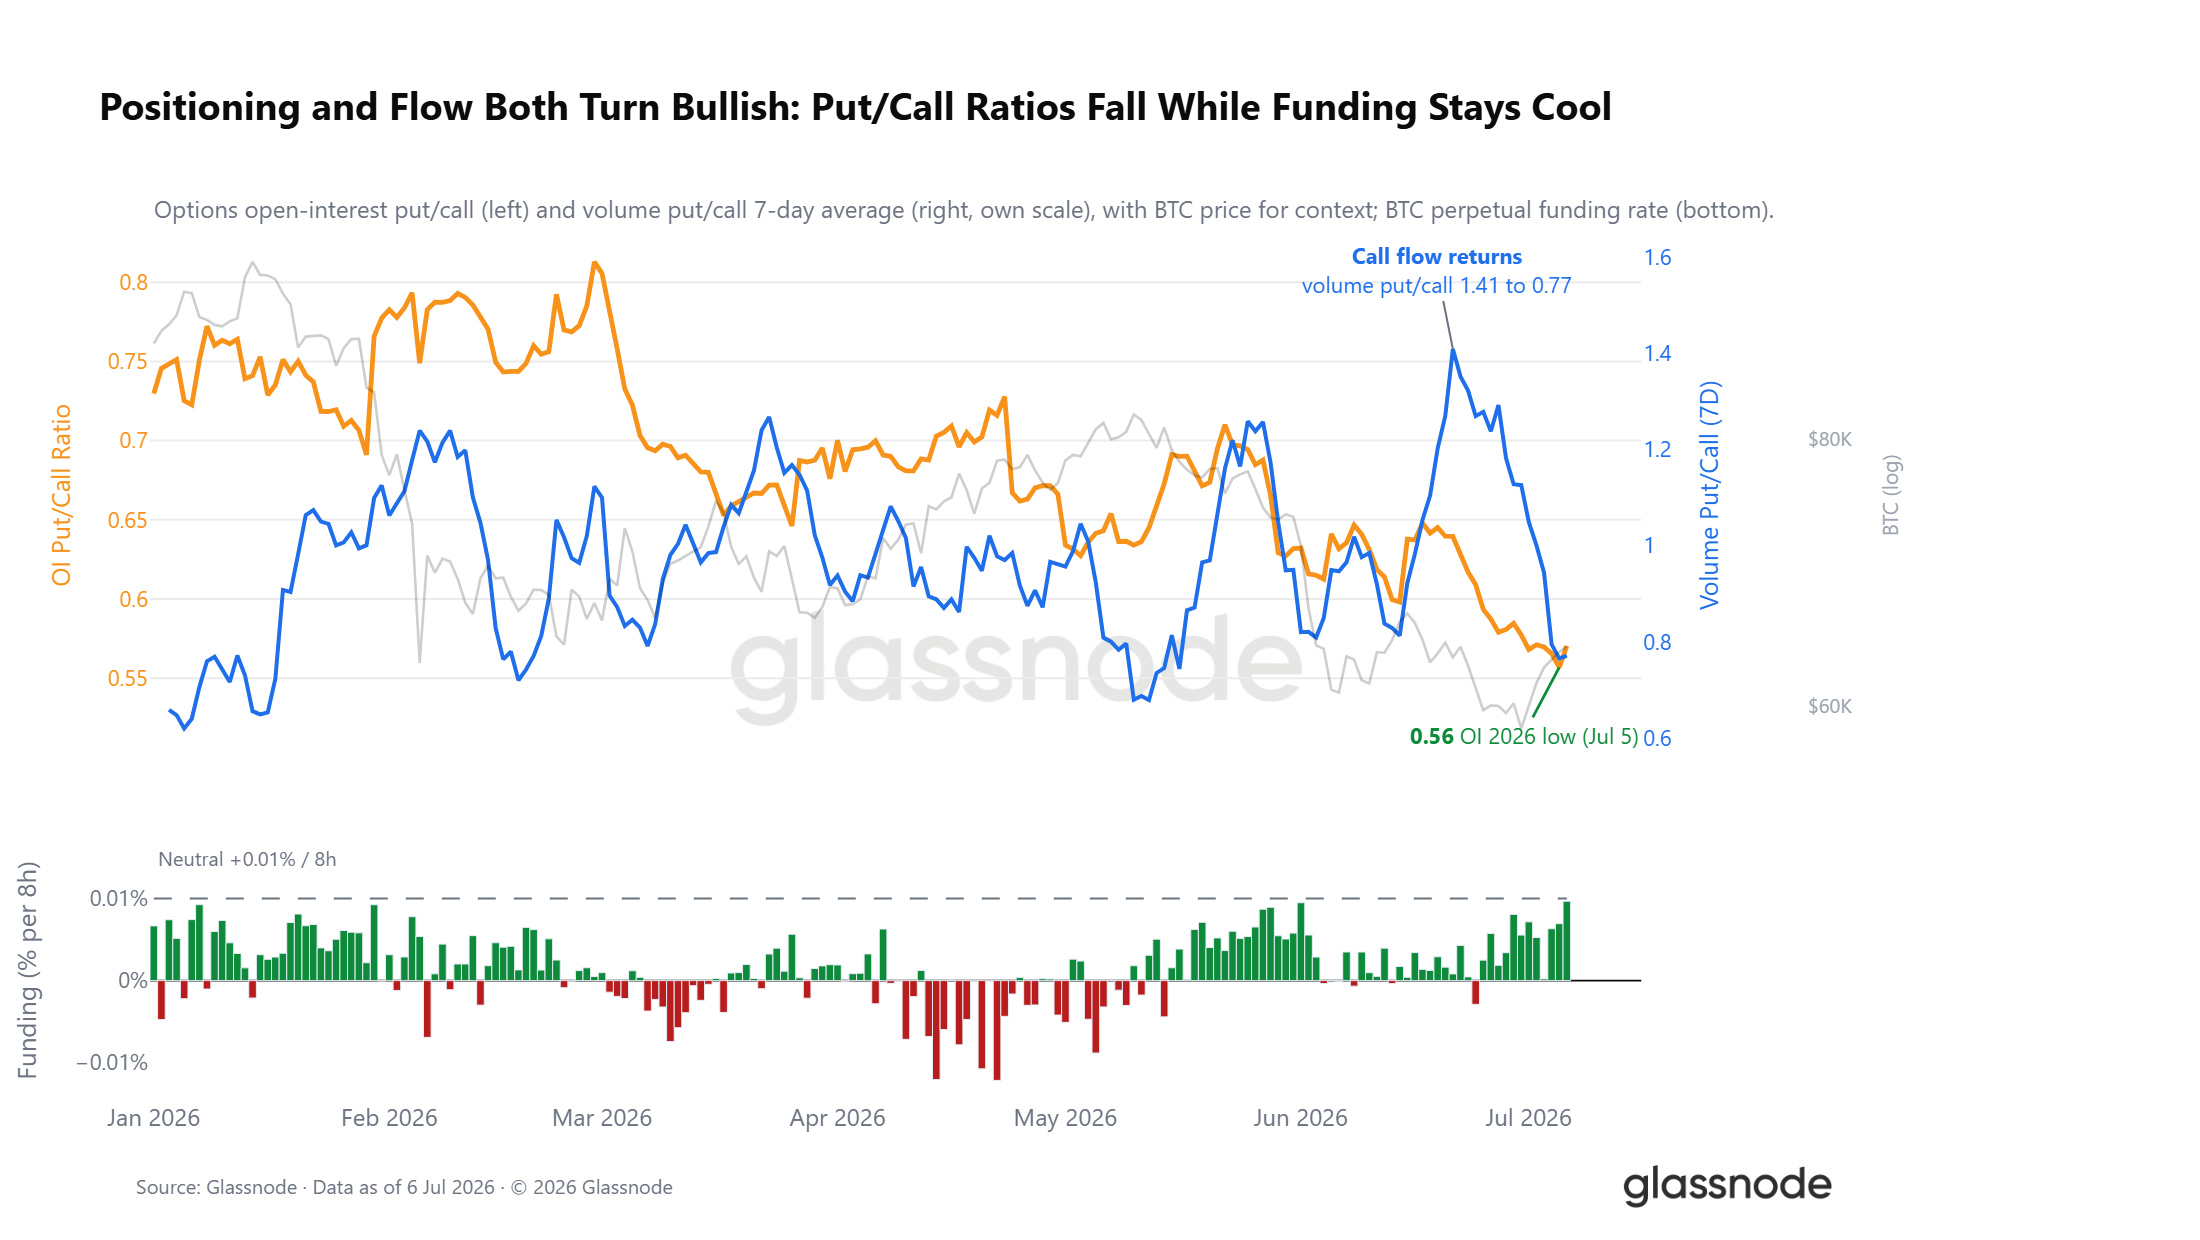
Beneath the risk-off tape, the derivatives book is beginning to position the other way. The options open-interest put/call ratio has fallen to 0.56, its lowest reading of 2026, leaving the market holding roughly two calls for every put. The flow tells the same story faster. As Bitcoin retested its lows two weeks ago, the volume put/call ratio spiked heavily as traders paid up for downside, and it has since collapsed as call flow returned, even as spot has clawed back only part of its selloff.

Perps confirm the tilt. Perpetual funding has averaged well below the 0.01% exchange-neutral line and a fraction of the levels that mark crowded longs. This is a book that has de-risked and leaned cautiously long into the shock, the opposite of the positioning that usually precedes a flush.
Live Chart

The Surface Still Prices Downside

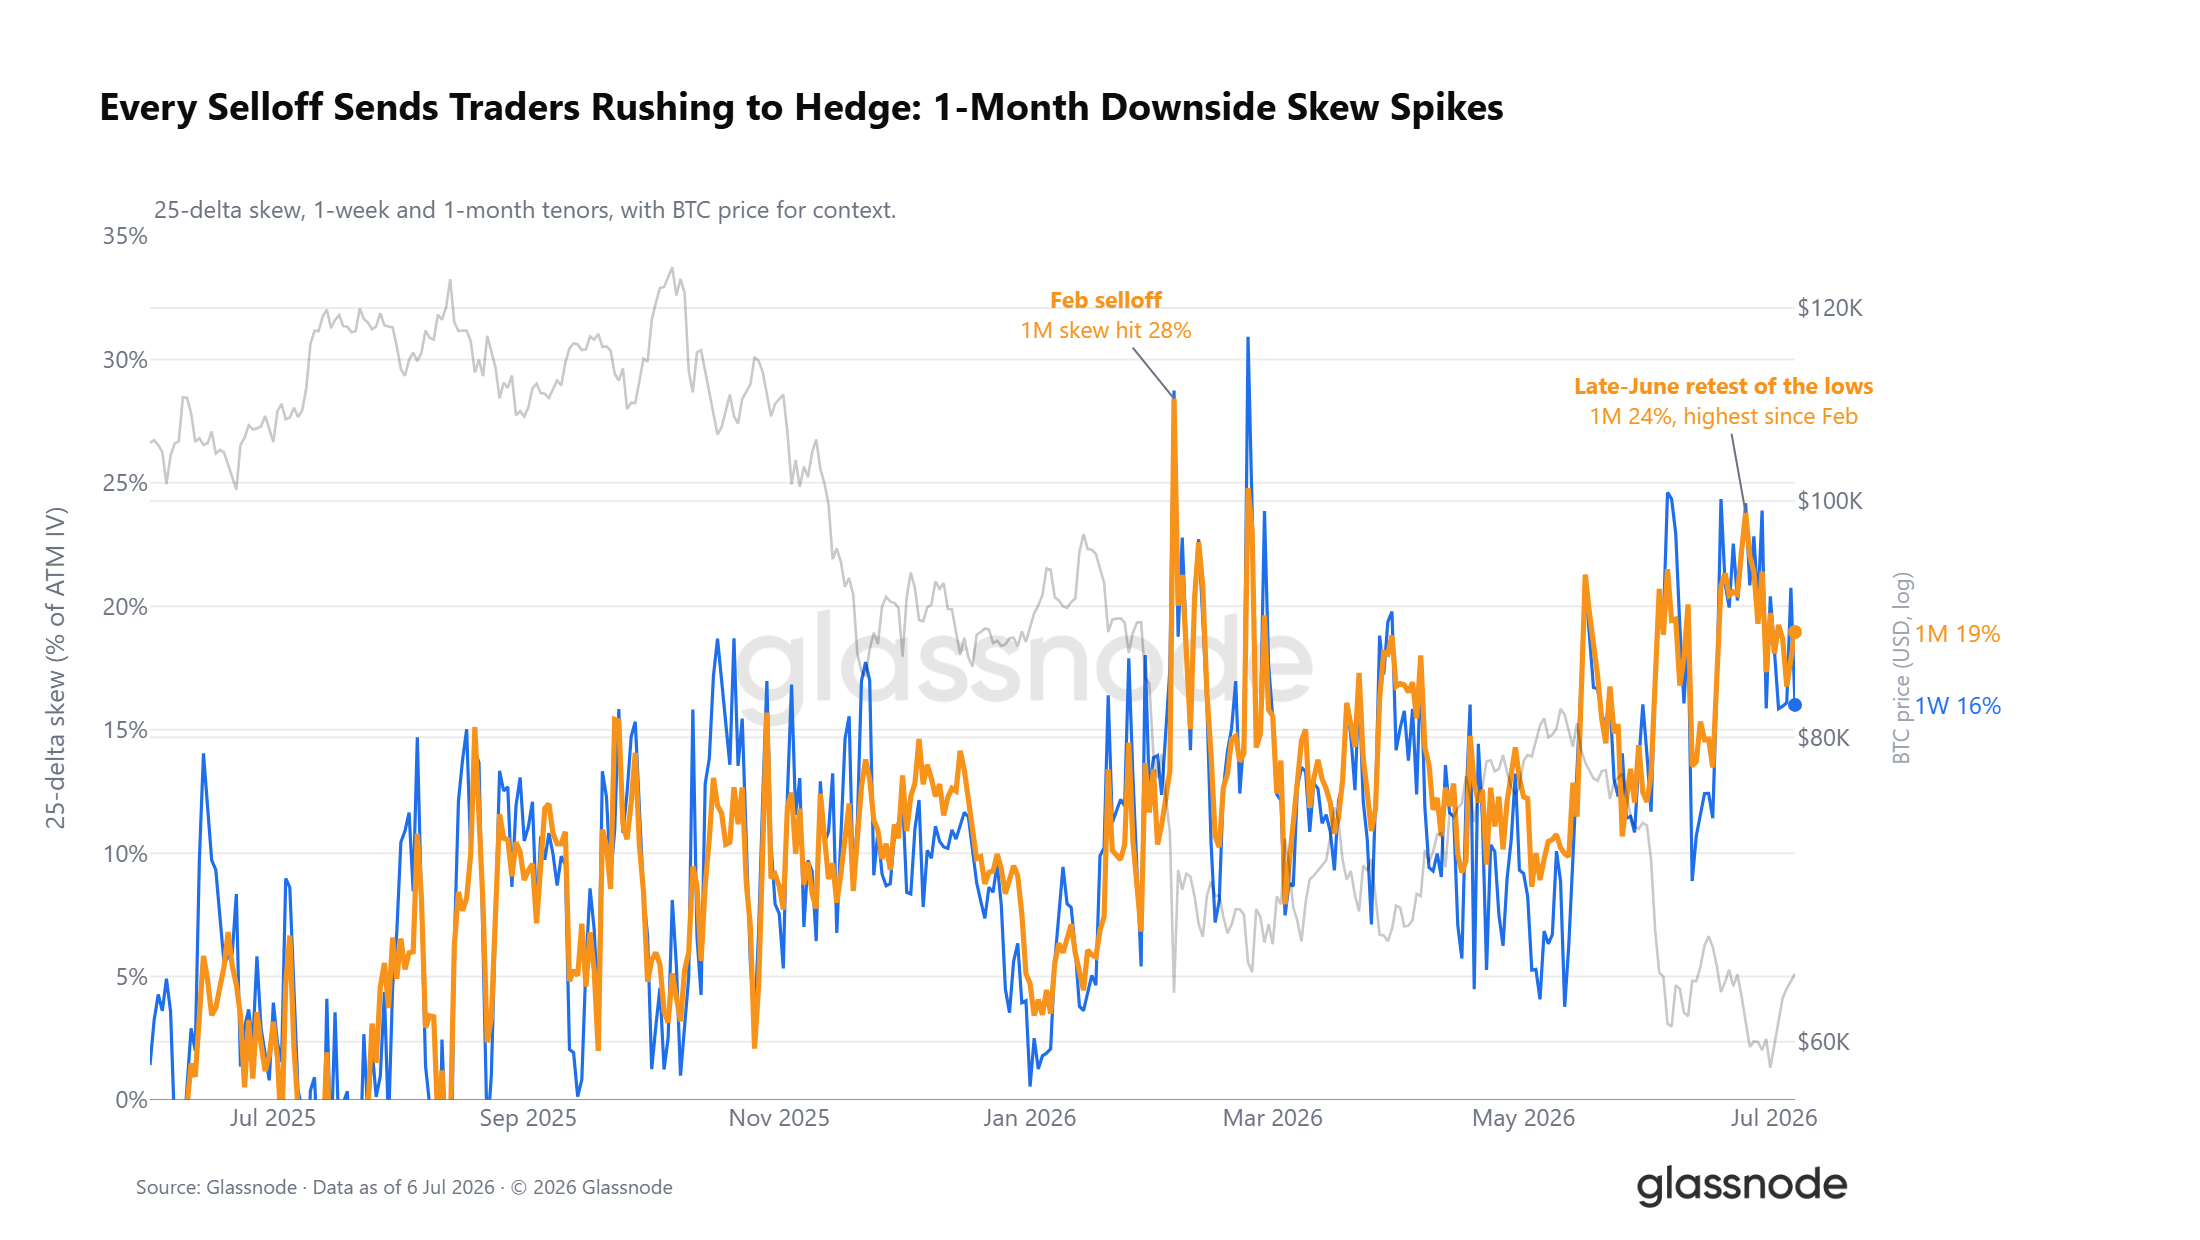
The options surface somewhat disagrees with the positioning. The 25-delta skew, the premium of downside protection over upside, is bid across every tenor. Every selloff since the winter has re-bid it, and late June's spike to 24% was the most defensive the front end has been since the February selloff. Traders are still paying up to hedge each dip, even as the book leans long.
Live Chart

Below the Pin

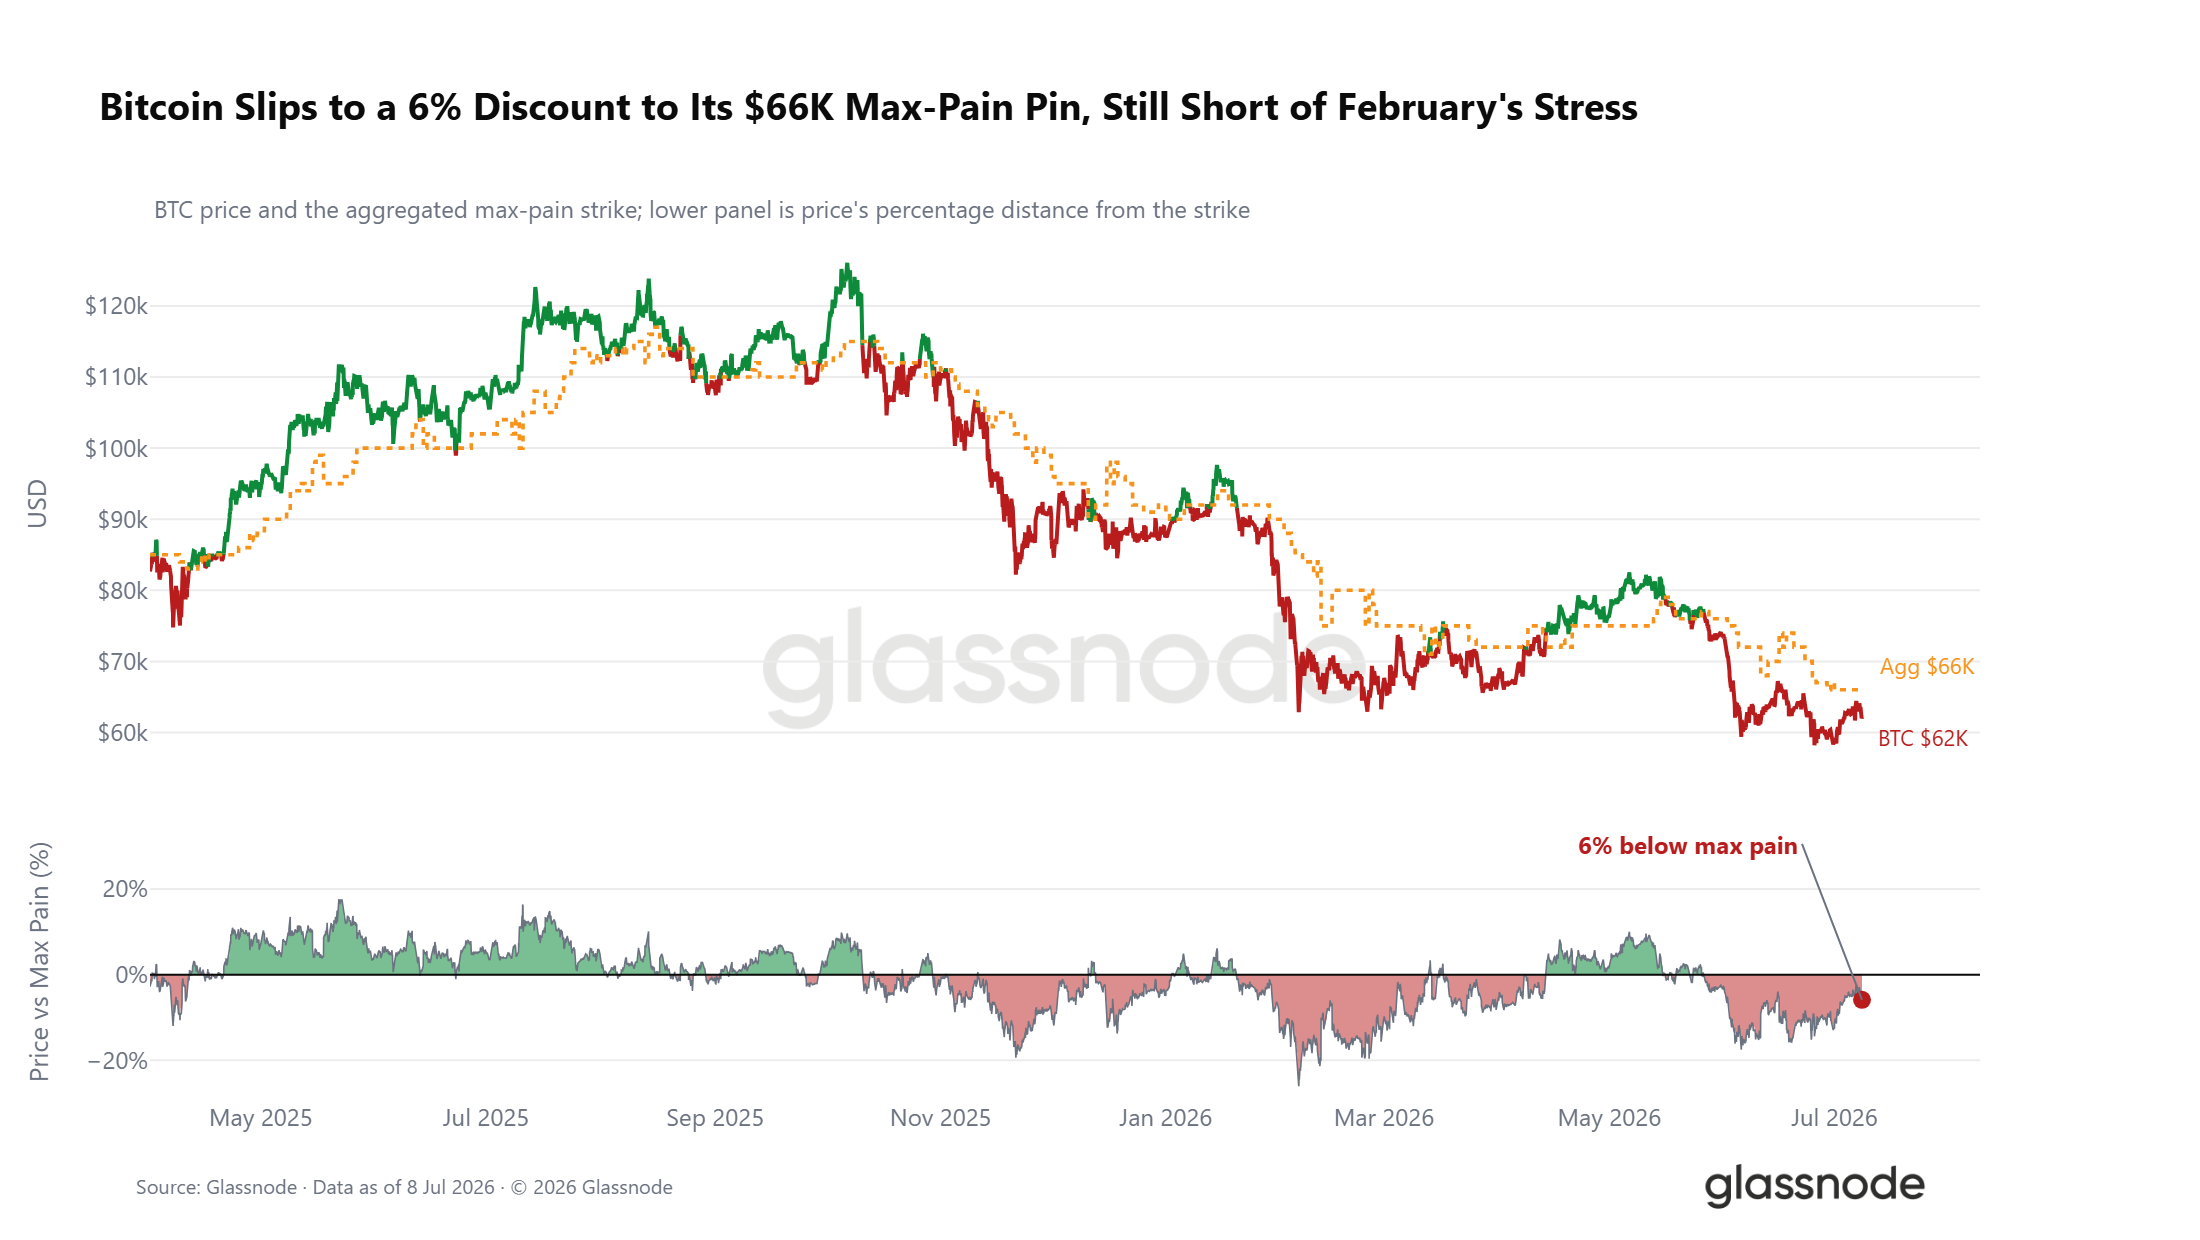
Beyond positioning and skew, the relationship between spot and options market structure adds further context. Bitcoin trades about 6% below its aggregated max pain of $66k, the strike where the most open interest expires worthless and toward which price often gravitates into expiry. The discount has widened with this week's drop, but it remains far from the deep stress observed during February's selloff, sitting nearer the middle of a range that has characterized most of 2026. Max pain has functioned as a loose gravitational anchor throughout the year, with spot oscillating around it rather than sustaining prolonged deviations. A sustained reclaim of $66k would shift the near-term read constructive, while a further widening would reinforce the defensive positioning evident across the options surface.
Live Chart

Crash Premium Is Falling

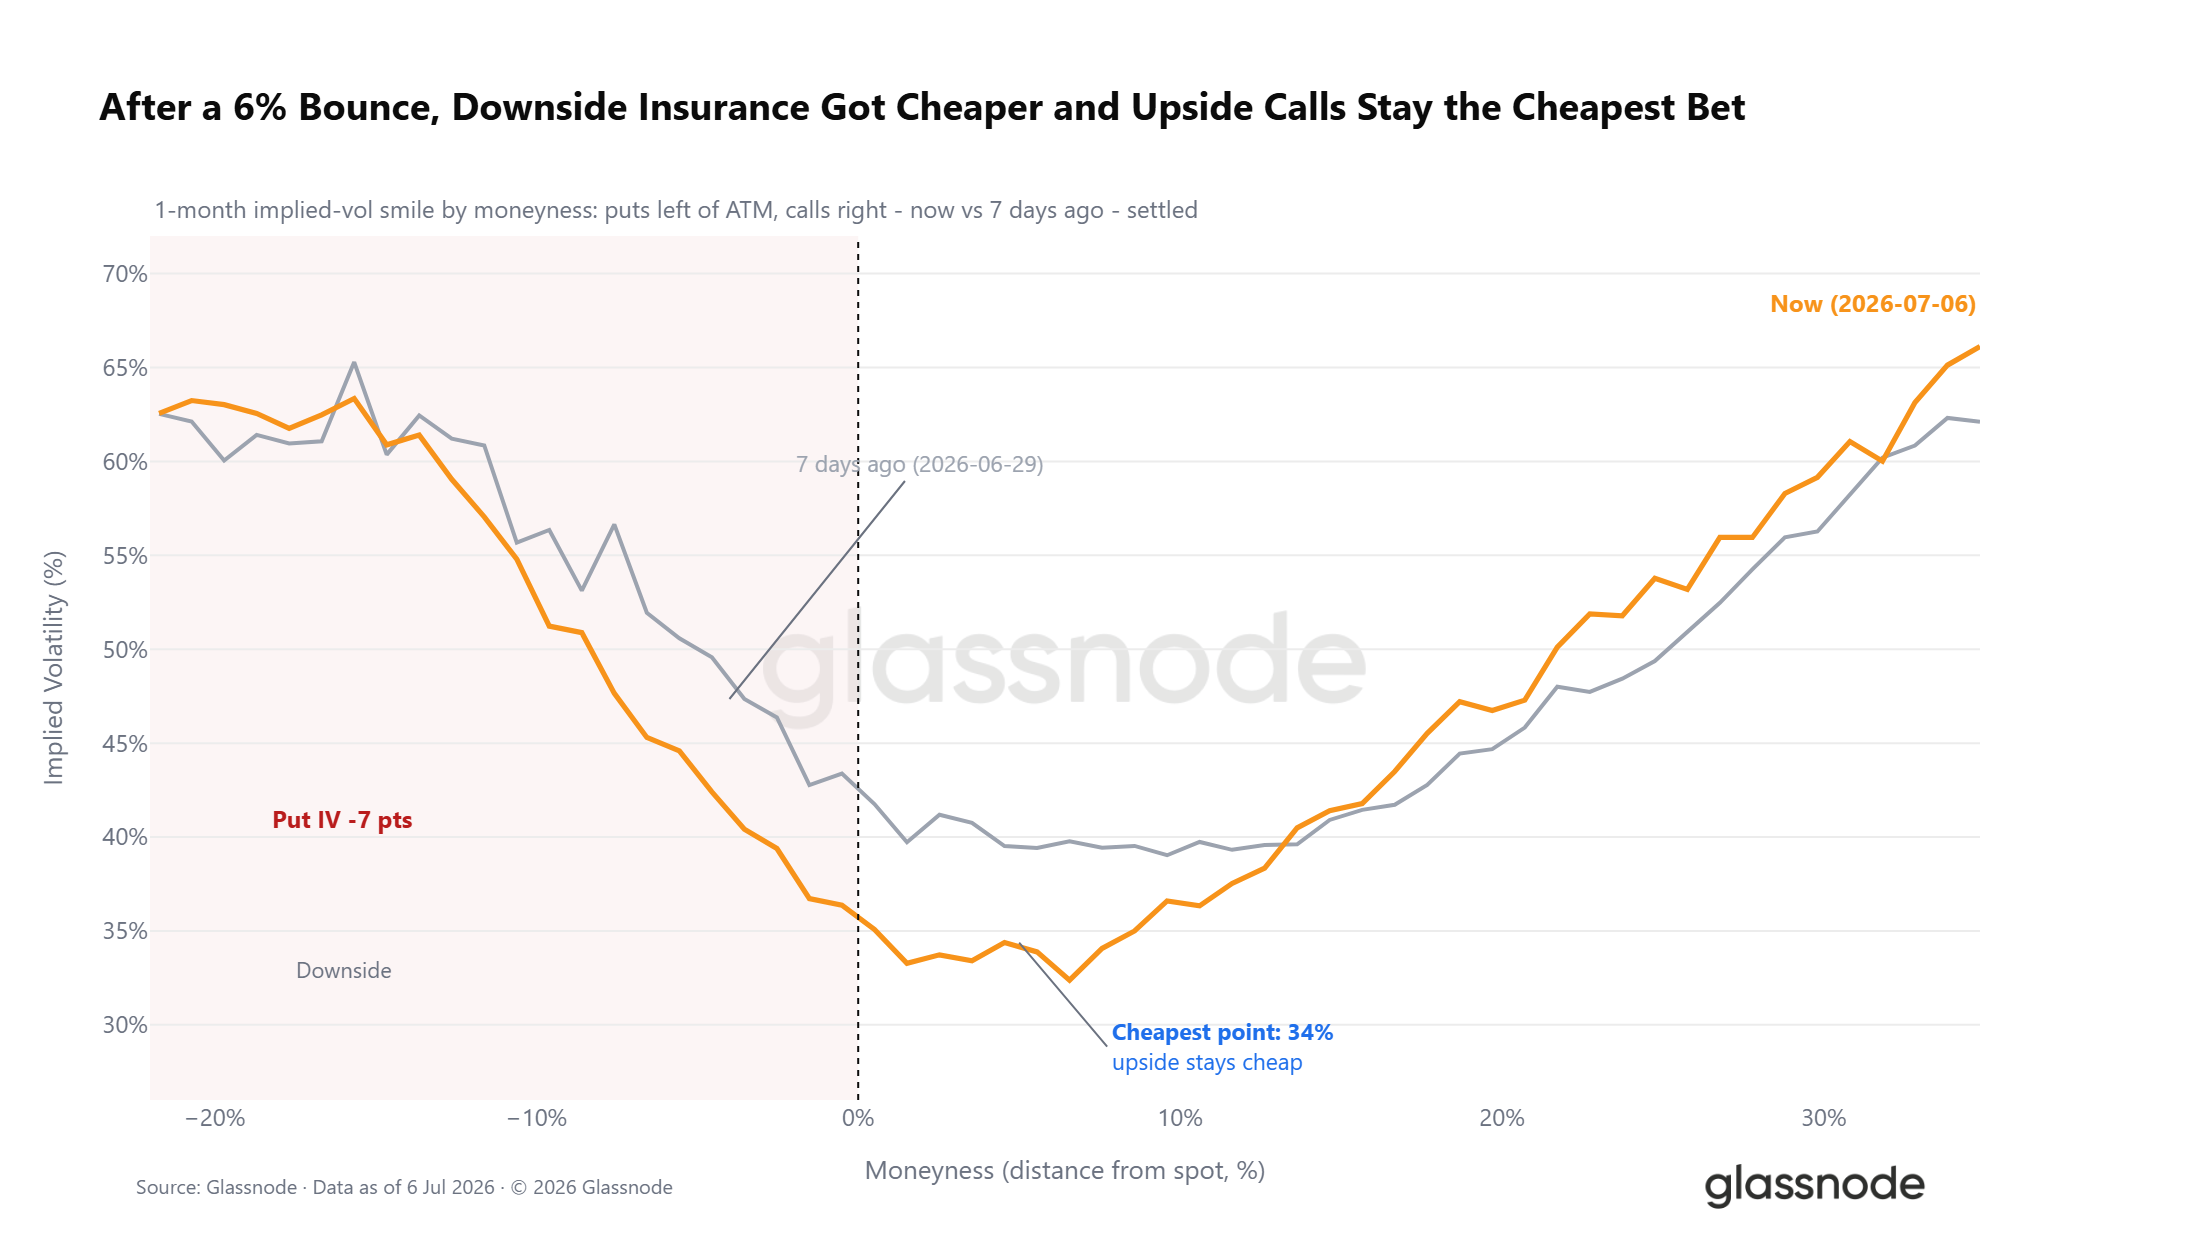
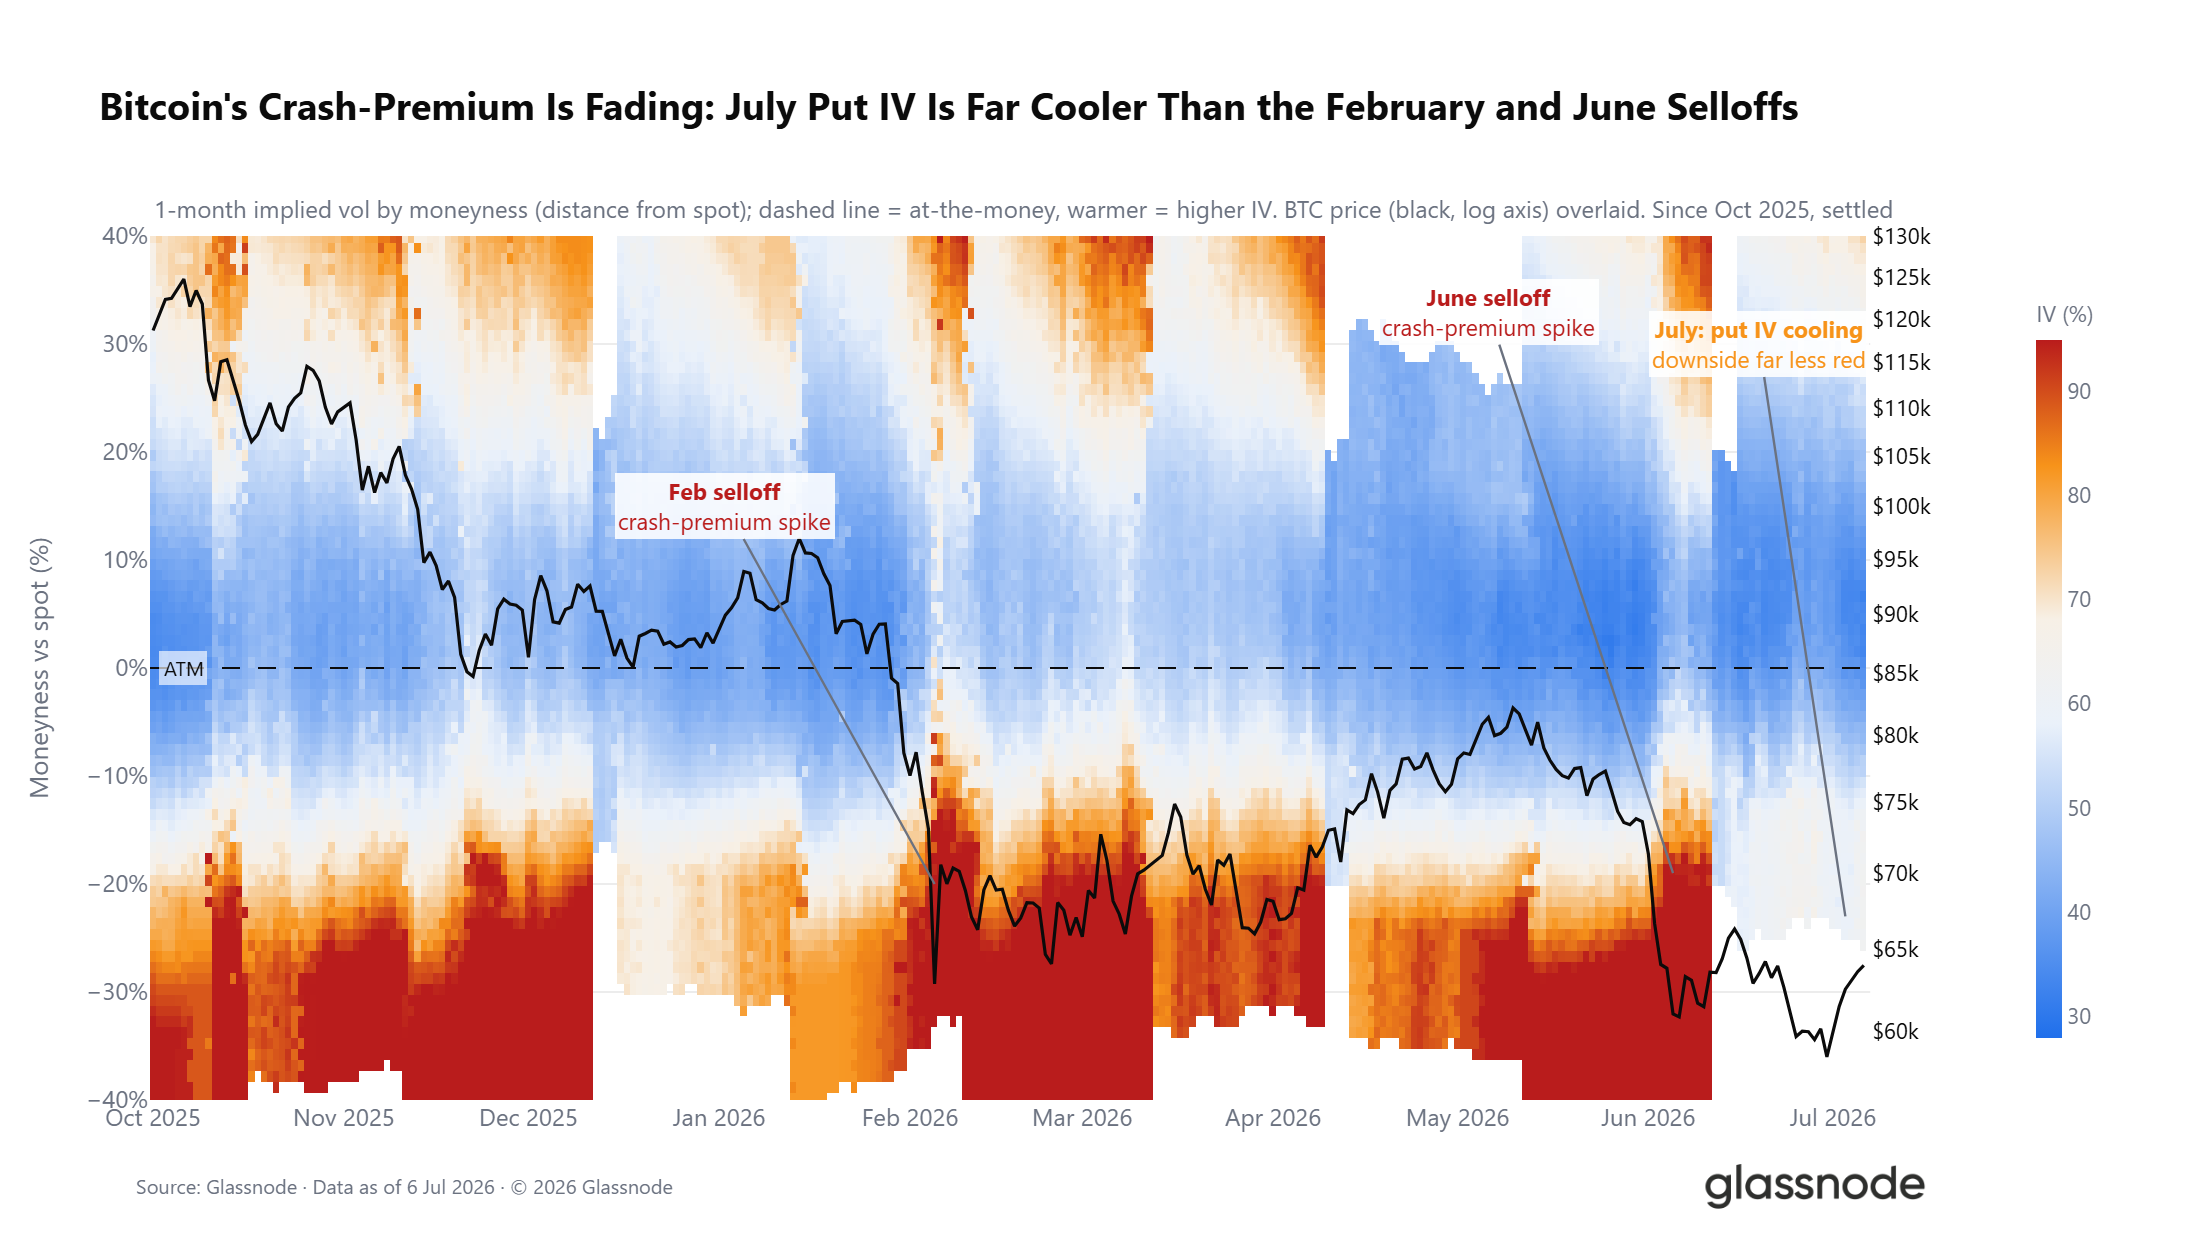
While the skew and positioning signals paint a mixed picture, the absolute cost of protection tells a clearer story. The cost of downside protection is declining as hedging demand subsides. Through the recent recovery, the whole put wing of the 1-month volatility smile repriced lower, with implied volatility 5% below spot falling significantly, while the cheapest point on the curve stayed out on the upside calls. The market still skews defensive, but it is paying materially less in absolute terms to be there.
Live Chart

The longer view reinforces this point. The deep put-side stress that flared bright red during the February and June selloff and has persisted for most of the year has faded into July. With DVOL near a 12-month low, this is a muted-volatility regime where caution has dominated, but is slowly rolling back.
Live Chart

Conclusion

Across all three layers of analysis, the market presents a consistent picture of a bear market in its later stages. On-chain, the five-month deep value regime and rising long-term holder capitulation at $280M per day confirm that supply redistribution is underway, though a sustained cooldown in this metric remains the prerequisite for a credible transition.

Off-chain, ETF outflows have eased from their June peak but continue to bleed on a monthly basis, while trading volume at roughly 80% below October 2025 levels reflects muted institutional conviction. In derivatives, positioning has leaned cautiously long with the put/call ratio at its 2026 low, yet the skew and vol surface still price meaningful downside risk.

Taken together, the conditions for a bottoming process are in place, but the confirmation signals have not yet arrived. The market requires further cooling in capitulation pressure, stabilization in institutional flows, and ideally a sustained reclaim of the True Market Mean before the probability of a regime transition can be weighted constructively.


Perguntas relacionadas

QAccording to the article, what is the current dominant downward force in the Bitcoin market, and what specific metric shows it is at a recent peak?

AThe dominant downward force in the Bitcoin market is long-term holder loss realization. This is shown by the Entity-Adjusted Long-Term Holder Realized Loss metric (30-day SMA), which recently printed a new peak at approximately $280M per day, the highest reading since December 2022.

QWhat two key on-chain price levels does the article state Bitcoin must reclaim to exit 'deep value territory'?

ATo exit 'deep value territory', Bitcoin must reclaim the True Market Mean at $76.6k and the Short-Term Holder Cost Basis at $72.2k.

QHow does the article describe the current state of institutional demand based on ETF data?

AThe article describes institutional demand as not yet stabilized. While ETF net outflows have eased from their June peak, they continue on a monthly basis (currently -$88.9M per day). Furthermore, ETF trading volume remains deeply muted, roughly 80% below the October 2025 peak, indicating a lack of meaningful conviction return among ETF investors.

QWhat conflicting signals does the derivatives market present according to the off-chain insight section?

AThe derivatives market presents conflicting signals. On one hand, positioning has leaned cautiously long, with the options open-interest put/call ratio at a 2026 low of 0.56 and perpetual funding rates averaging low. On the other hand, the options surface still prices meaningful downside risk, as evidenced by a bid 25-delta skew across all tenors, meaning traders are still paying a premium for downside protection.

QWhat is the article's overall conclusion about the state of the Bitcoin market and the conditions needed for a transition?

AThe article concludes that the market is in the later stages of a bear market with conditions for a bottoming process in place, but confirmation signals are lacking. For a credible regime transition, the market requires: 1) further cooling in long-term holder capitulation pressure, 2) stabilization in institutional ETF flows, and 3) a sustained reclaim of the True Market Mean price level.

Leituras Relacionadas

Breaking News: Musk Delivers the Most Powerful Grok 4.5, Slashes Price of Top-tier Opus Intelligence Drastically

**Elon Musk Launches Grok 4.5: A Cost-Effective, High-Performance AI Rival** SpaceXAI, in collaboration with Cursor, has released Grok 4.5, its new flagship AI model designed specifically for coding and agentic tasks. Trained on tens of thousands of NVIDIA GB300 GPUs using massive, high-quality data filtered from trillions of Cursor developer interactions, the model emphasizes "per-token intelligence." In benchmark performance, Grok 4.5 is highly competitive. It scores 64.7% on SWE Bench Pro (surpassing GPT-5.5's 58.6% and Opus 4.7's 64.3%), 83.3% on Terminal Bench 2.1 (nearly matching GPT-5.5), and 62.0% on DeepSWE 1.0 (beating Opus 4.8). Overall, it ranks fourth in AAAI official tests and first in the Harvey legal agent benchmark. The model's key advantage is its combination of speed, efficiency, and low cost. It generates responses at 80 tokens per second and, crucially, uses far fewer tokens to complete tasks—4.2 times fewer than Opus 4.8 on SWE Bench Pro. It is priced at $2 per million input tokens and $6 per million output tokens, significantly undercutting competitors. Musk stated it is "roughly equivalent to Opus 4.7, but much faster." Early user tests show Grok 4.5 can generate functional code for applications like 3D solar system simulators and basic games from simple prompts, though some note it still lags behind top models in certain creative tasks. Musk has hinted at a major update next month, leveraging real-world engineering data from his companies, with an even larger 2-trillion parameter version reportedly in development. Grok 4.5 positions itself not as the absolute strongest model, but as a highly efficient and affordable alternative in the top tier.

marsbitHá 2m

Breaking News: Musk Delivers the Most Powerful Grok 4.5, Slashes Price of Top-tier Opus Intelligence Drastically

marsbitHá 2m

Today, The Hong Kong Exchange Was Once Again Overwhelmed

Hong Kong's stock exchange witnessed an exceptionally busy day on July 9, with a record seven companies conducting initial public offerings (IPOs) simultaneously. The list included major firms such as Luxshare Precision, which launched the largest Hong Kong IPO of the year, and other notable names like Tri-Ring Group and Qiyunshan Food. However, the market reception was sharply divided on the first trading day. While Qiyunshan Food's shares surged over 110%, several other newcomers, including Luxshare Precision, Dingtai High-Tech, and Rigol Technologies, opened below their issue prices, with some falling nearly 20%. This event highlights a broader, bustling IPO scene in Hong Kong for 2024, with 82 Chinese companies listing in the first half alone—more than double the figure from the same period last year. A significant portion of this activity comes from dual "A+H" listings, where mainland China-listed firms seek secondary listings in Hong Kong. These larger companies have accounted for nearly 60% of total fundraising. Despite the high volume, recent trends show a cooling market sentiment for many new listings. Several IPOs in early July, including that of Tongrentang Healthcare, debuted with significant losses, indicating increased investor caution and selectivity. The market narrative is shifting, with capital increasingly concentrating on high-growth sectors like artificial intelligence, robotics, and semiconductors, while traditional manufacturing and consumer goods face greater pressure and volatility. This divergence underscores a market where success is no longer guaranteed by merely listing, but depends heavily on a company's growth prospects and sector appeal.

marsbitHá 7m

Today, The Hong Kong Exchange Was Once Again Overwhelmed

marsbitHá 7m

Glassnode: Crypto Market Enters Later Stages of Bottoming Phase

Glassnode: Crypto Market Enters Later Stages of Bottom Formation Bitcoin has traded below the true market average and the short-term holder cost basis for five consecutive months, indicating a deep undervaluation. On-chain data reveals a significant shift in selling pressure, with long-term holders now accounting for 43% of all realized losses. Daily realized losses for this group recently peaked at $280 million, the highest level since December 2022. While this large-scale capitulation is a hallmark of bear market bottoms, a sustained decline in this metric is a prerequisite for a sustained recovery. Institutional demand remains weak. US spot Bitcoin ETFs continue to see monthly net outflows, although the pace has moderated from June's peak. Furthermore, average daily ETF trading volumes have contracted by approximately 80% from their October 2025 peak, reflecting subdued institutional participation. Derivatives markets present a mixed picture. Overall positioning has shifted to cautiously bullish, with the put/call ratio dropping to a yearly low. However, the options volatility skew remains elevated, signaling that traders are still paying a premium for downside protection. The spot price also trades below the gamma "max pain" level. In summary, multiple indicators suggest the market is in the later phases of a bottoming process, characterized by long-term holder capitulation and weak institutional inflows. However, key confirmation signals for a durable trend reversal—a sustained drop in long-term holder selling pressure, stabilization of ETF flows, and a price recovery above key cost bases—are still pending.

Foresight NewsHá 33m

Glassnode: Crypto Market Enters Later Stages of Bottoming Phase

Foresight NewsHá 33m

Private Credit in US Dollar

Stablecoins are evolving into a new type of money market fund, channeling crypto deposits into the $2 trillion private credit market. This mirrors the 1970s innovation where money market funds pooled small deposits to buy high-yield government securities, bypassing bank restrictions. Today, platforms like Apollo's ACRED tokenized fund and Figure's on-chain lending system allow stablecoin holders to access institutional private credit strategies with no minimum investment, offering yields of 8-12%. On-chain tokenization enables greater liquidity and DeFi composability (e.g., using tokens as collateral for leveraged positions) compared to traditional, locked-up private credit funds. Consequently, on-chain private credit has grown 15x in a year to $5.87 billion, though it remains a tiny fraction (0.3%) of the global market. However, this model carries significant risks, as illustrated by the failure of Goldfinch. Launched in 2021, it directed crypto deposits to motorcycle loans in Kenya and Nigeria. Critical issues included a lack of local oversight, leading to unauthorized fund transfers and borrower defaults. With $56 million now trapped in non-performing loans, its collapse highlights that while blockchain streamlines capital transfer, the essential 90% of lending—underwriting, monitoring, and recovery—remains a costly, localized challenge. Success requires robust, traditional credit infrastructure, not just on-chain execution.

marsbitHá 53m

Private Credit in US Dollar

marsbitHá 53m

Trading

Spot
活动图片