Reading Trends from Data: The Logic Behind the Crypto Market Rebound and Potential Risks

marsbitPublicado em 2025-12-29Última atualização em 2025-12-29

Resumo

Analysis of the crypto market rebound and underlying risks, based on data for the week of Dec 20-26. Bitcoin found technical support at the $85,000 level, bouncing from a low of $84,500. While a technical rebound is underway, key data suggests the market is not yet on a solid footing for a sustained trend reversal. Key short-term data points show mixed picture: * **Stablecoins:** Net issuance remained negative at -$326M, but the outflow rate slowed by 60% week-over-week. * **BTC ETFs:** Net outflows worsened significantly to -$664.37M, a crucial headwind. A return to net inflows is deemed essential for a true reversal. * **OTC Premiums:** USDT and USDC premiums fell to 97.86% and 98.36% respectively, indicating weak demand and persistent capital outflows. * **ETH ETFs:** Outflows narrowed considerably to -$139.53M from the previous week, providing some relative stability for Ethereum. Mid-term on-chain data revealed minor accumulation by addresses holding 100-1K BTC, while larger wallets (10K-100K BTC) reduced holdings. Strong筹码 accumulation was noted near the $87,100 price point, suggesting it could become a key support level. The altcoin market (TOTAL3) saw a modest 1.95% gain but overall sentiment remained weak. Key observations include: * Low trading activity and a subdued market sentiment index. * BTC dominance held high at 65.76%, indicating altcoins continue to underperform Bitcoin. * Meme coins and high-profile tokens saw sporadic gains, but lacked s...

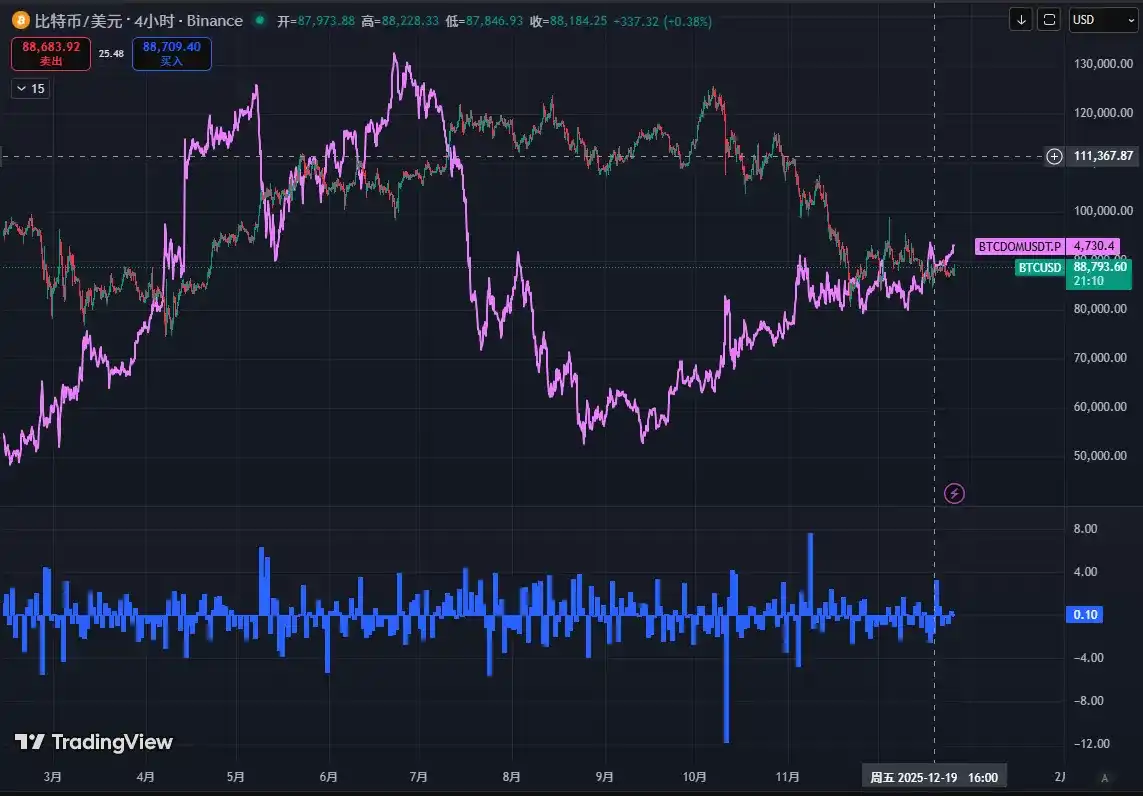
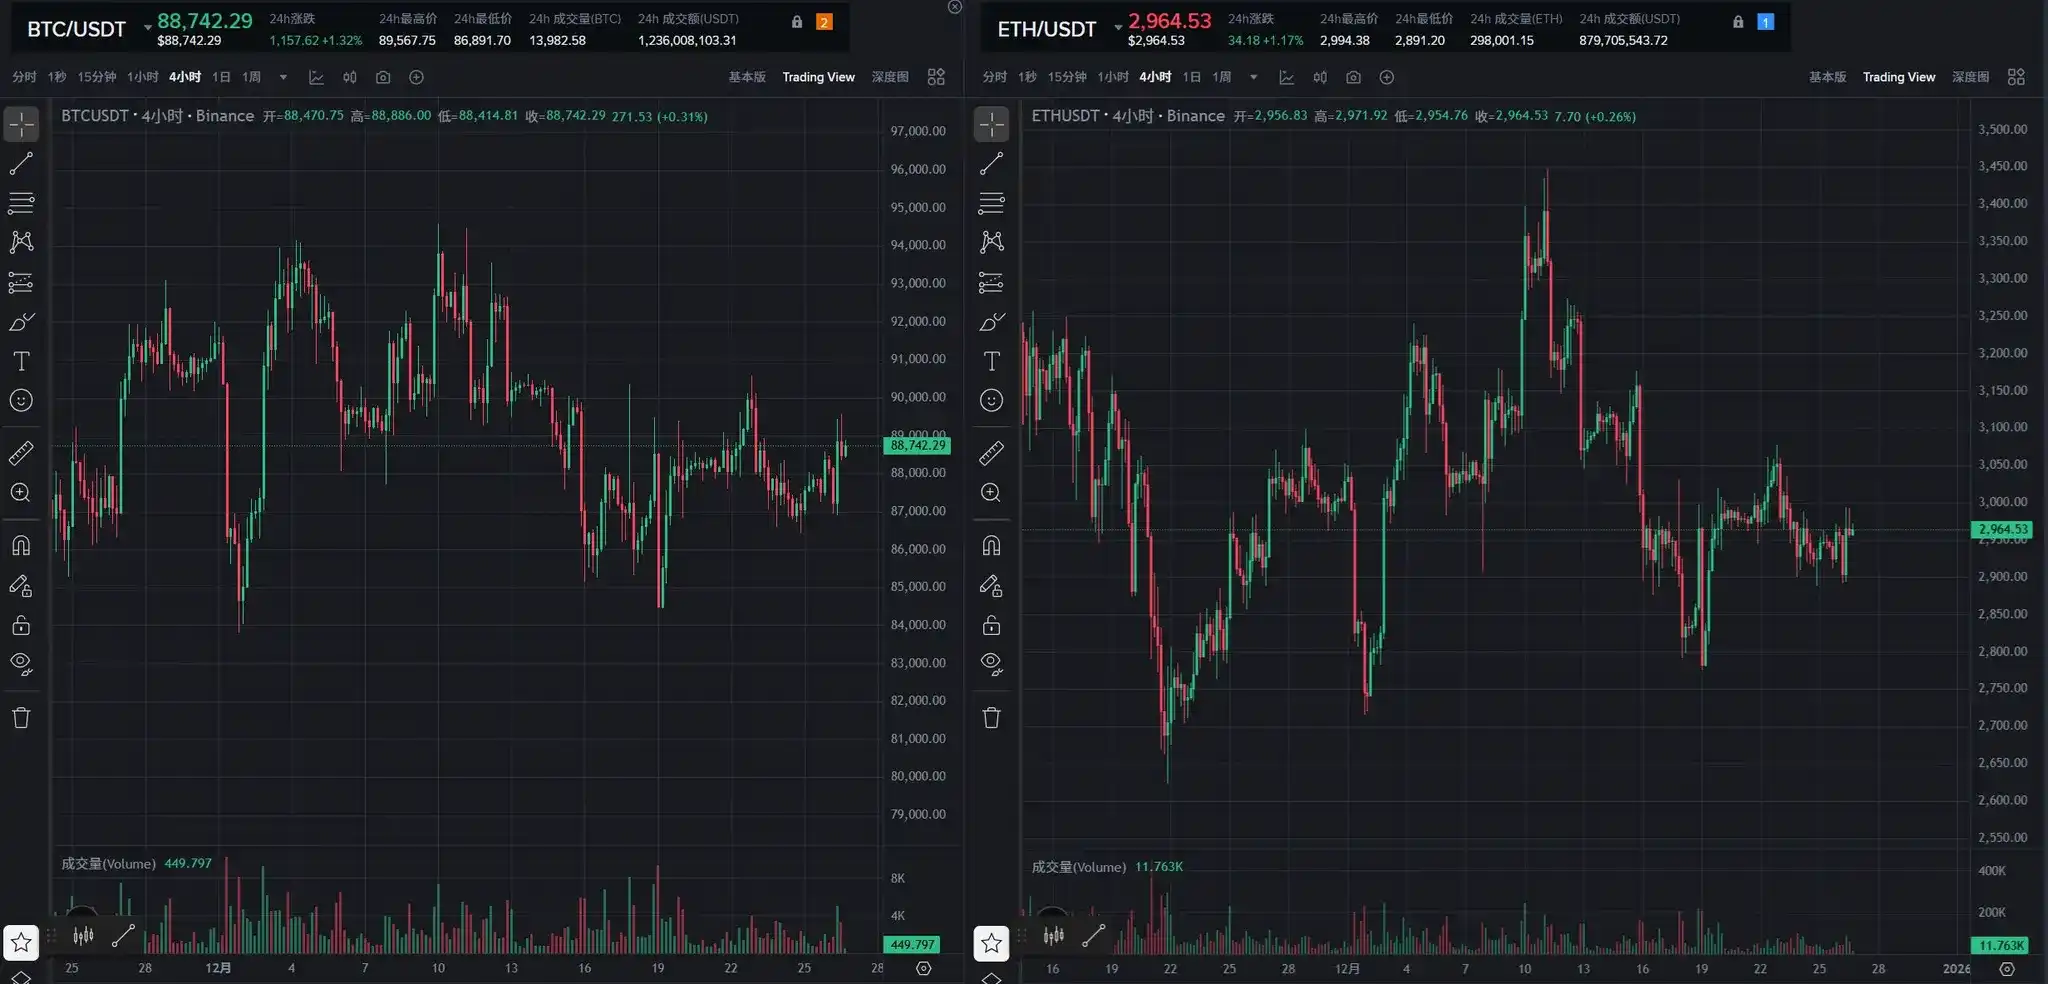
Last week, the market showed a downward trend, and the technical support level of $85,000 we previously emphasized proved effective. After BTC touched a low of $84,500 on Friday, it began a rebound this week. From both daily and weekly perspectives, the support level of $85,000 was validated after the previous continuous decline. Over the weekend, the market maintained its rebound momentum, showing an overall pattern of fluctuating recovery.

2. Mid- to Short-Term Data Changes Affecting the Market This Week

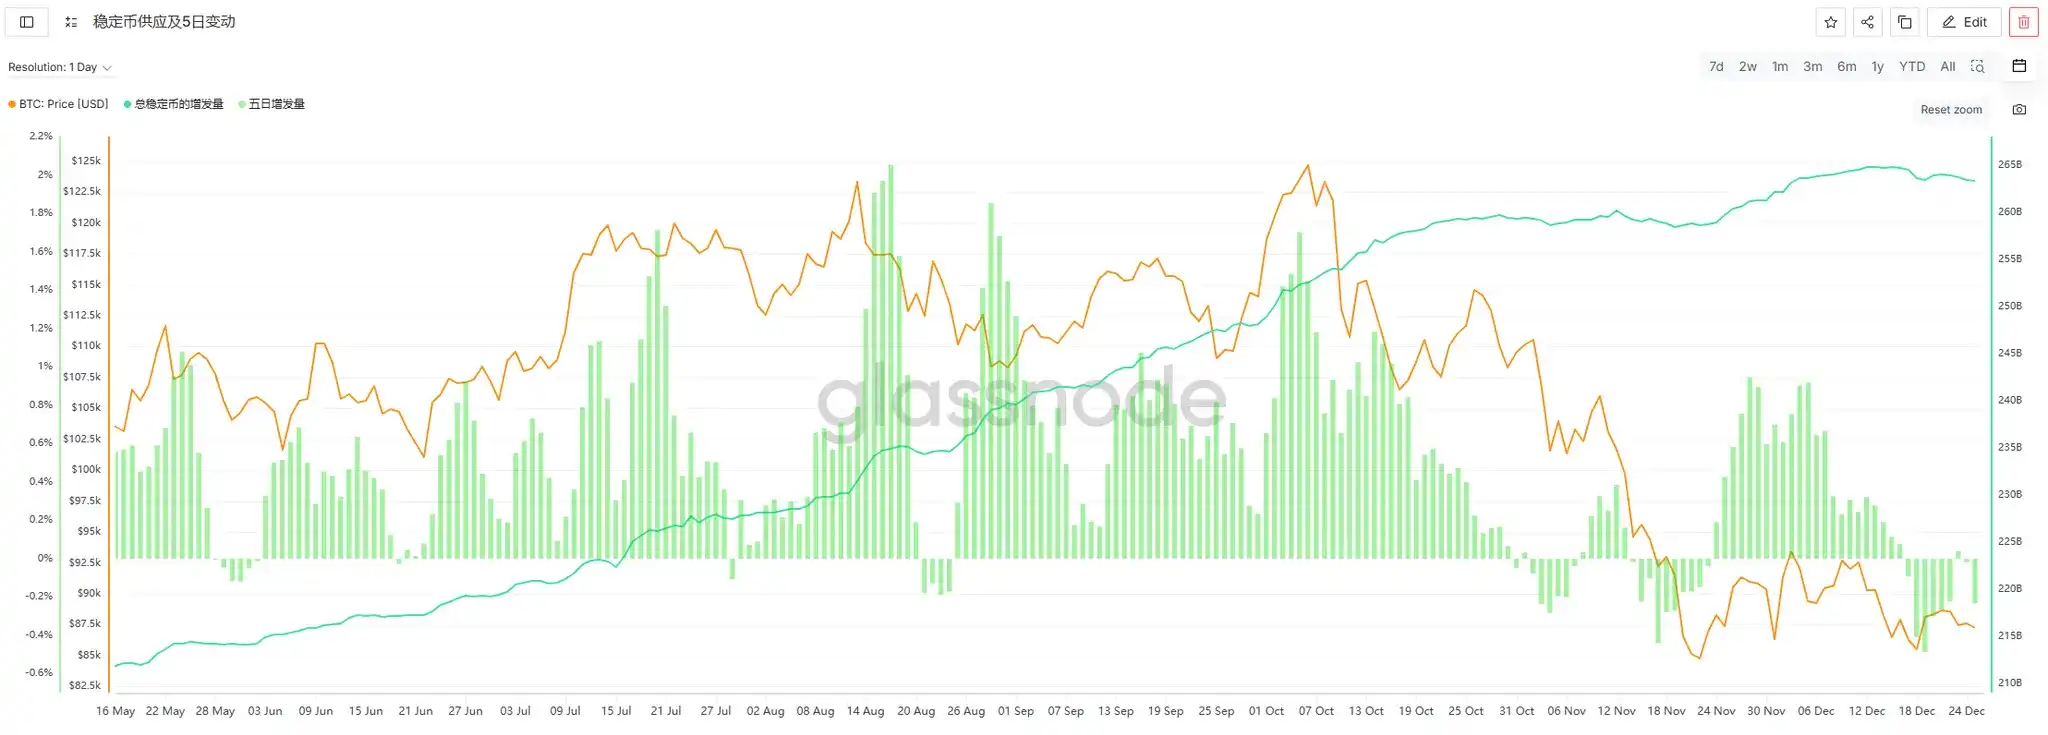
2.1 Stablecoin Fund Flows

This week (12/20-12/26), the weekly issuance of stablecoins was -$326 million, indicating continued outflow of funds, but the scale of outflow has significantly narrowed. Compared to last week's negative issuance of -$824 million, the average daily negative issuance this week decreased from -$117.7 million to -$46.5 million, representing a 60% increase in overall fund flow. The broader market was mainly volatile this week without sustained declines, which aligns with the trend of reduced stablecoin outflows.

2.2 ETF Fund Flows

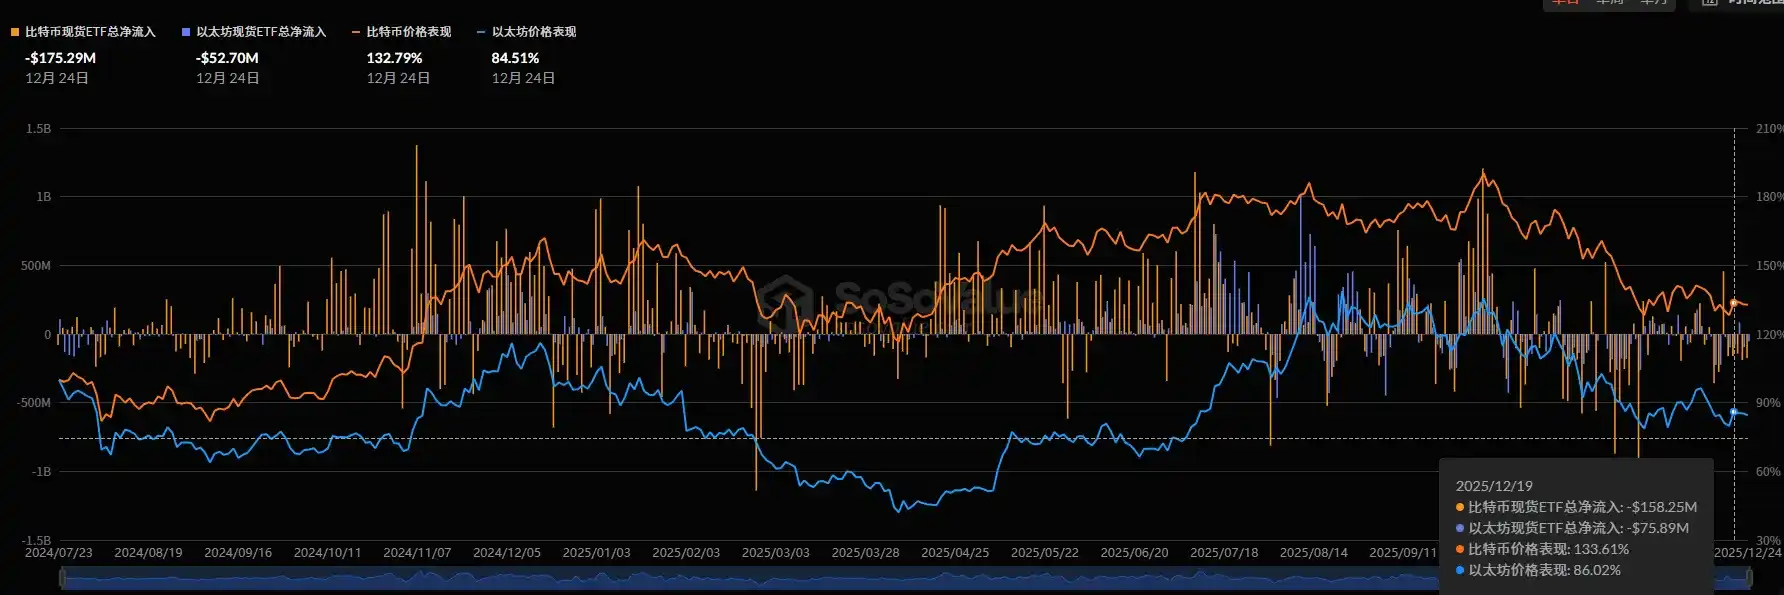
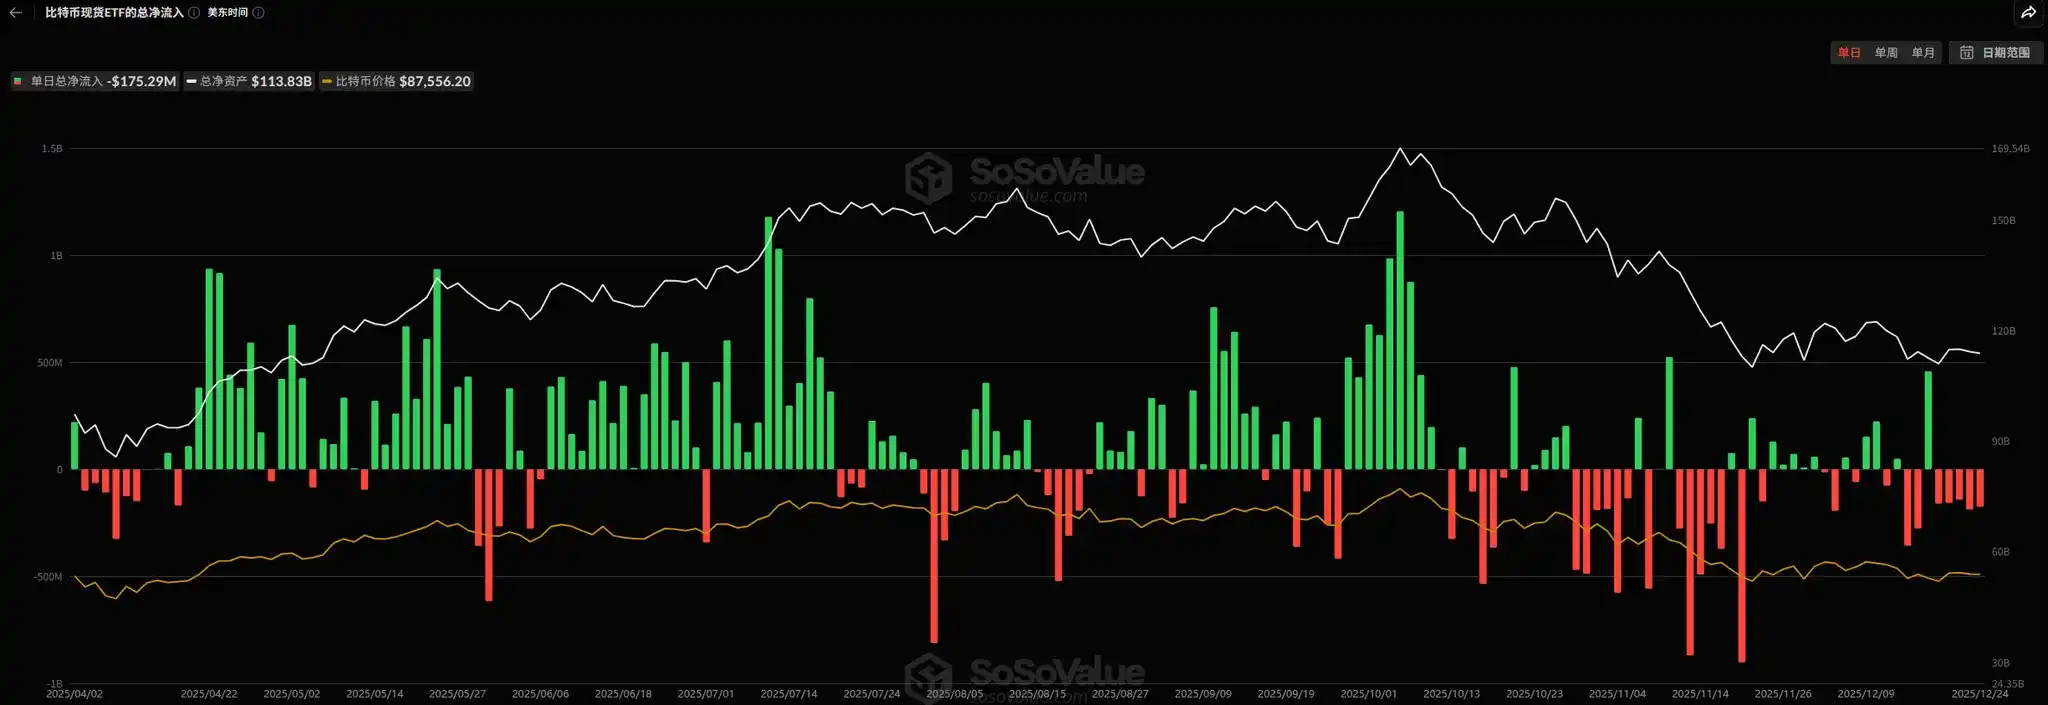
This week, the net outflow of Bitcoin ETFs further expanded, reaching $664.37 million, an increase of $374.72 million compared to last week. Based on daily fund flow data, there is no sign of a regular reduction in ETF net outflows yet. Although BTC prices have rebounded, this can only be characterized as a short-term technical rebound. For the market to achieve a trend reversal, the return of Bitcoin ETFs to net inflows is a core prerequisite.

2.3 Off-Market Discount/Premium

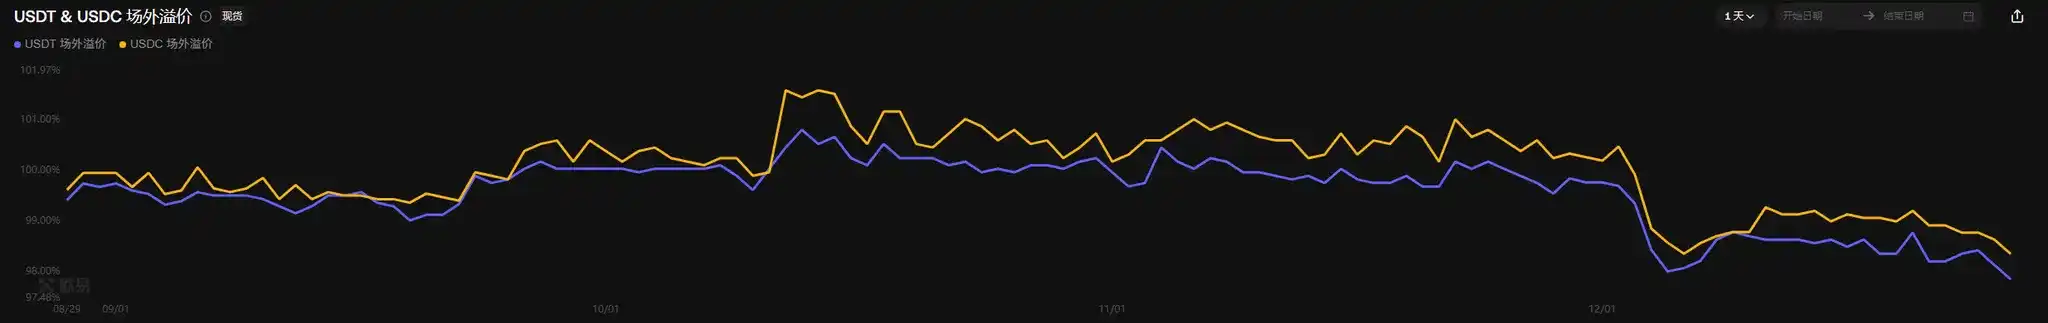
This week, the off-market discount/premium rates for USDT and USDC slightly declined. The current USDT discount/premium is 97.86%, and USDC is 98.36%, both at relatively low levels for the year. This phenomenon reflects continued低迷 market sentiment, insufficient off-market funds for bargain hunting, and some signs of capital outflow.

2.4 Ethereum ETF

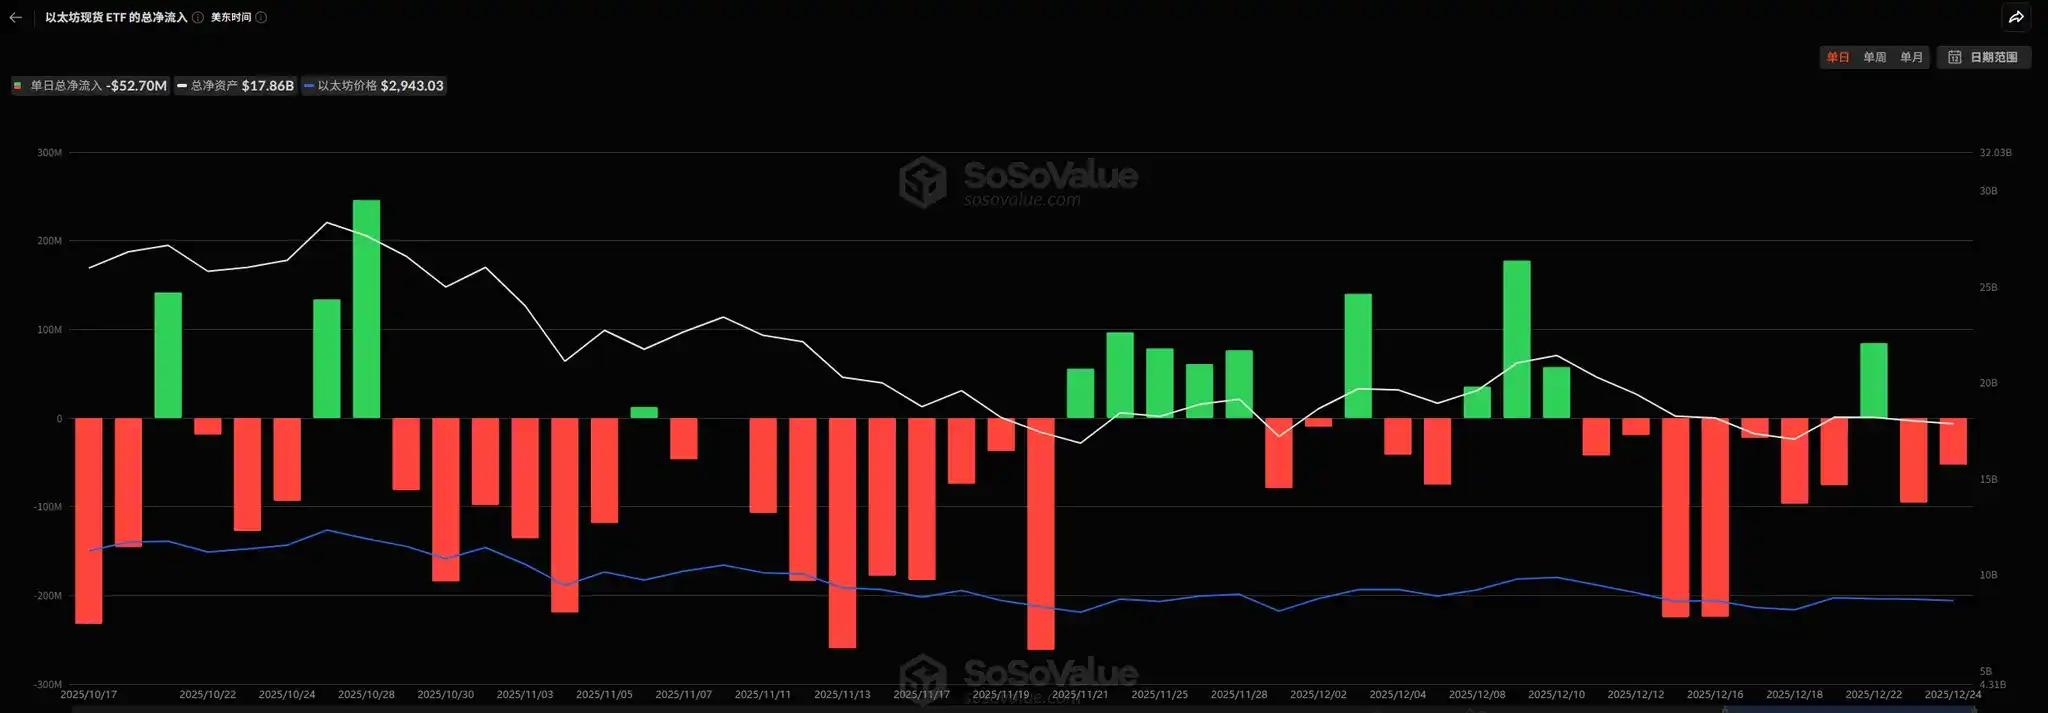
This week, the net outflow of Ethereum ETFs was -$139.53 million, a significant reduction compared to last week's net outflow of $587.5 million. Ethereum prices showed volatile movements this week without sustained declines, echoing the narrowed ETF outflows. If this trend can be maintained, it will provide strong support for Ethereum's rebound.

2.5 Total Crypto Market Capitalization

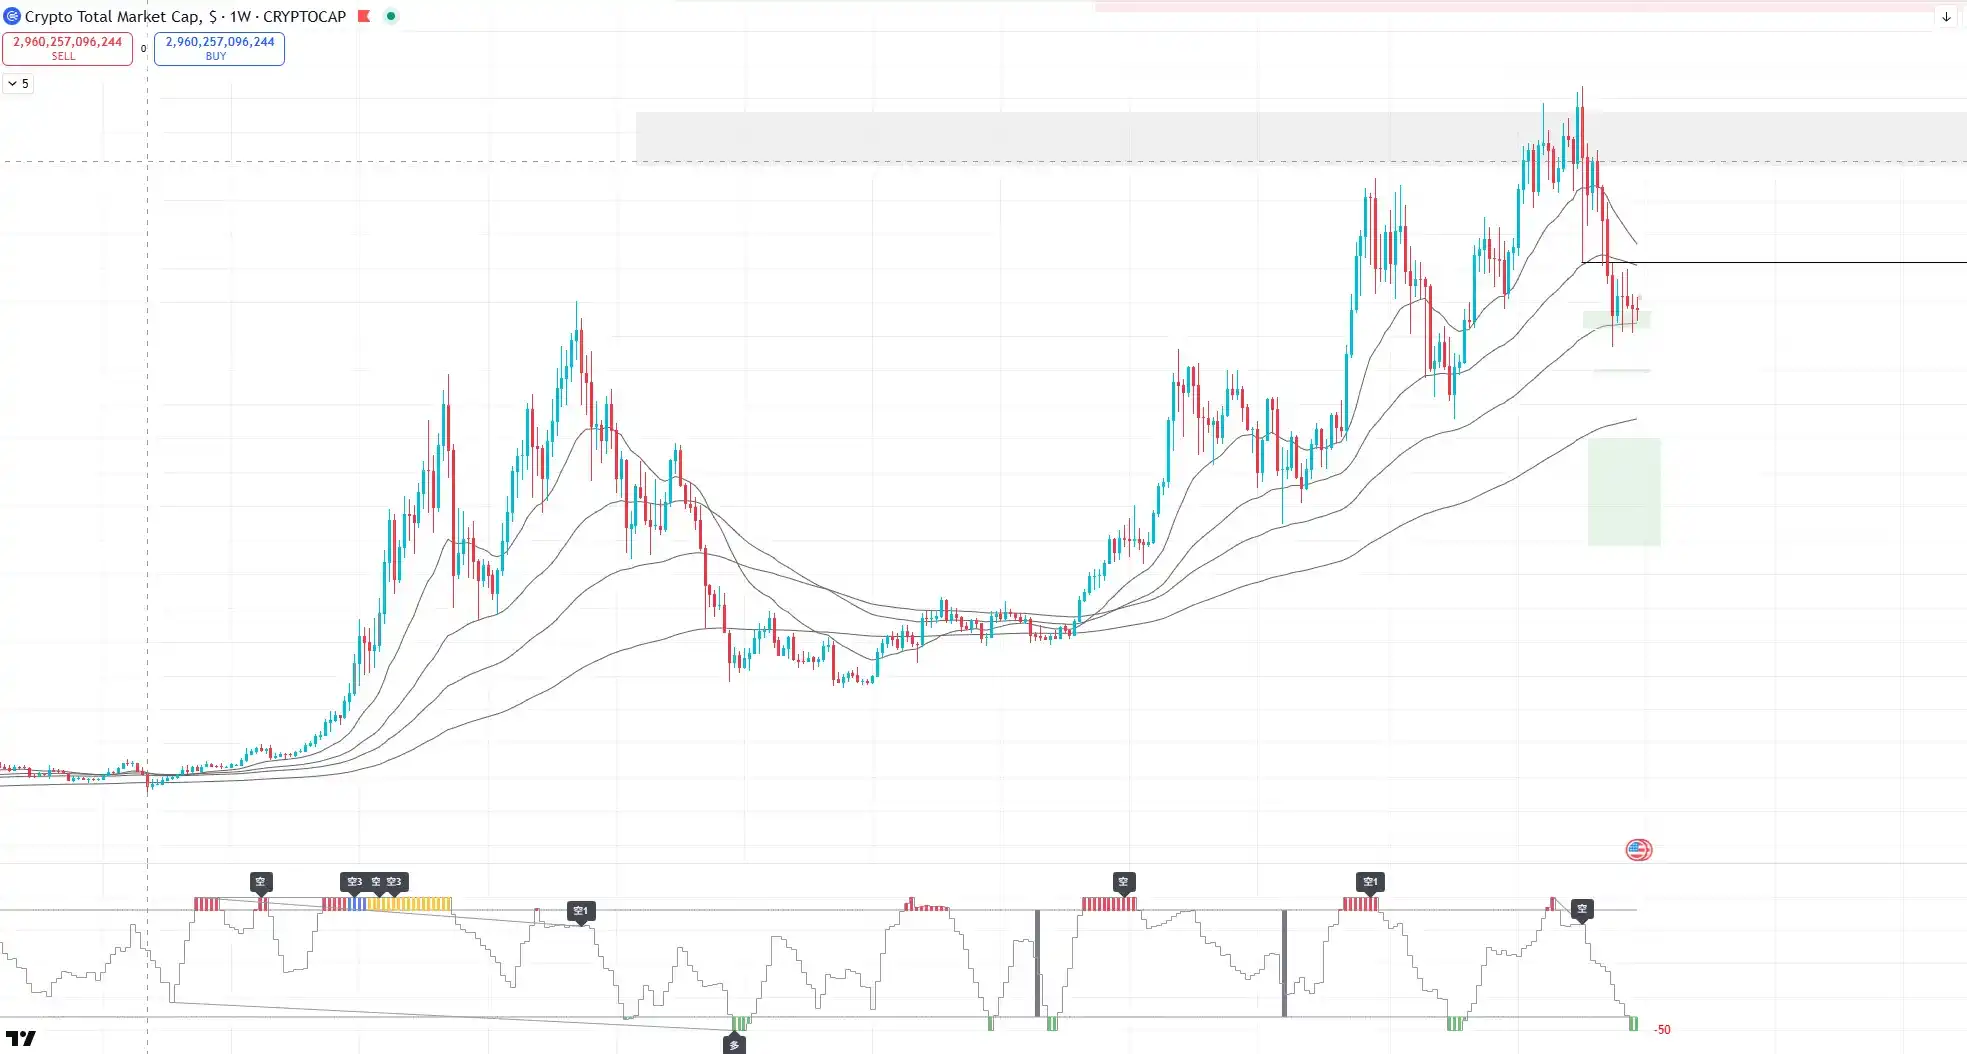
This week, the total crypto market capitalization fell to around $3 trillion, precisely touching the weekly EMA100 moving average. The indicator currently shows a weekly oversold signal. Combined with the historical performance of weekly oversold signals since 2021, the market has the potential for a rebound from a technical perspective.

3. Mid-Term Data Changes Affecting the Market This Week

Holding Address Distribution and URPD

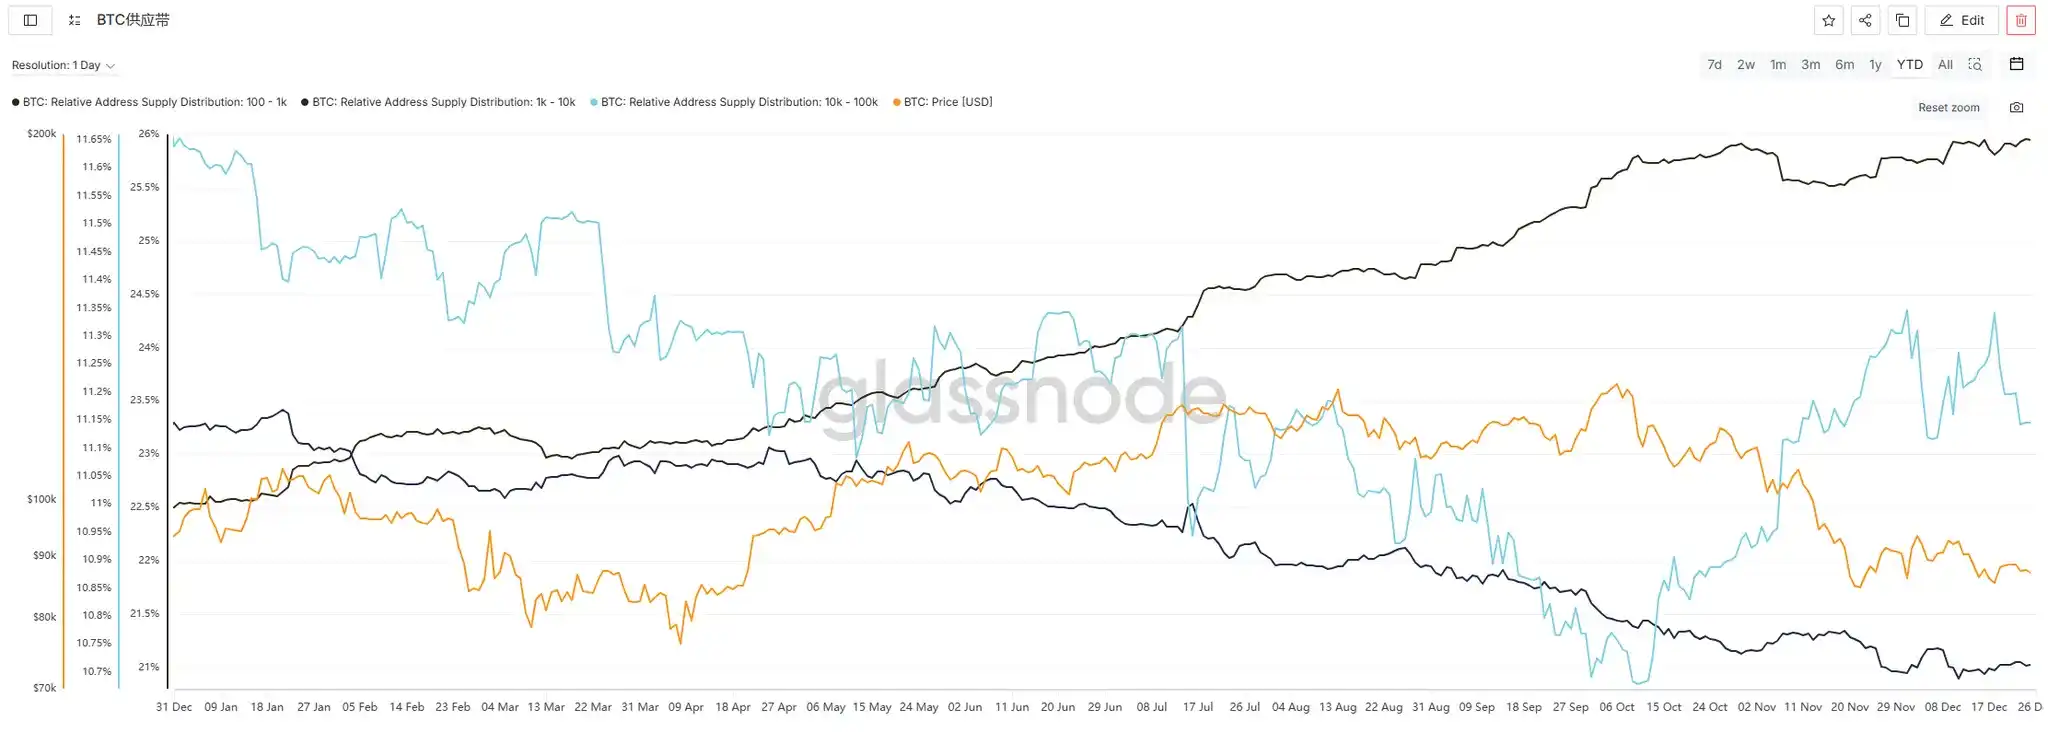
In terms of Bitcoin holding address distribution, the proportion of addresses holding 100-1K BTC increased from 25.813% to 25.951%, showing a slight accumulation trend. The proportion of addresses holding 10K-100K BTC decreased from 11.341% to 11.146%, indicating some reduction. The proportion of addresses holding 1K-10K BTC slightly increased from 20.972% to 21.022%, showing overall minor fluctuations.

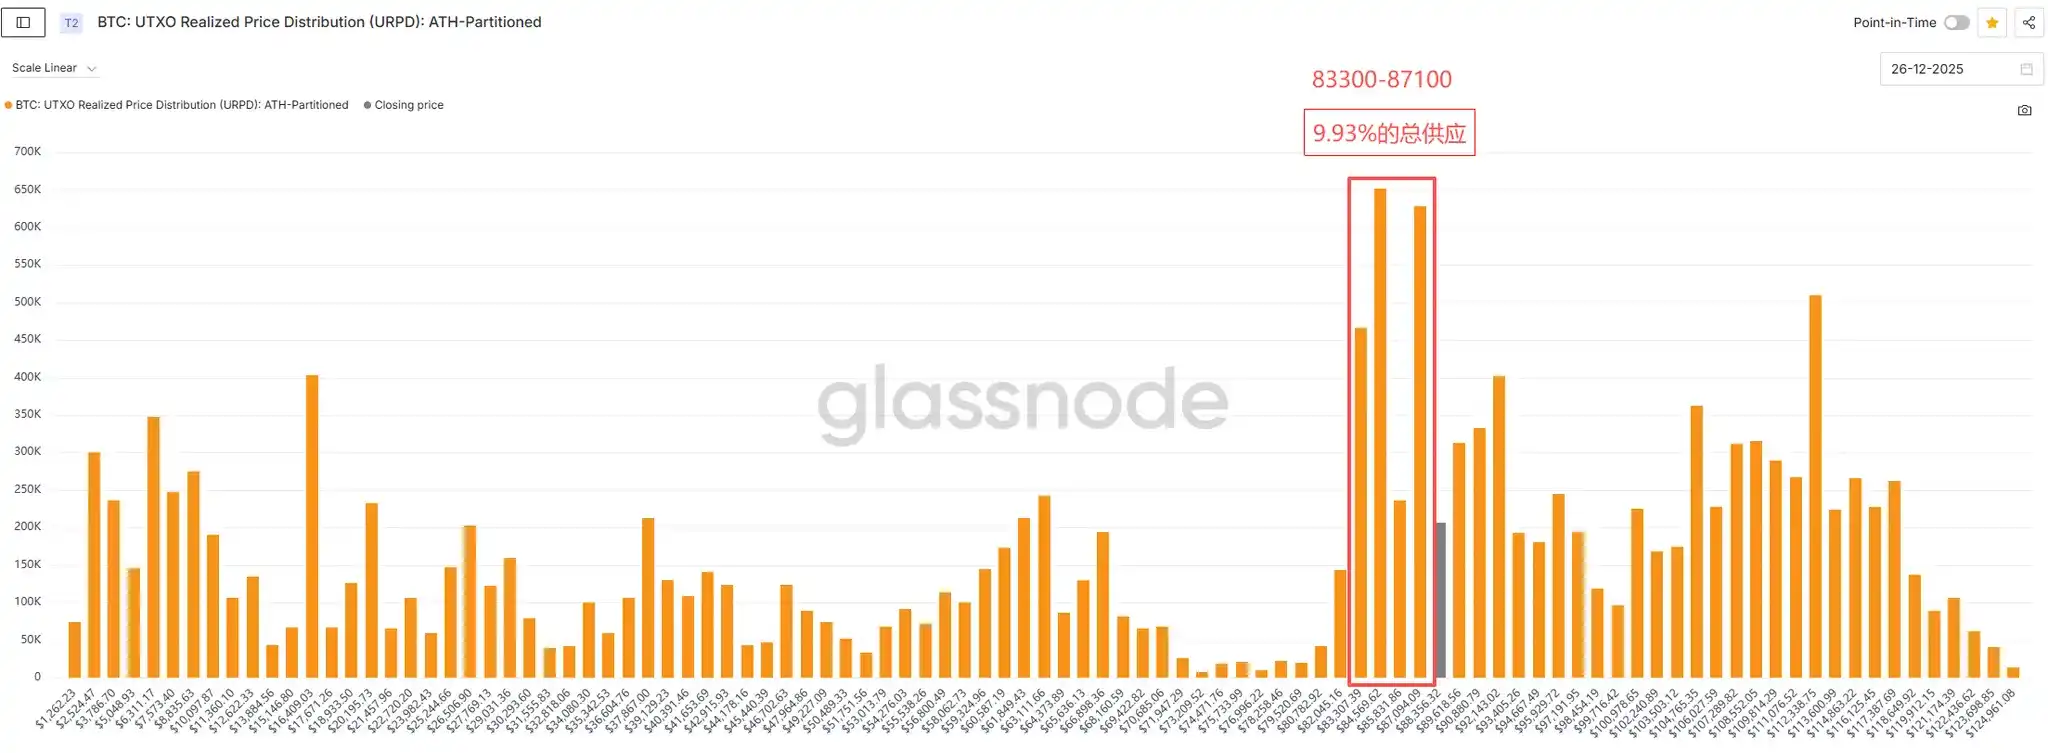
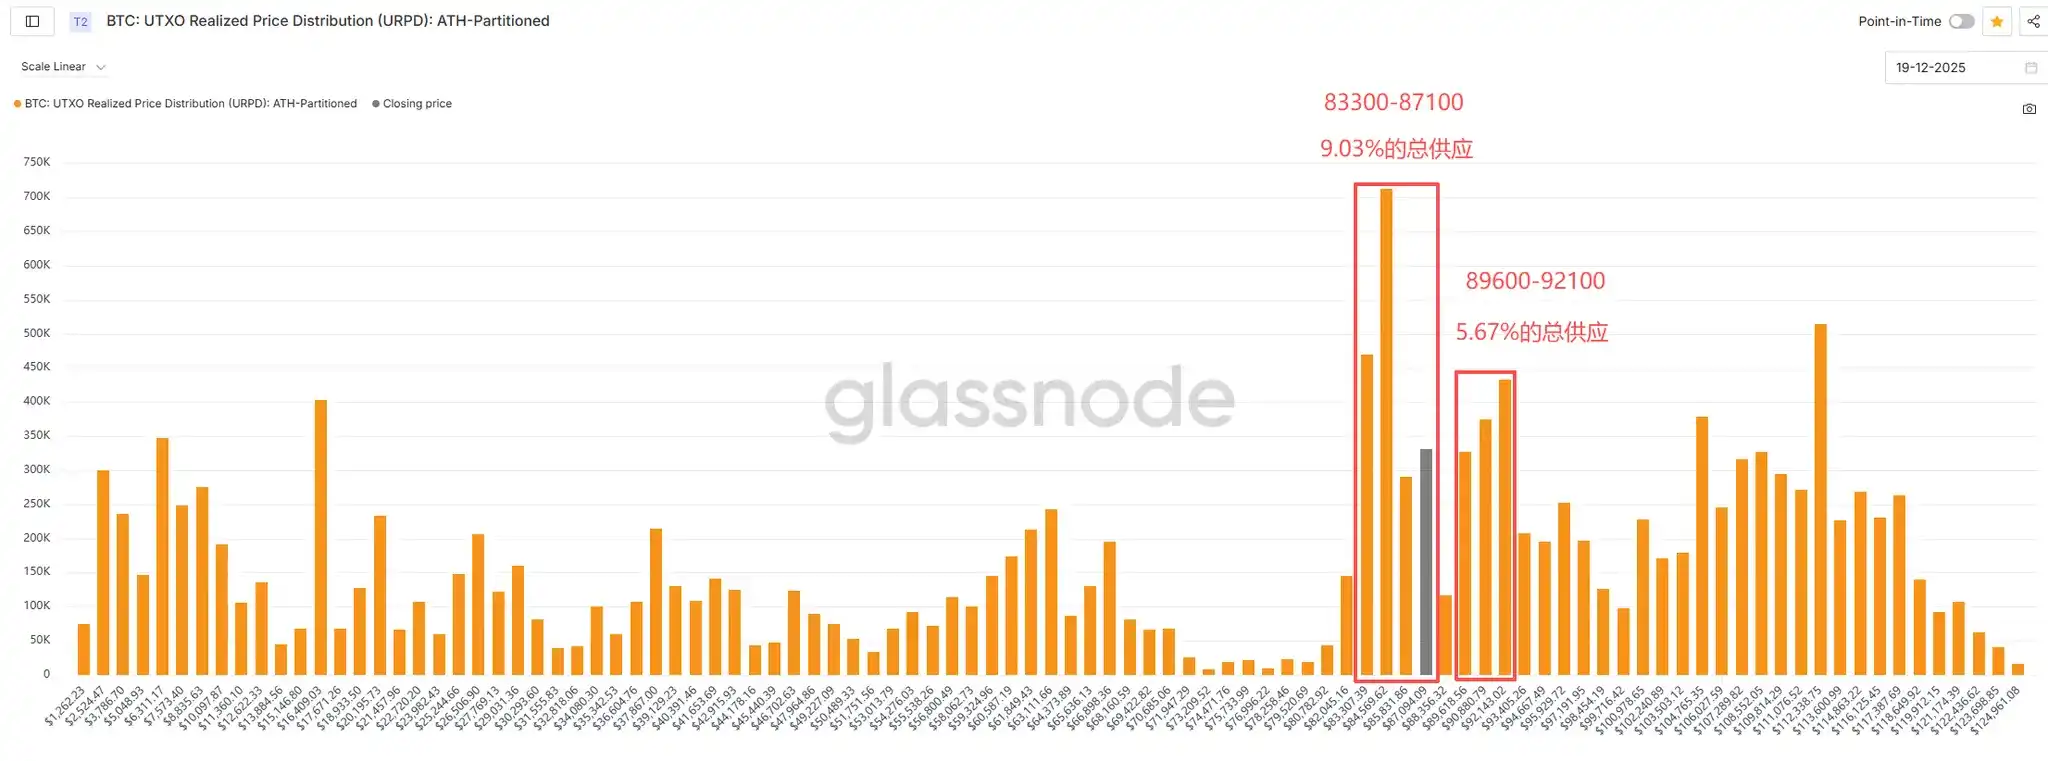
Regarding BTC筹码结构 (chip structure), the accumulation of筹码 in the $83,300-$87,100 price range increased from 9.03% of total supply to 9.93%, a rise of 0.9 percentage points. Specifically, the accumulation near $87,100 reached 3.15% of total supply, showing significant turnover compared to last week and intense battle between bulls and bears. This price level is expected to form strong support going forward.

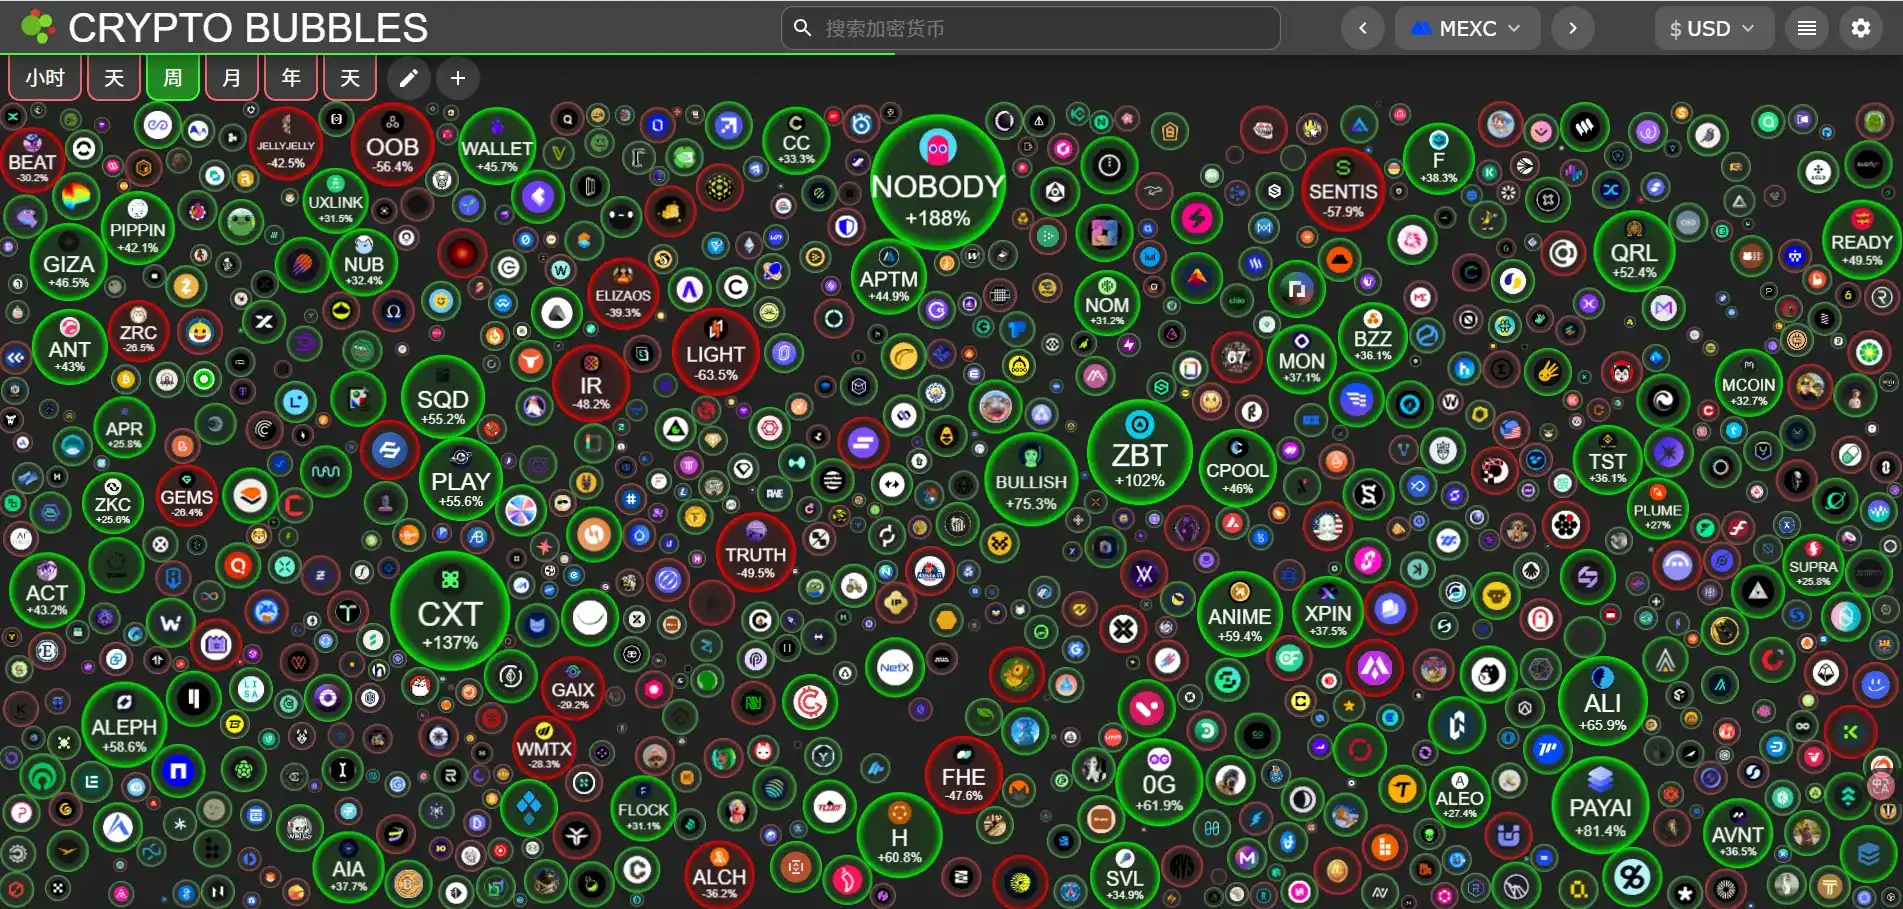
4. Altcoin Market Analysis

This altcoin market analysis will be conducted from three main sections: Market Overview, Secondary Market Performance, and Primary Market Data, providing a comprehensive view of the current altcoin market dynamics.

4.1 Market Overview

Altcoin Market Capitalization

This Friday, TOTAL3 (total market cap excluding BTC and ETH) reached $822.3 billion, a环比 (week-on-week) increase of 1.95%. BTC traded in a narrow range around $88,000 this week, with low volatility. Despite continued rebounds in US stocks and A-shares, BTC did not follow suit, while commodity markets performed strongly. From a fund flow perspective, BTC still ranks lower in traditional financial allocation systems. In the absence of significant incremental funds, it is likely to maintain range-bound fluctuations.

On-Chain TVL Overview

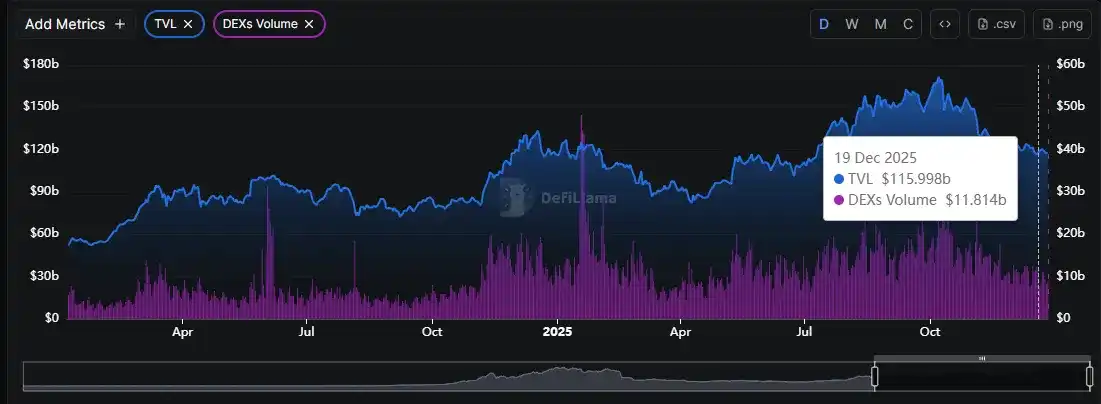
The total on-chain TVL reached $117.5 billion, a环比 increase of 1.29%, showing an overall volatile trend. The amount of ETH staked remained stable, with a trend of fluctuating upward, reflecting relatively solid confidence among long-term holders.

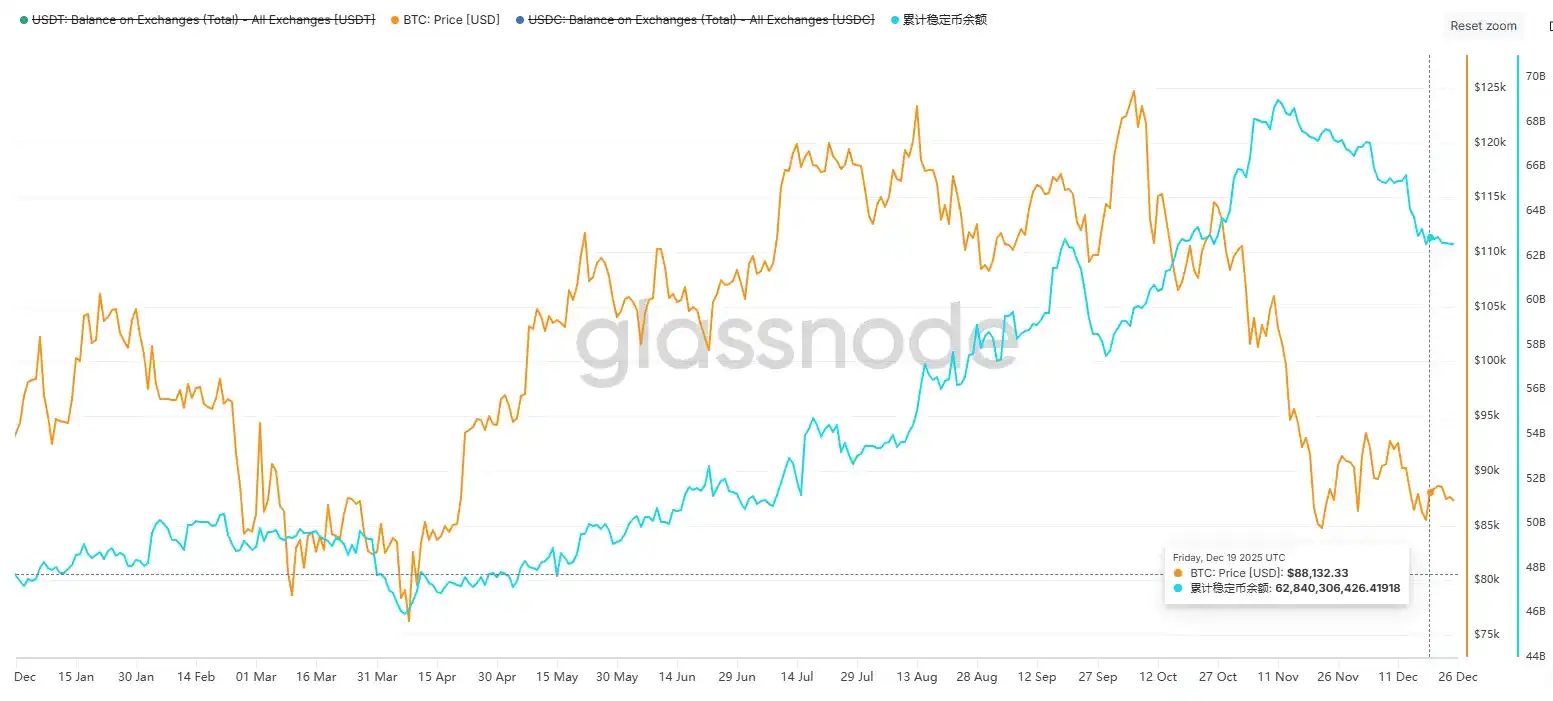
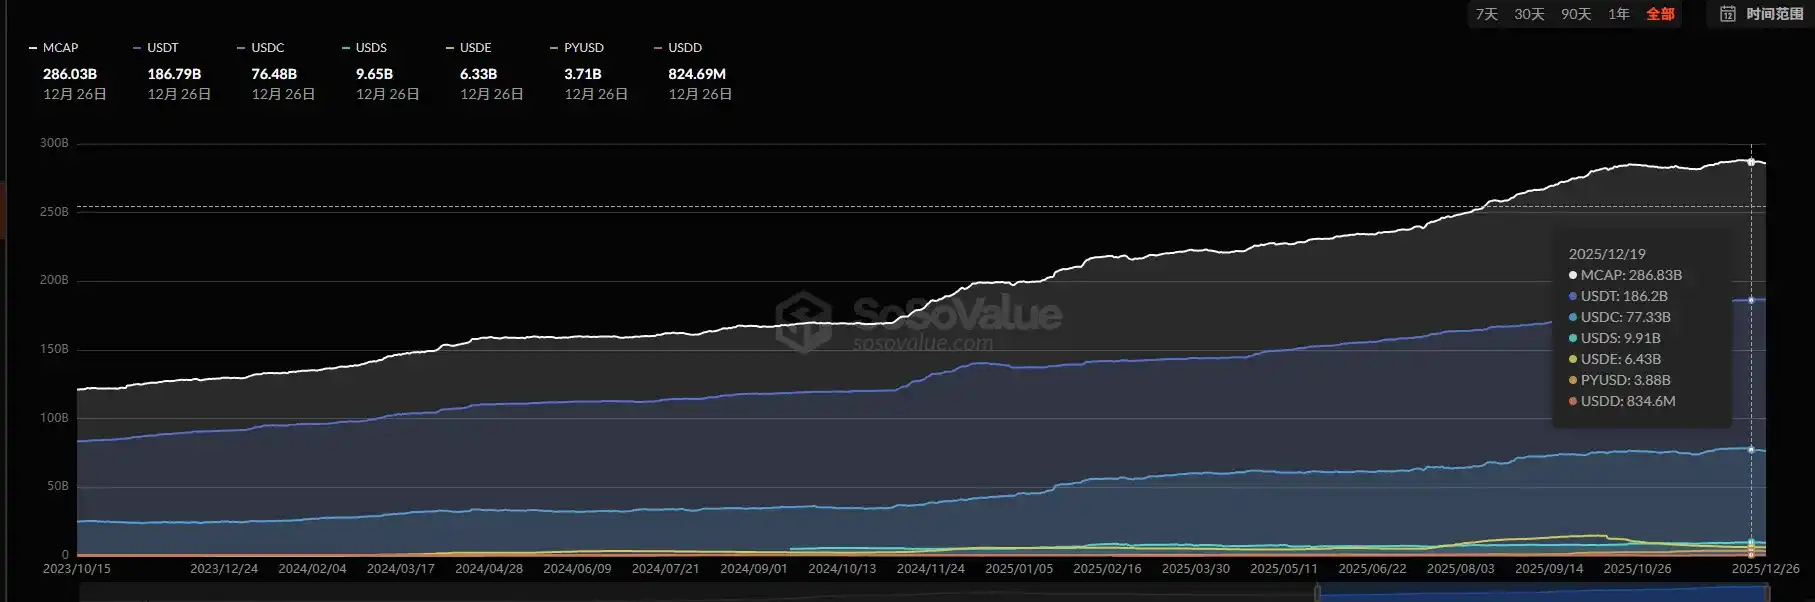
Stablecoin Market Cap and Exchange Reserves

The total stablecoin market cap was $286 billion, a环比 decrease of 0.28%, with fiat-backed stablecoins experiencing a net outflow of $800 million. The current crypto market performance is disconnected from traditional financial markets, showing relative weakness. Market sentiment has not明显恢复 (significantly recovered), with a strong wait-and-see atmosphere. Exchange stablecoin balances slightly decreased this week, and there was no stablecoin inflow during BTC's rebound, indicating the market has not fully stabilized.

<极速div>

Altcoin Index and Market Sentiment

This Friday, the altcoin index was 16. Major altcoins maintained low-level fluctuations, with low market trading activity. The market sentiment index rose to 27, an improvement from last week.个别 (Individual) altcoins performed actively, but overall热度 (heat) was insufficient.

Altcoin Overview

This week, the altcoin market showed an overall volatile pattern, with some tokens逆势走高 (rising against the trend). Benefiting from marginally improved stock market sentiment, the short-term sentiment and downside space of the crypto market received some support. Better-performing tokens were mainly concentrated in small-cap MEME coins and high-profile hot tokens, but the sustainability of the rally was weak, making it difficult to form sector联动效应 (linkage effects).

Top-Selling Indicator and Altcoin Heat

This week, the top-selling indicator did not trigger an alarm, but the proportion of short-term BTC holders increased significantly, approaching the warning threshold. Caution is needed against short-term correction risks. From the perspective of funding rates, most altcoins still had negative rates this week, but overall showed a marginal improvement trend, indicating a slight回暖 (recovery) in market speculation sentiment.

4.2 Secondary Market Analysis

4.2.1 Altcoin Strength Analysis

BTC's market share this week was 65.76%, a环比 increase of 0.1%, maintaining recent high-level fluctuations. Mainstream exchange rate pairs like SOL/BTC, ETH/BTC, and BNB/BTC fluctuated lower this week, overall still in a volatile or volatile downward channel. The weak pattern of altcoins relative to BTC has not significantly changed.

4.2.2 Market Flow

In terms of sector performance, gains and losses were differentiated this week. The RWA and PerpDEX sectors led the gains, becoming the market focus. These two sectors align with long-term market development trends and continue to attract fund attention. Regarding institutional funds, BTC and ETH ETFs continued outflows this week, with no signs of stabilization yet. Data company Bitmine did not conduct relevant purchase operations this week, indicating low institutional participation.

4.3 Primary Market Data Analysis

4.3.1 Status of the Four Major Public Chains

This week, the TVL of the four major public chains showed a slight upward trend, but the increase was lower than the price increase. Among them, ETH TVL rose from $67.2 billion to $68.1 billion, a环比 increase of 1.48%. SOL and BSC TVL remained stable at $8.3 billion and $6.4 billion, respectively. BASE TVL increased from $4.2 billion to $4.4 billion, a环比 increase of 4.76%, performing relatively突出 (outstandingly).

4.3.2 On-Chain Data Analysis

On-Chain Asset Flows

This week, USDT issuance led, while USDC experienced significant outflows. CEX funds continued to withdraw substantially, indicating that short-term market liquidity remains tight. In terms of DeFi bridge asset flows, the ETH chain had the largest net inflow, while the ARB chain had the most outflows. Overall fund flow规模 (scale) was small, and market volatility narrowed rapidly.

On-Chain User Activity and Speculative Sentiment

This week, on-chain user activity was generally average but showed a marginal improvement trend. DEX protocol revenue, active user numbers, and trading volume increased slightly环比, but overall热度 was not high, with limited gains. Market speculative sentiment is still in a low-level repair stage.

On-Chain Boom-Bust Index

Combining the TVL changes of the four major public chains and on-chain data performance, a weighted summary forms the On-Chain Boom-Bust Index (out of 100). The specific range definitions are as follows:

Extreme Prosperity: 80 points and above

Rising Line: 60-79 points

Recession Line: 50-59 points

Bear Market: 30-49 points

Data for this report was compiled and edited by WolfDAO. Please contact us if you have any questions for updates;

Author: WolfDAO( X : @10xWolfdao )

Perguntas relacionadas

QWhat was the key technical support level for BTC mentioned in the article, and how did it perform?

AThe key technical support level for BTC was $85,000. It was tested and held effectively, as BTC touched a low of $84,500 before initiating a rebound, confirming the strength of this support.

QAccording to the stablecoin data, what was the trend in net issuance, and what does it indicate about market funds?

AThe net issuance of stablecoins was negative at -$326 million for the week, indicating a continued outflow of funds. However, the rate of outflow significantly narrowed compared to the previous week, falling from a daily average of -$117.7 million to -$46.5 million, suggesting a 60% improvement in fund flow and correlating with a stabilizing market that did not see sustained declines.

QWhat is identified as a core prerequisite for a trend reversal in the Bitcoin market?

AA return to net inflows for Bitcoin ETFs is identified as the core prerequisite for the market to achieve a trend reversal. The article states that despite a technical price rebound, the continued and expanding net outflows from ETFs prevent a sustainable upward trend.

QWhat does the low OTC premium rate for USDT and USDC suggest about market sentiment?

AThe low OTC premium rates for USDT (97.86%) and USDC (98.36%), which are at yearly lows, suggest that market sentiment remains pessimistic. It indicates a lack of strong buying interest from off-exchange funds and the presence of capital outflows.

QWhat was the overall trend for the altcoin market (TOTAL3), and which types of tokens performed relatively well?

AThe total market cap of altcoins (TOTAL3) increased by 1.95% to $822.3 billion, showing a震荡 (volatile/oscillating) trend. Performance was better among small-cap meme coins and high-profile trending tokens, but the rallies were short-lived and failed to create sustained sector-wide momentum.

Leituras Relacionadas

Top 9 decentralised exchanges to trade on in March 2026

For a long time, crypto trading relied on centralized exchanges, requiring users to trust third parties with their assets. Decentralized exchanges (DEXs) emerged to eliminate intermediaries, allowing users to trade directly from their wallets using smart contracts and on-chain liquidity pools. Here are the top 9 DEXs in March 2026: 1. **Aster**: A multi-chain platform (Ethereum, BNB, Solana, Arbitrum) offering spot and perpetual trading with up to 1001x leverage and low fees. 2. **SushiSwap**: An automated market maker (AMM) operating on 40+ chains, featuring token swaps, limit orders, and cross-chain functionality. 3. **Ostium**: A perpetuals DEX on Arbitrum providing synthetic exposure to forex, commodities, and equities alongside crypto, with up to 200x leverage. 4. **Extended**: A Starknet-based perpetual futures DEX with 75+ markets, off-chain order matching, and on-chain settlement, offering up to 100x leverage. 5. **Reya**: Uses a central limit order book for derivatives trading on Arbitrum Orbit, with portfolio margin and up to 100x leverage. 6. **PancakeSwap**: A multi-chain AMM with 5000+ pairs, supporting spot swaps, limit orders, and perpetual futures via Aster integration. 7. **Curve**: Specializes in low-slippage stablecoin swaps across multiple chains, with deep DeFi integration and governance via CRV. 8. **Ethereal**: A perpetual DEX built around yield-earning USDe collateral, offering up to 50x leverage on its EVM-based appchain. 9. **Aerodrome**: Base network’s leading AMM using a ve(3,3) model to incentivize liquidity provision and reward distribution. DEXs now cater to diverse needs, from simple swaps to leveraged derivatives and synthetic assets. Users should research and start with small positions.

ambcryptoHá 51m

Top 9 decentralised exchanges to trade on in March 2026

ambcryptoHá 51m

Trading

Spot
Futuros

Artigos em Destaque

O que é XMN

I. Introdução ao ProjetoxMoney é uma solução de pagamento em criptomoeda concebida para modernizar a indústria financeira e de pagamentos. Procura resolver os problemas dos métodos de pagamento tradicionais, oferecendo transações instantâneas e liquidações imediatas de cripto para dinheiro para os comerciantes.II. Informações sobre o Token1) Informações BásicasNome do token: XMN(xMoney)III. Links RelacionadosWebsite:https://x.com/xMoney_comExploradores:https://suivision.xyz/coin/0x97c7571f4406cdd7a95f3027075ab80d3e9c937c2a567690d31e14ab1872ccee::xmn::XMNRedes Sociais:https://twitter.com/aztecnetworkNota: A introdução ao projeto provém dos materiais publicados ou fornecidos pela equipa oficial do projeto, que é apenas para referência e não constitui aconselhamento de investimento. A HTX não se responsabiliza por quaisquer perdas diretas ou indiretas resultantes.

195 Visualizações TotaisPublicado em {updateTime}Atualizado em 2026.02.25

O que é XMN

Como comprar XMN

Bem-vindo à HTX.com!Tornámos a compra de xMoney (XMN) simples e conveniente.Segue o nosso guia passo a passo para iniciar a tua jornada no mundo das criptos.Passo 1: cria a tua conta HTXUtiliza o teu e-mail ou número de telefone para te inscreveres numa conta gratuita na HTX.Desfruta de um processo de inscrição sem complicações e desbloqueia todas as funcionalidades.Obter a minha contaPasso 2: vai para Comprar Cripto e escolhe o teu método de pagamentoCartão de crédito/débito: usa o teu visa ou mastercard para comprar xMoney (XMN) instantaneamente.Saldo: usa os fundos da tua conta HTX para transacionar sem problemas.Terceiros: adicionamos métodos de pagamento populares, como Google Pay e Apple Pay, para aumentar a conveniência.P2P: transaciona diretamente com outros utilizadores na HTX.Mercado de balcão (OTC): oferecemos serviços personalizados e taxas de câmbio competitivas para os traders.Passo 3: armazena teu xMoney (XMN)Depois de comprar o teu xMoney (XMN), armazena-o na tua conta HTX.Alternativamente, podes enviá-lo para outro lugar através de transferência blockchain ou usá-lo para transacionar outras criptomoedas.Passo 4: transaciona xMoney (XMN)Transaciona facilmente xMoney (XMN) no mercado à vista da HTX.Acede simplesmente à tua conta, seleciona o teu par de trading, executa as tuas transações e monitoriza em tempo real.Oferecemos uma experiência de fácil utilização tanto para principiantes como para traders experientes.

157 Visualizações TotaisPublicado em {updateTime}Atualizado em 2026.02.25

Como comprar XMN

O que é WARD

I. Introdução ao ProjetoO Warden Protocol é uma blockchain L1 construída de raiz, projetada para que os desenvolvedores construam Aplicações Inteligentes. O Warden cria uma blockchain nativa de IA verificável, onde os modelos são acessíveis a qualquer pessoa e em qualquer lugar, com as suas saídas a alimentarem diretamente aplicações inteligentes.II. Informação sobre o Token1) Informação BásicaNome do token: WARD (Warden Protocol)III. Links RelacionadosWebsite:https://wardenprotocol.org/Exploradores:https://bscscan.com/token/0x6dc200b21894af4660b549b678ea8df22bf7cfacRedes Sociais:https://x.com/wardenprotocolNota: A introdução ao projeto provém dos materiais publicados ou fornecidos pela equipa oficial do projeto, que é apenas para referência e não constitui aconselhamento de investimento. A HTX não se responsabiliza por quaisquer perdas diretas ou indiretas resultantes.

217 Visualizações TotaisPublicado em {updateTime}Atualizado em 2026.02.25

O que é WARD

Discussões

Bem-vindo à Comunidade HTX. Aqui, pode manter-se informado sobre os mais recentes desenvolvimentos da plataforma e obter acesso a análises profissionais de mercado. As opiniões dos utilizadores sobre o preço de A (A) são apresentadas abaixo.

活动图片

Categorias popularesright-arrow

Etiquetas Popularesright-arrow