[Key interpretation] Only 9500 BTCs were traded in large amount, and SNX began to rise

JinsPublicado em 2022-12-07Última atualização em 2022-12-08

Resumo

Low price fluctuation of btc

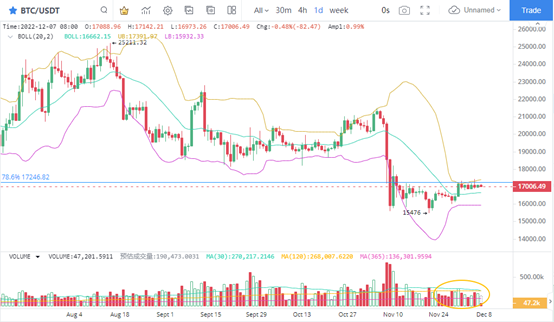
1. The trend of BTC is still low

BTC stopped near the key resistance level. The horizontal market has been running for 7 trading days, and there is still no sign of upward breakthrough. For the pressure level of USD 17246 corresponding to 78.6% of Fibonacci, BTC's current trading volume has not been enlarged, which means that the bull action is limited. Considering the sluggish performance of the main players in the chain transfer recently, the market is still in a state of adjustment.

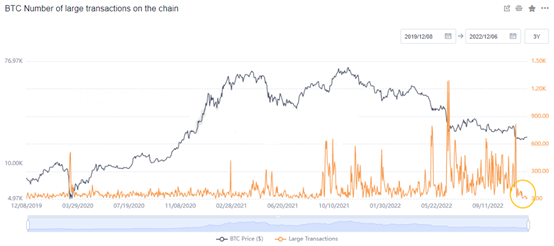
2. Downward transfer on the chain

The activity of BTC chain transfer is obviously at a low level. In particular, the number of major large amount transfers is limited, and the market is still in a downturn. Numerically, the number of large transactions on December 6 was only 19, with 9500 BTCs. Judging from this, the BTC price trend still tends to adjust. Moreover, in the absence of major large transfers, the market changes are more noteworthy.
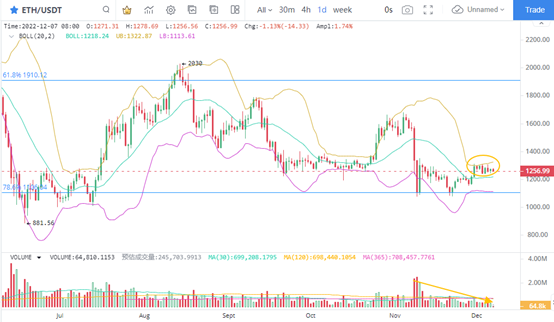
3. ETH retraction

With the retreat of ETH short line, the price has peaked on the Bollinger line. At present, the ETH price trend is stable, but the trading volume in the daily K line chart shrinks significantly, which is a negative factor for the price rise. It is noteworthy that the decline of trading volume in ETH's daily K line chart has begun since June 2022. At present, the shrinkage of trading volume is synchronized with the downturn of price trend, and the market is in the adjustment stage.

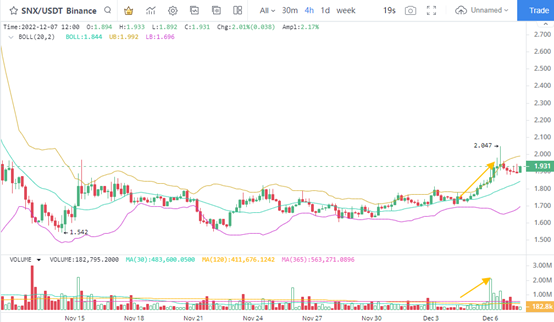
4. SNX brewing rises again

From the 4-hour K map, SNX is currently in the early stage of the second floor elevation. In the 4-hour K line chart, 11 positive lines of rising prices appeared, indicating that the market is in the start-up stage. At the same time, the trading volume also reached above the isoline during the continuous recovery, which means that the SNX short-term start signs are clear. After the withdrawal, SNX is expected to regain its upward momentum.

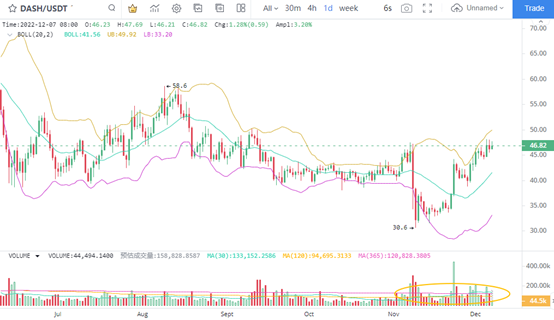
5. DASH before discharge

The daily K line chart of DASH shows that, on the premise of stable volume and price, DASH ushered in a short-term rebound of 56%. From the perspective of DASH's trading volume performance, it is a good period since 2022. The trading volume remained active, while the price rebounded to a short-term high, and the signs of its low reversal were gradually confirmed.

Leituras Relacionadas

Bitcoin Trading Strategy Breakdown: Celebrity Predictions and Classic Models All Fail, Only These Four Indicators Remain

Analysis of Bitcoin Trading Strategies: Why Celebrity Forecasts and Classic Models Fail, Leaving Only These Four Reliable Indicators This analysis examines the failure of common Bitcoin prediction methods and identifies four reliable indicators for constructing a trading strategy. The author reviewed all major BTC prediction approaches from 2017-2025, categorizing them into three groups: celebrity price targets (consistently over-optimistic), analytical models like Stock-to-Flow (broken post-2022), and on-chain signals. The key finding is that more data often creates confusion, not clarity. The strategy discards unreliable elements: celebrity predictions (incentivized to be extreme), pure models (invalidated by post-ETF market changes), and the Fear & Greed Index used alone (too many false signals). Four reliable indicators were selected: 1. **MVRV Z-Score:** Accurately identifies cycle bottoms when entering its green zone (e.g., 2018, 2020, 2022). Note: Its ability to call tops is now ineffective post-2024. 2. **SOPR (28-day MA):** Consistently signals bottoms when below 1.0, indicating holders are selling at a loss. 3. **ETF Net Flow:** A crucial post-2024 metric showing institutional momentum (e.g., sustained inflows = buying). 4. **Macro Liquidity (Fed policy & M2):** Sets the overall directional bias (e.g., bullish during easing cycles). The core strategy involves waiting for a multi-signal共振 (resonance). For example, a bottom signal requires MVRV in the green zone + SOPR < 1.0. A top signal requires overheated on-chain data + sustained ETF outflows. Macro policy sets the overall direction. The Fear & Greed Index is only used as a weighted confirmatory signal, never alone. Action is only taken when three or more indicators align. The author automated this into a monitoring system that sends Telegram alerts only when signals trigger. As of the article's date (April 15, 2026), the system showed a strong bottom signal: extreme fear (F&G=12), MVRV in the buy zone, and SOPR < 1.0. The only contrary signal was weak ETF flows. Historically, such triple on-chain共振 has preceded 100%+ returns. The conclusion emphasizes building a personal framework over relying on external predictions, allowing for iterative improvement and customization based on individual risk tolerance.

marsbitHá 2h

Bitcoin Trading Strategy Breakdown: Celebrity Predictions and Classic Models All Fail, Only These Four Indicators Remain

marsbitHá 2h

Trading

Spot
Futuros
活动图片