Bitcoin: A-Z of how the king coin fared following FTX’s proposed acquisition

AmbcryptoPublicado em 2022-11-10Última atualização em 2022-11-10

Resumo

Binance CEO Changpeng Zhao’s confirmation of the intended FTX acquisition sent the market spiraling downwards on 8 November. Bitcoin [BTC], the leading cryptocurrency, wasn’t spared post this market event. BTC traded momentarily below the $17,500 price market, its lowest market price in the last two years.

Binance CEO Changpeng Zhao’s confirmation of the intended FTX acquisition sent the market spiraling downwards on 8 November. Bitcoin [BTC], the leading cryptocurrency, wasn’t spared post this market event. BTC traded momentarily below the $17,500 price market, its lowest market price in the last two years.

""

According to Santiment, the momentary blow to BTC’s price pushed “overzealous traders on exchanges” to attempt to short the king coin. For example, data from the on-chain analytics platform revealed that leading cryptocurrency exchange DyDx logged its highest ratio of bets against BTC’s price since August. Likewise, troubled FTX saw its highest ratio of bets against the king coin’s price since June.
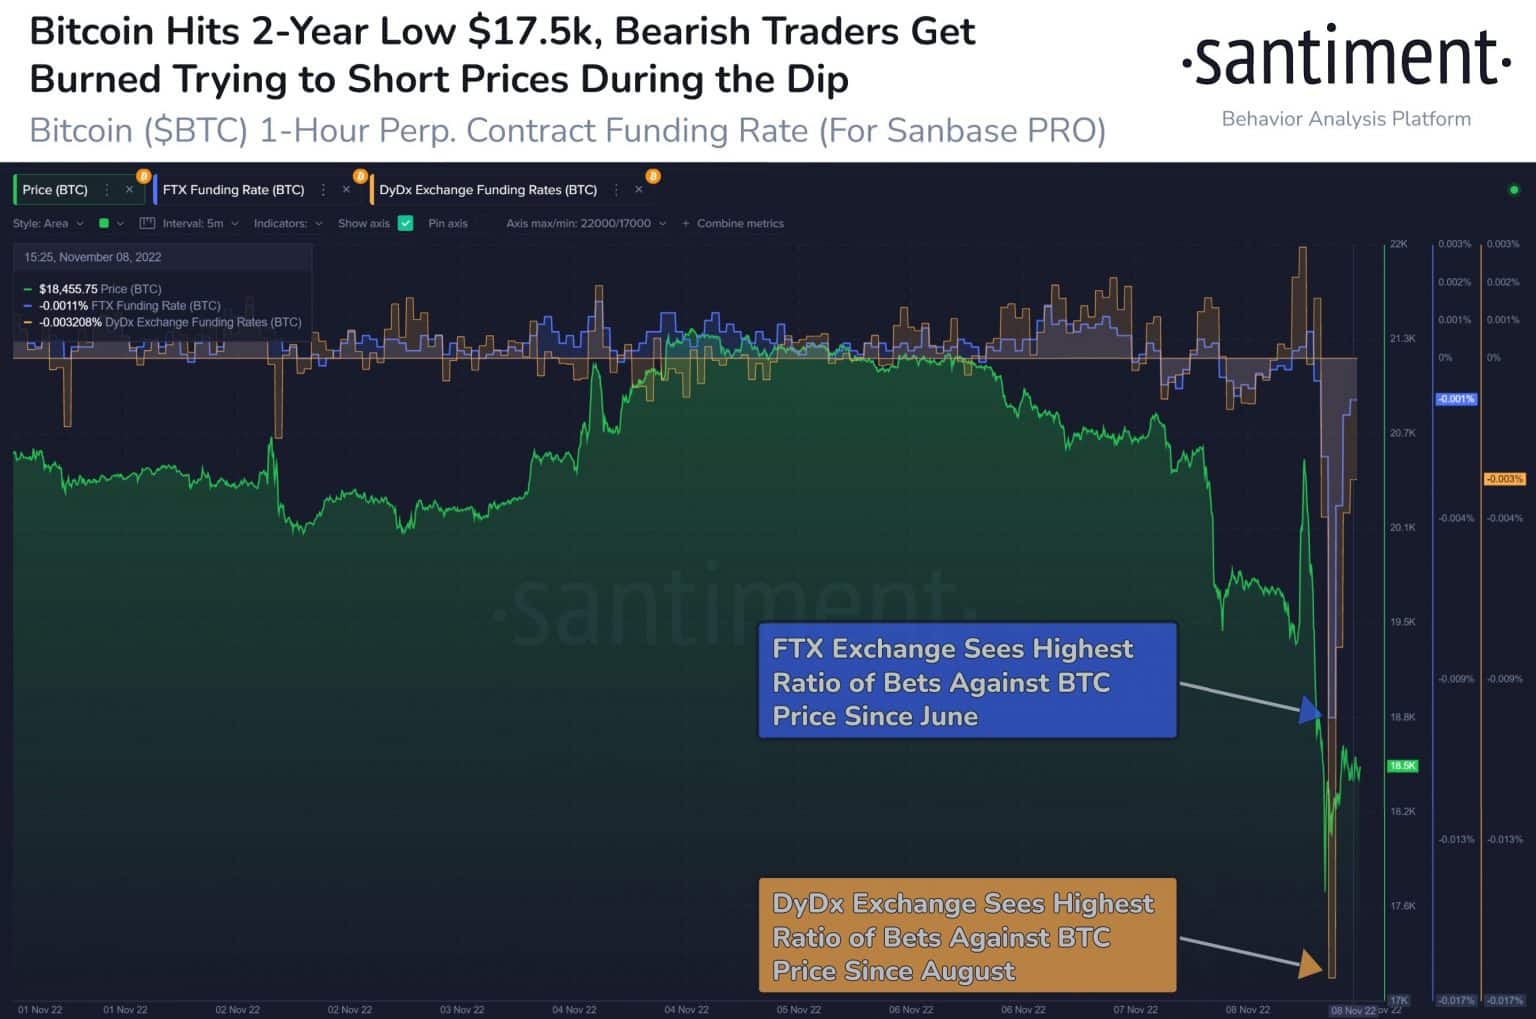
Source: Santiment

""

To the dismay of many short traders, BTC’s price recovered to trade at $18,325.75 at press time. This resulted in liquidations. Per data from Coinglass, of the $713.91 million removed from the cryptocurrency market in the last 24 hours, BTC liquidations stood at $232.38 million. This represented over 30% of BTC removed the cryptocurrency market in the last 24 hours.

""

Uneasy lies the head

""

At the time of writing, BTC’s price was down by 7% in the last 24 hours. While its trading volume rallied by 78.93% in the last 24 hours, the price/trading volume disparity hinted at buyers’ inability to support any further price rally in the current market.

""

As the market wades through the impact of FTX insolvency, CryptoQuant analyst Dan Lim warned that it might be imperative to “keep an eye on the movements of miners, especially their bitcoin holdings, mining, etc.”

""

According to Lim, miners generally believe in the possibility of a price rise, so they mine a lot. As a result of this, BTC’s hash rate climbed. However, miners started to lose as the king coin’s price traded sideways.
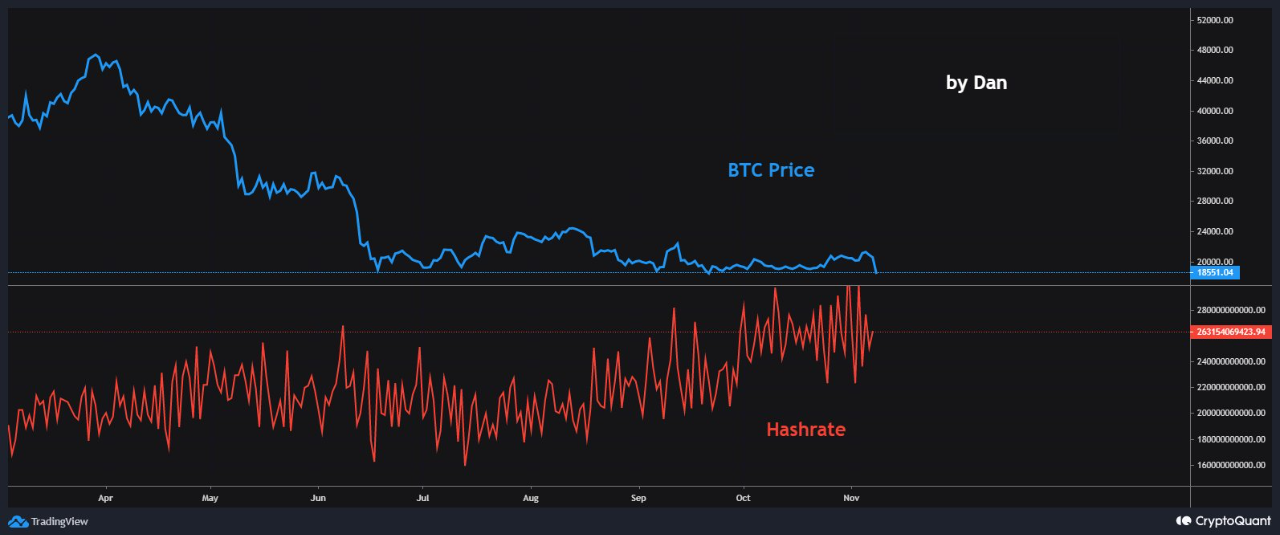
Source: TradingView

""

On a daily chart, selling pressure rallied significantly. As a result, BTC was oversold at the time of writing. Its Money Flow Index (MFI) was 21, while its Relative Strength was no better in a downtrend at 34.

""

In addition, its Chaikin Money Flow (CMF) chased new lows below the central line at -0.03, indicating that sellers had control of the BTC market.
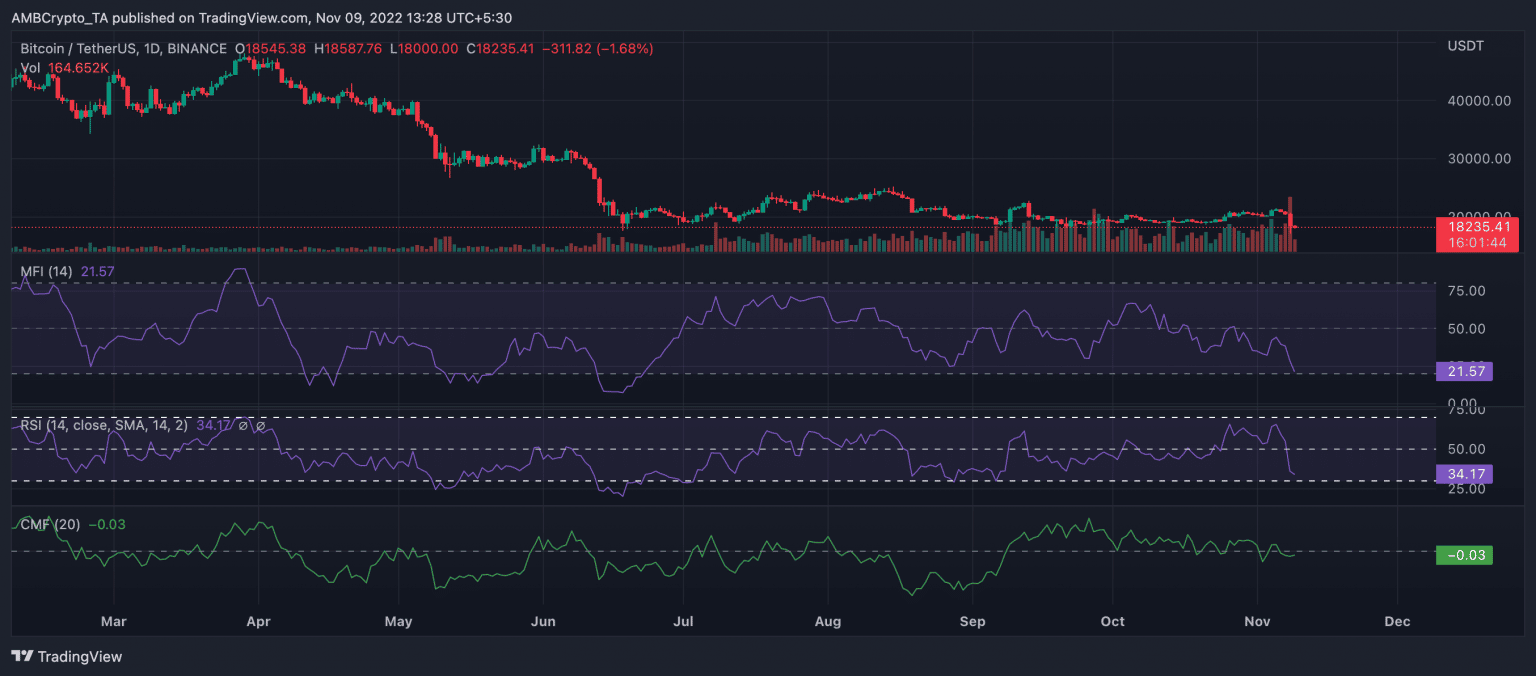
Source: TradingView

""

However, CryptoQuant analyst BinhDang assessed BTC’s Spent Output Value Bands metric in three value bands [(10-100), (100-1K), and (1K-10K)] and found that sellers would soon tire out.

""

According to BinhDang: “In 3 previous deep declines, based on the volume oscillator and 7DMA, the participation and increasing selling pressure were shown in all three value bands. However, yesterday’s test’s participation declined significantly, even weakly, in the two bands (100-100)(100-1K). Besides, The Estimate leverage Ratio & O.I has also cooled down to the same level as the deep drop in June. This may indicate that the selling power is almost exhausted.”

Leituras Relacionadas

Rented Faith: How Much of the Bitcoin ETF Inflows Is Real Money?

"Rented Conviction: How Much of Bitcoin ETF Flows Is Real Money" The weekly inflows into Bitcoin ETFs are often interpreted as a gauge of institutional belief. However, a significant portion of this activity is driven by a hidden arbitrage trade, not directional conviction. The core mechanism is a cash-and-carry arbitrage: traders buy spot Bitcoin (often via ETFs) while simultaneously shorting CME futures to lock in the price difference, or "basis." This delta-neutral trade is essentially an interest rate play. In weekly data, about half the fluctuation in ETF flows can be explained by new short positions added by leveraged funds (hedge funds), with a correlation of 0.70. Bitcoin's price movement in a given week shows no statistical power in predicting these flows. While this arbitrage trade drives weekly *volatility*, it is not the main component of the cumulative *stock*. Of the total ~$55 billion in net ETF inflows, the current net arbitrage position is only about $1 billion. The remainder is steady, directional buying averaging ~$400 million per week, which constitutes the vast majority of the accumulated "mountain" over two years. Thus, ETF flow data overstates the *volatility* of conviction, not its *level*. This arbitrage trade has been unwinding for nearly two years. Leveraged fund short positions peaked at ~$14 billion in late 2024 and have since declined to ~$4.5 billion. When the basis compresses to unprofitable levels, ETF inflows and short positions retreat together. Recent outflows should not be mistaken for a loss of faith but rather the routine unwinding of this rate trade. For Ethereum ETFs, the pattern is weaker. Accounting for staking yield makes the basis often negative, so neither strong conviction buying nor robust arbitrage supports its flows. To interpret ETF flows correctly, monitor the CME basis versus T-bill rates and leveraged fund net shorts. They reveal how much of the next "demand" headline is real. The real, patient buy-and-hold demand is what constitutes the enduring bulk of ETF assets.

marsbitHá 17m

Rented Faith: How Much of the Bitcoin ETF Inflows Is Real Money?

marsbitHá 17m

Soaring Over Tenfold Within the Year: The Frenzy Over SK Hynix Leveraged Products

South China Morning Post The leveraged ETF tracking SK Hynix has surged over tenfold year-to-date, fueled by intense market speculation on the memory chip sector. By June 22, the value of the 'South Korea 2x Long SK Hynix ETF' listed in Hong Kong had skyrocketed by more than 1,061% since the start of the year, while its asset size exploded over twenty times from the end of last year. The rally is driven by AI-driven demand for high-bandwidth memory (HBM), with SK Hynix recently sampling its next-generation HBM4E product. However, industry professionals warn of significant risks. Leveraged ETFs magnify both gains and losses. During a recent market correction, while the underlying SK Hynix stock fell 19.1%, its double-leveraged ETF dropped nearly 38%. Korean regulators noted that such products could theoretically lose 60% in a single day. Additionally, these ETFs face risks like time decay in volatile markets, liquidity spirals during mass redemptions, and extreme price dislocations from market-making failures, as seen in early June when an ETF moved opposite to its underlying stock. The trading is predominantly driven by retail investors, with institutional capital largely absent due to the products' high volatility. Analysts caution that with the semiconductor sector at elevated valuations and facing geopolitical and supply chain uncertainties, leveraged ETFs pose a substantial threat of amplified losses for uninformed investors.

marsbitHá 1h

Soaring Over Tenfold Within the Year: The Frenzy Over SK Hynix Leveraged Products

marsbitHá 1h

18 Months, Over 50x Surge: KIOXIA's Epic Comeback

KIOXIA, a NAND flash memory giant, staged a dramatic comeback driven by AI demand. After a period of significant losses, a failed merger, and missed HBM opportunities, its 2024 IPO began modestly. However, fueled by explosive demand for AI data storage, its stock price skyrocketed over 50 times within 18 months, making it Japan's most valuable company, surpassing Toyota. Its Q1 FY2026 profit guidance soared 30-fold year-over-year, with 2026 NAND capacity already sold out. Key to its success is its 3D NAND technology, BiCS FLASH. As the inventor of NAND, KIOXIA advanced its technology through generations, reaching over 200 layers by 2023. Key innovations include CBA (CMOS directly Bonded to Array), which separately manufactures control circuits and memory arrays for better performance, and OPS (On Pitch Select Gate) to increase density. The company is now developing high-capacity packages like an 8TB solution stacking 32 dies. Looking beyond NAND, KIOXIA is exploring 3D DRAM with its OCTRAM technology, using oxide semiconductor transistors for ultra-low leakage to reduce power consumption. This fundamental research differs from HBM and represents a long-term bet to extend its 3D expertise from NAND into future DRAM architectures. KIOXIA's story highlights how technological assets and shifting market cycles can rapidly transform a company's fortunes. While questions remain about sustaining growth beyond the current AI boom, its resurgence demonstrates that in semiconductors, being down does not necessarily mean being out.

marsbitHá 1h

18 Months, Over 50x Surge: KIOXIA's Epic Comeback

marsbitHá 1h

Market Trends in U.S. Stocks (June 23): Peak at Listing? SpaceX Loses Over $800 Billion in Three Days, Tech Stocks Experience Severe Internal Divergence

Stock Market Trends (June 23): Did SpaceX Peak at IPO? The company loses over $800 billion in market value in three days as a sharp divergence unfolds within the tech sector. SpaceX's post-IPO decline of over 20%, falling below its first-day close, reflects a swift market repricing. The catalyst is a clear shift in narrative from "AI platform potential" to concerns over rising capital costs, as its $8.57 billion IPO and subsequent $20 billion debt offering are earmarked for acquisitions and refinancing existing bridge loans rather than de-leveraging. While high-valuation tech stocks like Google, Meta, Amazon, and Microsoft faced pressure, Micron surged nearly 7% to a record high following a strategic supply deal with Anthropic for HBM and memory, highlighting robust, tangible demand in AI infrastructure. The broader market saw funds rotate into more defensive industrial and financial names. Macro factors included a dip in oil prices to a three-month low on news of a US-Iran framework deal, though logistical hurdles for resuming full Strait of Hormuz shipments remain. Key events ahead include Nvidia's shareholder meeting, Micron's earnings, and the May PCE inflation data. The latter will be crucial in determining whether the sell-off in high-valuation growth stocks, which appears to have just begun, will persist.

marsbitHá 1h

Market Trends in U.S. Stocks (June 23): Peak at Listing? SpaceX Loses Over $800 Billion in Three Days, Tech Stocks Experience Severe Internal Divergence

marsbitHá 1h

Trading

Spot
Futuros
活动图片