[Key interpretation] BAND increased 70% of its main positions, and BTC's spot trading volume accounted for a sharp increase,

HuobiPublicado em 2022-11-04Última atualização em 2022-11-07

Resumo

BTC has a strong price elasticity and plans to make a breakthrough.

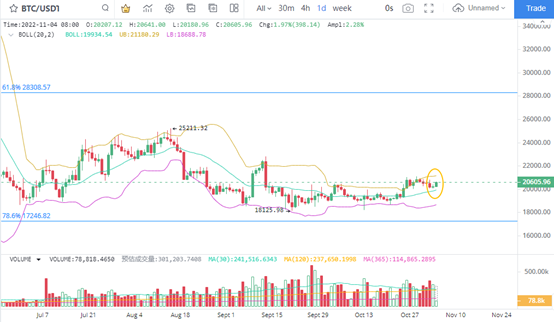
1. BTC continues to recover

The daily K line chart shows that the BTC price started to rebound after reaching the middle track of the Bollinger Line, and the typical large-scale upward trend growth is confirmed. Recently, although the Federal Reserve has raised interest rates, it has little impact on BTC prices. Since the BTC's large-scale operation status has not changed much, the judgment of rebound remains unchanged. While paying attention to the short-term pressure level of $22500, pay attention to the large range rebound profit opportunity of $28308 above.

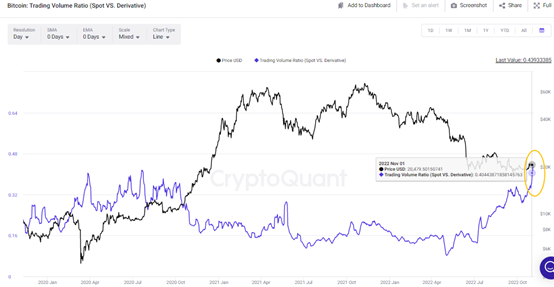
2. BTC Investors Focus on Spot Trading

After the confirmation of BTC bottom was extended for a long time, the buying and selling enthusiasm of spot traders was also growing, which led to positive changes in BTC prices. From the change of the ratio between spot trading volume and contract trading volume, the value has reached 0.439 on November 3. After the ratio of spot trading volume to contract trading volume reached 0.082 on May 2, the current value has returned to a high of 0.439, which is higher than 0.41 in July 2021. This shows that the spot price has a low absorption trading opportunity, and investors tend to buy in the spot market rather than contract trading.

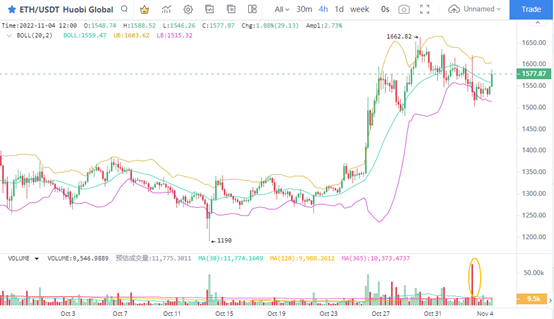
3. ETH support is effective

The 4-hour K line chart shows that the ETH price is in good shape. The recent price correction period saw a large volume on November 3, and the rebound period saw ETH hit below $1600. ETH rebounded and rose along with BTC price. At present, the contract position is still at a short-term low level, which can confirm that investors are still keen on spot trading, making ETH price have a strong foundation.

4. BAND soars and the main force escapes

BAND has stabilized and recovered in the short term, and the price has risen rapidly. It only takes 28 hours to reach a maximum of $3.199 in the 4-hour K line. In terms of amplitude, BAND short-term fluctuation reached 183%. From the perspective of the main trading method, the price fluctuation of a large-scale test plate on June 9 reached 53%, while the price fluctuation on July 29 reached 35%, which is the second test plate. On November 3, the first 4-hour TULA BAND of the main force rose by 14%, so the next price rise will be more smooth.

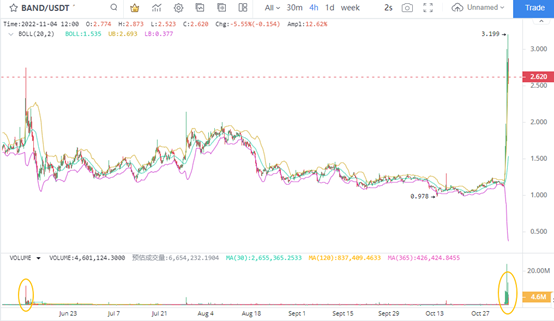
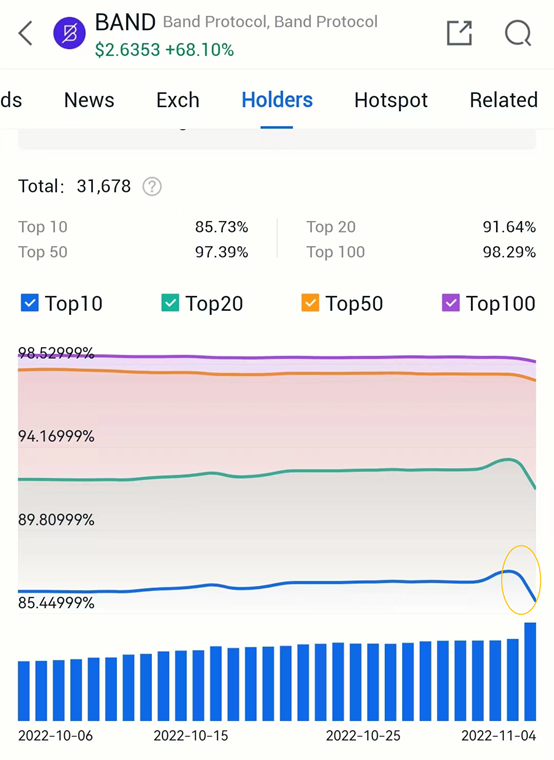
5. Main position reduction of BAND

In fact, after the main force raised the price this time, it also prompted the shipping signal. The top 10 major holders of coins dropped from a short-term peak of 87.07% to a low of 85.73%. In terms of value, the top 10 major players in holding coins completed trading action by reducing positions by 1.34 percentage points. Therefore, the main force of this time is still characterized by price increase and position reduction. In particular, when BAND reached a peak value of more than $2.5, there was an obvious sign of large-scale position reduction.

Leituras Relacionadas

Report Interpretation: J.P. Morgan Details Micron's Pre-Earnings Sentiment, Current Hardware Sector Dynamics

Morgan Stanley analyst Joshua Meyers' report (June 21, 2026) highlights key trends in the hardware and semiconductor sector ahead of Micron's earnings. The core takeaways are: 1. **Micron & Memory:** Memory remains a high-conviction long theme, driven by strong AI demand and rising ASPs. However, investor focus is shifting to the sustainability of Micron's >80% gross margins and the specifics of potential new long-term supply agreements (SCAs). 2. **Hardware Supply Chain:** AI-related demand for servers, networking, and storage remains robust, but company performance is diverging. Celestica (CLS) shows improved margin confidence, Western Digital and Seagate benefit from pricing, Fabrinet (FN) sees predictable AI optics growth, and Teradyne (TER) anticipates a new Google customer. 3. **AI Capex & WFE Forecasts:** JPMorgan increased its Wafer Fab Equipment (WFE) market growth forecasts to 28% in 2026 and 29% in 2027. AI infrastructure financing is evolving, with higher project-level debt reducing constraints on capex expansion. The report signals that while the AI-driven hardware cycle is strong, the market is entering a phase focused on execution verification (e.g., Micron's SCA details, Fabrinet's ramp with Amazon) and valuation sustainability. Key near-term signals include Micron's guidance, Arista Networks' outlook, and the pace of demand normalization post potential tariff-related pull-ins.

marsbitHá 8h

Report Interpretation: J.P. Morgan Details Micron's Pre-Earnings Sentiment, Current Hardware Sector Dynamics

marsbitHá 8h

Research Report Analysis: The Fed's New Chair's Debut – New Leader, But Same Script?

Report Analysis: Federal Reserve's New Chair Debut – A New Captain, But the Same Script? Morgan Stanley's chief global economist Seth B. Carpenter analyzes the first FOMC meeting under new Fed Chair Kevin Warsh in a June 21 report. Warsh deliberately avoided providing forward guidance on interest rates, aligning with his philosophy. However, market expectations for a rate hike this year were reinforced. Key signals lie elsewhere: inflation may fall more than expected, and quantitative tightening (QT) could be more aggressive than anticipated. The FOMC's "dot plot" suggests only one rate hike in 2026. Carpenter argues that if inflation undershoots forecasts, the logic for even a single hike weakens, especially as projections indicate potential rate cuts in 2027. On QT, Warsh's stance is clear. Carpenter notes that measures like halving the Treasury's account balance could shrink the Fed's balance sheet by around $500 billion with minimal market impact. Combined with adjustments to reserve interest and liquidity rules, the ultimate QT scale may exceed expectations, though its market effect might be less disruptive unless the Fed actively sells Mortgage-Backed Securities (MBS). While Warsh initiated a review of the Fed's policy framework, the 2% inflation target remains intact for now. The report concludes that the market may be overestimating the significance of reduced forward guidance and the near-term rate hike risk, while potentially underestimating the scope and manageable nature of the coming balance sheet reduction. The key debates will hinge on upcoming core PCE data, the specifics of the QT path, and the framework review's findings.

marsbitHá 8h

Research Report Analysis: The Fed's New Chair's Debut – New Leader, But Same Script?

marsbitHá 8h

Critical Game Week: BTC Retracement Confirmation vs. HYPE Support Battle | Guest Analysis

This weekly analysis outlines a critical juncture for BTC and HYPE markets, focusing on key price level confirmations. **BTC Analysis:** BTC is at a pivotal point after a five-wave rally from the June 5th low of $59,100. The price has broken below a short-term rising channel's lower boundary, with the current move seen as a pullback to test this breakdown. Failure to reclaim this level could lead to a retest of the $59,000-$60,000 support zone. The core scenario hinges on this channel retest outcome. * **Key Levels:** Resistance at $64,500-$65,000 (channel boundary) and $69,500-$70,500. Support at $59,000-$60,000 and $55,000. * **Strategy:** A core bearish stance is maintained (20% short from last week), with short-term plans for tactical trades. Three detailed contingency plans (A/B/C) are provided for short positions on resistance tests or breakdowns, emphasizing strict stop-loss discipline. **HYPE Analysis:** HYPE shows strong momentum but is currently in a corrective phase after hitting a new high of $76.94. The price is retesting the crucial $64-$66 support area. * **Key Levels:** Resistance near $77 and $80-$82. Support at $64-$66 and $52-$54. * **Strategy:** The short-term approach is "buy on dips, avoid chasing rallies." A long position is considered only if clear stabilization signals appear at the $64-$66 or deeper $52-$54 support zones, with tight risk controls. **General Risk Management:** A standardized trailing stop-loss protocol is emphasized: set initial stop, breakeven at +1% profit, then trail stops upward to lock in gains. *Disclaimer: All analysis is presented as a personal trading framework, not investment advice. Market conditions are complex and require dynamic adjustment.*

marsbitHá 8h

Critical Game Week: BTC Retracement Confirmation vs. HYPE Support Battle | Guest Analysis

marsbitHá 8h

Trading

Spot
Futuros
活动图片