Advanced Metrics for DeFi Project Analysis

cryptoslatePublicado em 2022-03-09Última atualização em 2022-03-09

Resumo

Data is our best bet to understand the past, present, and future. 

Data is our best bet to understand the past, present, and future. 

In traditional finance, obtaining data is relatively difficult. On the other hand, the blockchain has broken barriers to data, giving everyone access to a giant ledger of information. However, the amount of available data has created another problem: Finding valuable information is complicated.

There are dozens of tools out there to help people analyze DeFi data with a variety of metrics. However, these metrics are mostly quite basic. In this article, we will introduce the most useful metrics as well as the more advanced data available on Footprint Analytics’ upcoming tool, DeFi 360,

Basic Data

  • TVL

TVL is usually the first metric people look at and it reflects the total value of all assets locked by users. TVL growth is often used to judge whether the project is in an upward trend.
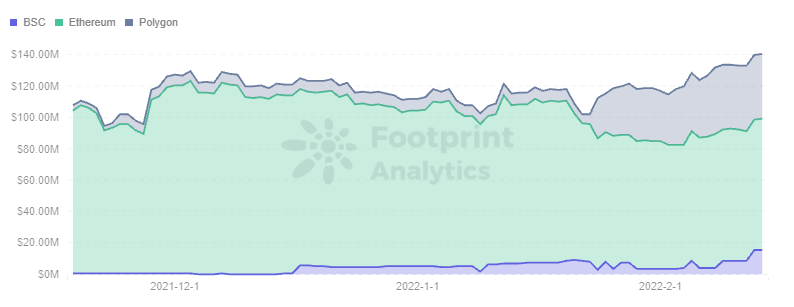
Footprint Analytics - TVL Trend

Footprint Analytics – TVL Trend

TVL is measured in dollars. Since cryptocurrency prices change rapidly, it is difficult to see whether the rise or fall in TVL is due to the price change or the addition of more investments. Therefore, in addition to the TVL, it is also necessary to pay attention to the adjusted TVL.

For example, statistics from Footprint Analytics show that TVL in ETH of Liquity (a lending program that can only lock ETH to lend out stablecoins) is slightly down in the black frame of the chart below, while TVL in USD is increasing. This is due to the rising price of ETH, which creates the illusion that the project is on an upward trend.
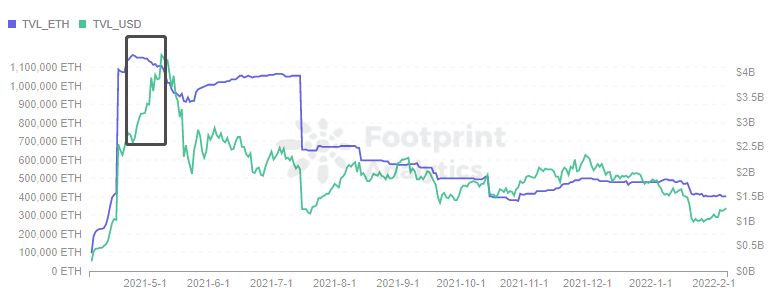
Footprint Analytics - TVL in ETH vs USD

Footprint Analytics – TVL in ETH vs USD

Complex projects like Aave and Yearn, which offer both lock and lend functions, complicate the use of TVL as a metric and necessitate combining it with others. 

  • Net Liquidity

Net liquidity refers to the change of inflow and outflow from the previous day or month. The changes can be further analyzed in terms of both inflow and outflow, and whether the main source is user entry or loss.

  • Revenue 

DEX-based protocols cannot be measured by TVL alone since swaps also generate revenue. The ultimate goal of these types of projects is to maximize profitability and revenue reflects their operating results.
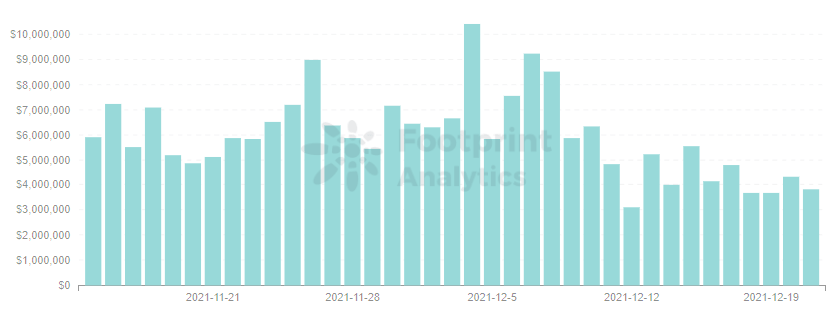
Footprint Analytics - Revenue

Footprint Analytics – Revenue

Token Data

Most platforms issue governance tokens and some use a two-token model. Token data is somewhat reflective of the market’s acceptance of the platform.

  • Basic Information

The price is the most intuitive metric, and the rise and fall is closely related to the supply and demand in the market. The price is also the fastest metric to be affected when a significant event occurs. For example, Cream faced its second major attack on Oct. 27, losing 130 million. This caused the price of CREAM to fall off a cliff.
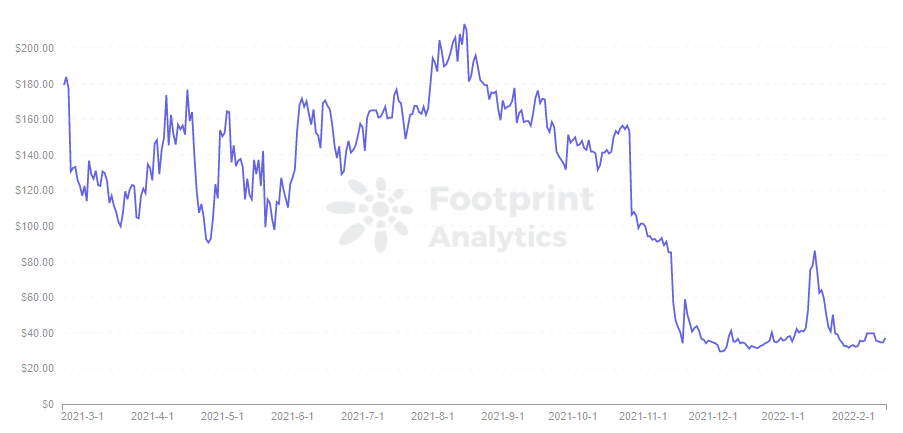
Footprint Analytics - Token Price - CREAM

Footprint Analytics – Token Price – CREAM

For those issuing dual tokens such as MakerDAO and Liquity, monitoring the number of DAIs and LUSDs minted can also reflect the degree of user participation.

The market cap of a token is the multiplication of the price and the circulating supply, reflecting the market value of a project in the DeFi industry.

  • Number of Token Holders & Holding Time

The number of token holders reflects how many users approve of the platform’s token model. Especially important is the number of tokens staked to obtain governance rights, which reflects the platform’s DAO situation.

Holding time shows whether the project attracts more users who believe in the project’s long-term value versus speculators.

  • Utility

Trading volume reflects the activity of a token in the market, and its ratio to market cap is similar to the turnover rate. Higher circulation reflects a token with a higher level of attention, while lower circulation is a token with less attention.
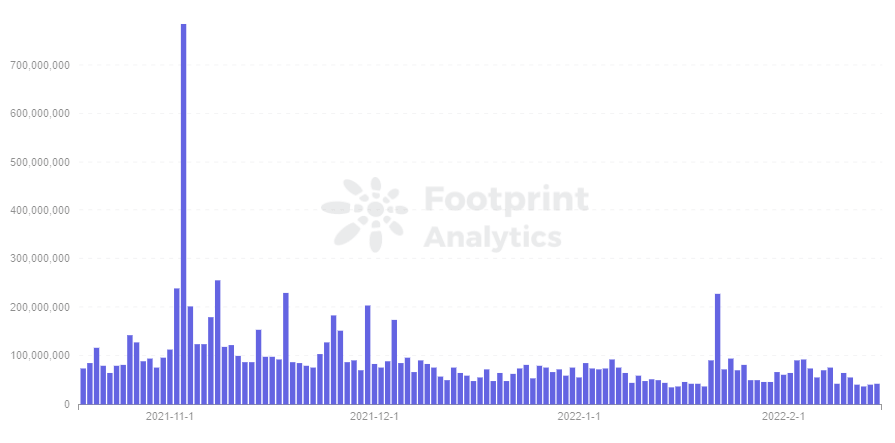
Footprint Analytics - MKR Volume

Footprint Analytics – MKR Volume

The utility of the token is also worth noting, i.e. whether the token mined is staked on the platform to make use of the governance token, or deposited in other external protocols to capture revenue.

For example, 61% of Liquity’s stablecoin, LUSD, is deposited in its own platform’s Stability Pool. LUSD does not play its role as a stablecoin in circulation compared to DAI’s utility.

Advanced Metrics

  • Pool Data

All DeFi project’s TVLs are made of pools, so finding the reasons behind metrics means examining the pool structure of a given project. For example: pool sizes, TVLs, and volume changes. 
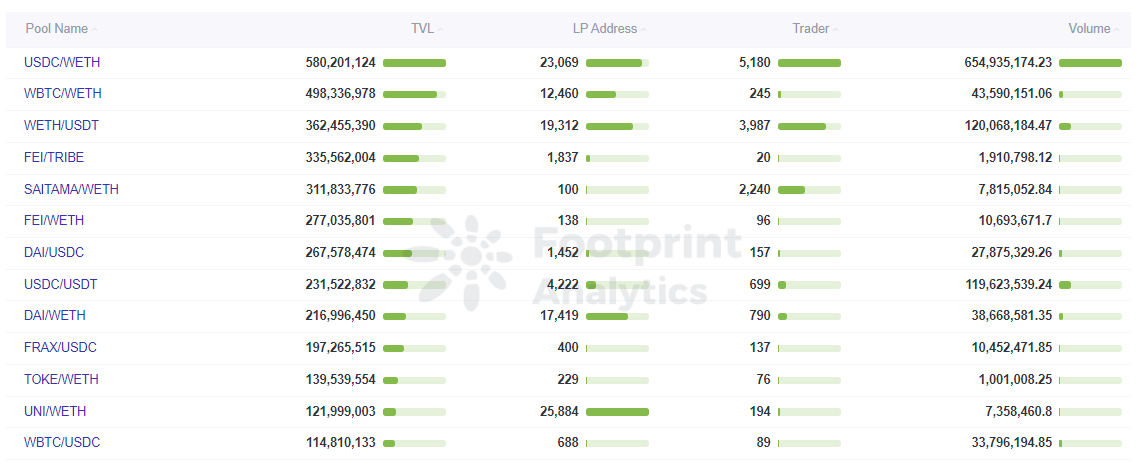
Footprint Analytics - Pools Overview

Footprint Analytics – Pools Overview

  • User Metrics

The project always revolves around users, and accurate capture of target users is the core of project development. Data classification and layering analysis of users can target quality users more quickly.

  • User Portrait

The overall users can be subdivided into new and active users. New users reflect market expansion, while active users reflect the project’s potential for continuing growth.
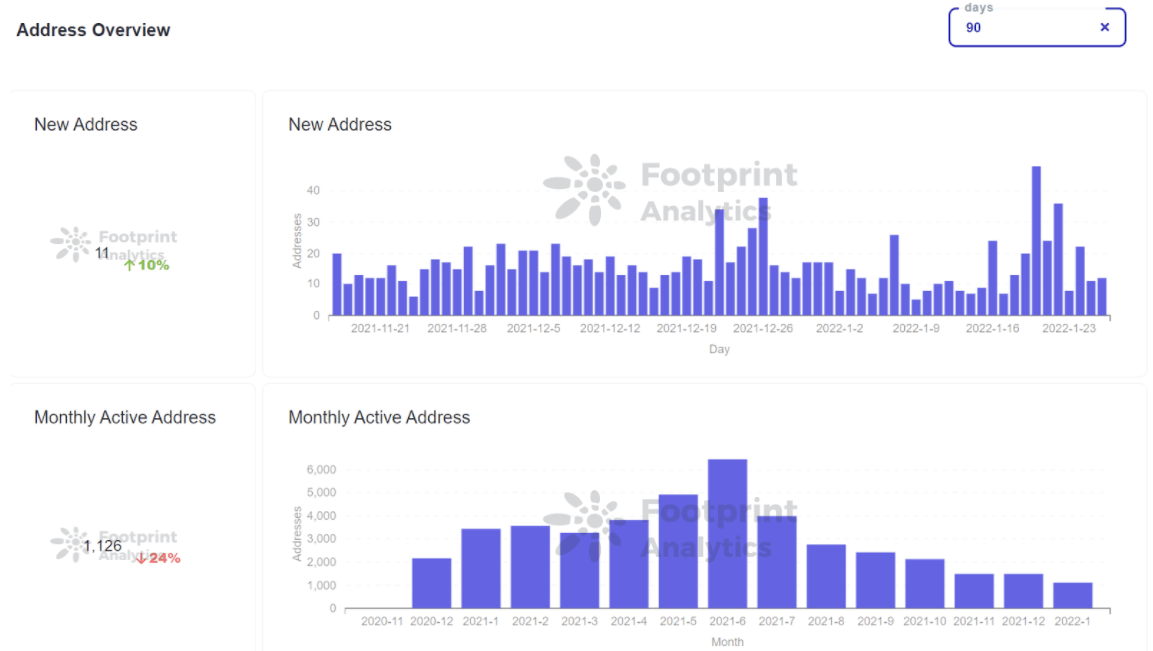
Footprint Analytics - Address Overview

Footprint Analytics – Address Overview

The analysis of the change in transaction amount, holding amount, and duration per user enables us to understand the average user quality.
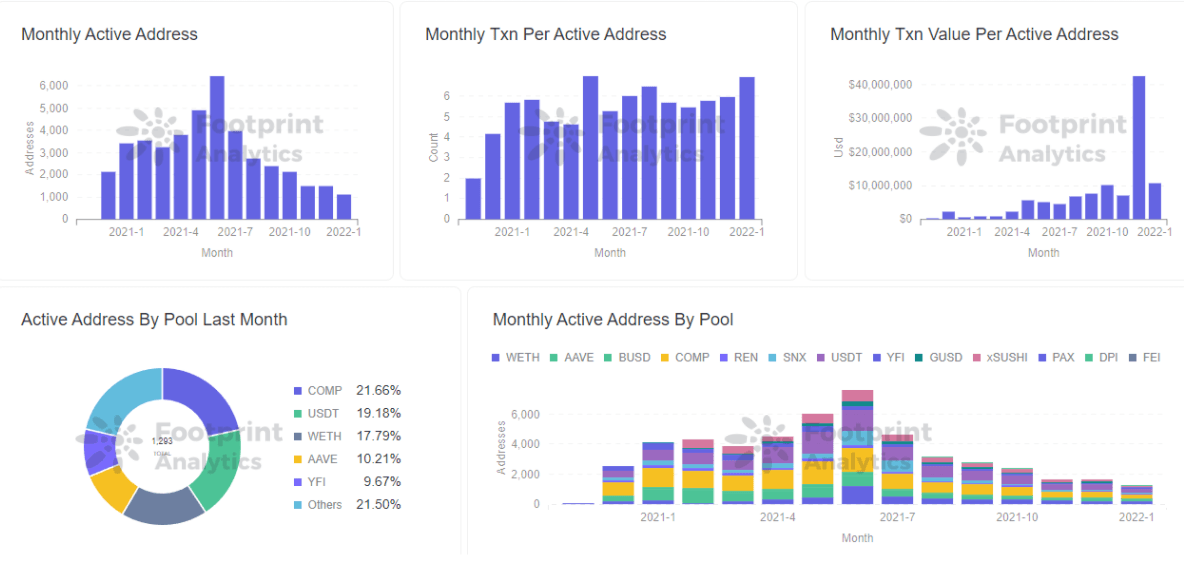
Footprint Analytics - Active Address

Footprint Analytics – Active Address

While averages can provide an observation of general trends in user behavior, it is still lacking as a foundation for project implementation. Averages often dilute important data, and a deeper user layering is required to find the real problems and develop the right action plan.
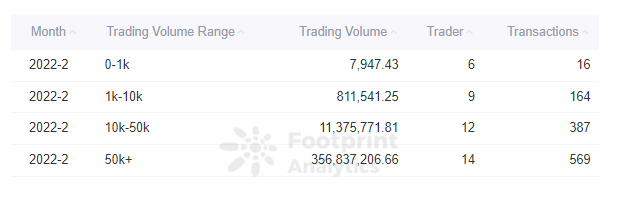
Footprint Analytics - Trading Volume Distribution

Footprint Analytics – Trading Volume Distribution

  • User Churn

Whales generate the most value for the platform and developers need to prevent these users from churning. By sorting users, it is possible to create user portraits and focus on big accounts.

Insight into the investment preferences of users can provide a deeper understanding of users, and uncover potential user groups by analyzing all DeFi platforms in which the target users have invested.
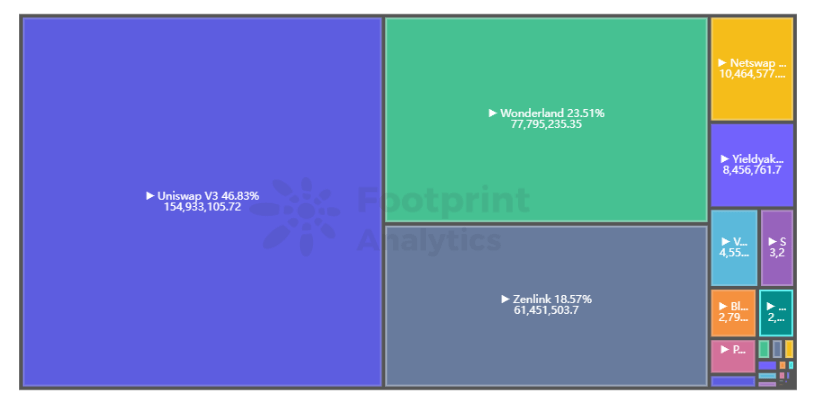
Footprint Analytics - Address Investment Protocols Distribution

Footprint Analytics – Address Investment Protocols Distribution

Cross Analysis

Cross analysis refers to the comparative analysis of multiple metrics together. Analysts and developers can use it to find correlations between metrics and create business hypotheses. 

For example, if we compare APY with the number of users or with TVL, we can analyze the results to see if the increase in APY is attracting more users.

In another example, an analyst can compare the price of a project with the price of BTC to determine whether price movements are caused by changes in the project’s intrinsic value or larger market forces. 
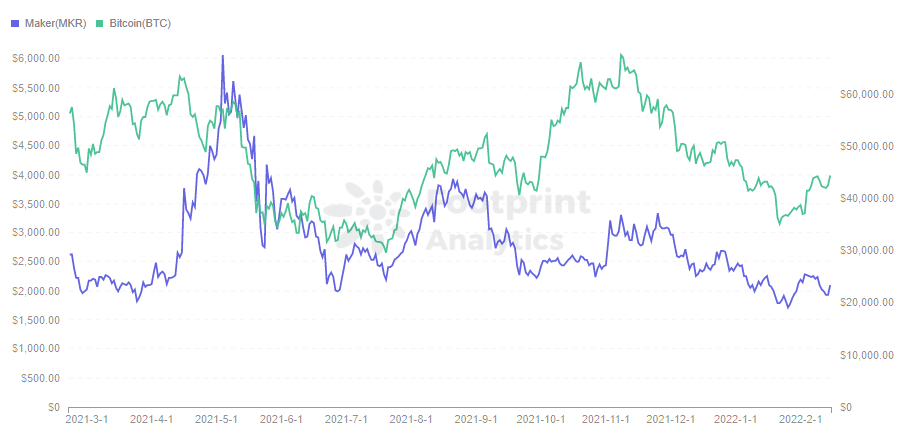
Footprint Analytics - Token Price (MKR vs BTC)

Footprint Analytics – Token Price (MKR vs BTC)

The Lego attributes of DeFi should not be overlooked either, with the metrics of closely related projects often being an important factor in the movement. For example, Convex helped spur the growth of Curve’s TVL.
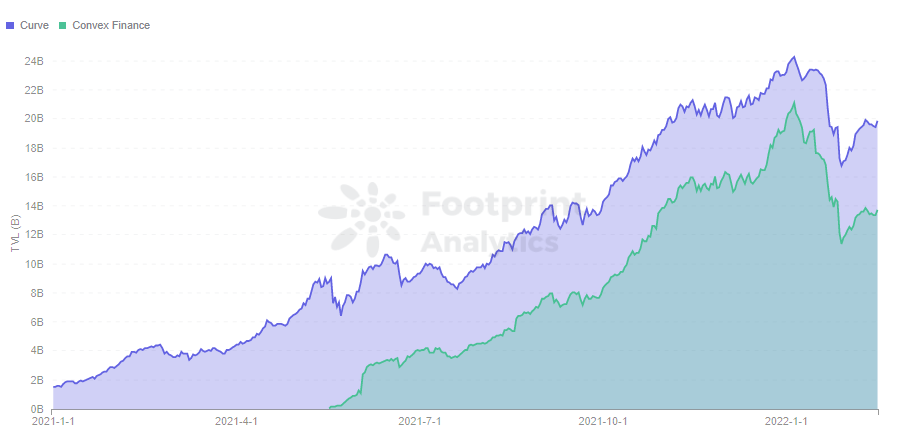
Footprint Analytics - Curve VS Convex in TVL

Footprint Analytics – Curve VS Convex in TVL

Summary

There are many analysis tools on the market, but they usually stop at surface-level metrics. 

For stakeholders to make data-driven decisions, it is crucial to dig deeper and apply advanced analytics to blockchain data. 

Date and Author: 09 February 2022, Simon

Data Source: Footprint Analytics

What is Footprint Analytics?

Footprint Analytics is an all-in-one analysis platform to visualize blockchain data and discover insights. It cleans and integrates on-chain data so users of any experience level can quickly start researching tokens, projects, and protocols. With over a thousand dashboard templates plus a drag-and-drop interface, anyone can build their own customized charts in minutes. Uncover blockchain data and invest smarter with Footprint.


Criptomoedas em alta

Leituras Relacionadas

After Three Consecutive Quarters of Decline, Can the Crypto Market Find a Window for Stabilization in Q3?

The cryptocurrency market has just concluded its worst-performing quarter since 2022, with total capitalization dropping 12.6% to $2.1 trillion. All core metrics indicate capital is leaving the sector, not just rotating within it. Bitcoin fell 14.2% and Ethereum dropped 25.4% in Q2, breaking their previous correlation with US tech stocks. A key driver is the reversal in US spot Bitcoin ETF flows, which saw a net outflow of approximately $4.67 billion in Q2, including a record monthly outflow near $4.5 billion in June. While recent data suggests long-term holders are accumulating again, sustained ETF outflows mean continued selling pressure. Market focus is now singularly on the Federal Reserve. The upcoming July FOMC meeting is seen as the most critical event for Q3. A dovish signal could support Bitcoin reclaiming a $68,000-$84,000 range, while a hawkish stance might establish a new trading band around $50,000-$56,000. Additionally, regulatory uncertainty persists, with the progress of the crucial *CLARITY Act* stalling in the Senate, reducing its perceived 2026 passage probability to 40-45%. Despite the broad downturn, a few sectors showed growth. Prediction markets saw nominal volume surge 48.7% year-over-year to $113.8 billion, and tokenized collectibles transaction volume rose 143% quarterly to $1.4 billion. The Real-World Asset (RWA) tokenization sector also continued steady growth, now representing ~$28.1 billion in on-chain value. The market's foundation for an extreme crash appears limited, with Bitcoin price hovering near its 200-week moving average. However, the trading paradigm has shifted from narrative-driven speculation to decisions based on price action, policy developments, and interest rate expectations, making a broad sentiment-driven rally unlikely in the near term.

marsbitHá 50m

After Three Consecutive Quarters of Decline, Can the Crypto Market Find a Window for Stabilization in Q3?

marsbitHá 50m

BIT Trading Moment: BTC Still Suppressed by Weekly 200 EMA, Rejection May Restart Decline; Storage and Semiconductors that Surged Last Night Begin Falling in Evening Trading

**Crypto & Stock Market Wrap: Bitcoin Tests Resistance, Stocks Retreat After AI Surge** Bitcoin consolidates around $66,000, facing key resistance near $68,000—an area seen as a major psychological and technical hurdle where previous rallies have failed. Analysts note the cryptocurrency is caught between its 200-week moving average (~$63,333) and 200-week EMA (~$68,328). A clear break above $68k is needed to signal a stronger bullish trend, while a rejection could lead to a retest of $63k support. Market sentiment remains cautious, with low futures open interest pointing to a low-liquidity rebound rather than a full bull market. Bitcoin spot ETFs saw another $203 million inflow. US stock futures pointed lower after a strong Tuesday session led by a massive rebound in semiconductors and memory stocks. The rally was fueled by renewed optimism about AI-driven hardware demand, with Micron, SanDisk, and SK Hynix surging. However, those gains reversed in pre-market trading. Super Micro Computer (SMCI) soared over 20% after hours on strong guidance and a record backlog. Other standouts included Rocket Lab and nuclear energy plays Oklo and X-Energy. Rising oil prices (Brent above $91) and climbing Treasury yields (10-year near 4.64%), however, are reigniting inflation concerns and acting as a headwind for equities. In Asia, markets were mixed. South Korea's KOSPI pared early gains to close slightly higher as semiconductor stocks like SK Hynix gave back initial surges. Japan's Nikkei edged lower as the yen hit a fresh 38-year low against the dollar, raising fears of potential market intervention. Key events to watch include the Samsung Galaxy launch, AMD's AI event, and a slew of major tech earnings from Alphabet, Tesla, and IBM after the close on Wednesday, followed by the ECB meeting and Intel's earnings on Thursday.

marsbitHá 58m

BIT Trading Moment: BTC Still Suppressed by Weekly 200 EMA, Rejection May Restart Decline; Storage and Semiconductors that Surged Last Night Begin Falling in Evening Trading

marsbitHá 58m

Former CFTC Chairman, Circle President Tarbert: Preaching Long-Termism While Cashing Out $30 Million Himself

Former CFTC Chairman and Circle President Heath Tarbert has consistently advocated for a long-term vision in public, urging patience from investors as Circle’s stock price has fallen significantly from its peak. However, it has been revealed that since Circle’s IPO, Tarbert has continuously sold his CRCL shares through pre-arranged trading plans, cashing out approximately $30 million, without making any public market purchases. This contrast between his public messaging and personal actions has drawn criticism. Tarbert joined Circle in July 2023 as Chief Legal Officer, leveraging his regulatory experience to help guide the company through its IPO and expansion. Despite promoting stablecoins as long-term infrastructure, he established a 10b5-1 trading plan just before Circle went public, leading to substantial stock sales over the following year. In March 2026, he initiated another plan to sell more shares. His career trajectory highlights a pattern of moving between high-level regulatory roles and influential positions in the financial sector. After resigning as CFTC Chairman in early 2021, he joined Citadel Securities as Chief Legal Officer just 27 days later, during a period of intense regulatory scrutiny for the firm. He later joined Circle, aiding its efforts to navigate regulatory challenges for its public listing. While Tarbert's expertise in policy and compliance is valuable to companies like Circle, his actions—advocating long-term confidence while personally divesting—raise questions about the alignment between his public statements and his private financial decisions, leaving investors who followed his advice to bear the market risks.

marsbitHá 1h

Former CFTC Chairman, Circle President Tarbert: Preaching Long-Termism While Cashing Out $30 Million Himself

marsbitHá 1h

Gate Research Institute: The 'Wall Street-ization' Wave of Crypto Financial Products – Competition or Integration?

The article titled "Gate Research Institute: Are Crypto Financial Products Sparking a 'Wall Street' Wave—Competition or Convergence?" explores the evolving relationship between the crypto ecosystem and traditional finance (TradFi). The piece begins by reflecting on Bitcoin's original 2009 vision of decentralization, disintermediation, and moving away from banks. It then contrasts this with the 2024 landscape, where key crypto assets like Bitcoin are increasingly held through Wall Street products like ETFs issued by giants like BlackRock. The article questions whether this signifies that TradFi is systematically taking over the rights to issue, price, custody, and distribute crypto financial assets. The core argument is that this is not a zero-sum takeover but rather a bidirectional convergence where each side addresses the other's weaknesses. Crypto offers 24/7 global markets, programmable settlement, and open access but lacks compliant channels, institutional-grade custody, deep fiat liquidity, and mainstream distribution. TradFi possesses these but is constrained by legacy systems, limited operating hours, and slow settlement. Two primary convergence paths are highlighted: * **Path A (CEX to TradFi):** Exemplified by Gate, which has progressed from offering tokenized stocks and CFDs to providing direct, real stock trading (US, Hong Kong, South Korea) within its platform, using USDT. * **Path B (TradFi to Crypto):** Exemplified by Robinhood, which has integrated crypto trading, acquired exchanges like Bitstamp, and is moving traditional assets like stocks onto the blockchain via tokenization and its own Layer 2. Both paths are ultimately competing to become the next-generation, unified financial account—a "super account" where users can seamlessly trade cryptocurrencies, stocks, ETFs, RWA (Real World Assets), and tokenized treasury products in one interface. The growth of RWA and tokenized treasuries (e.g., BlackRock's BUIDL) is presented as the asset-layer fusion, providing stable, yield-bearing assets on-chain and acting as a bridge between the two worlds. In conclusion, the "Wall Street-ization" of crypto is framed as a mutual transformation. Decentralized ideals persist in the protocol layer, while at the application layer, a more efficient, global, and accessible unified capital market is emerging from this convergence. The future competition lies not between crypto exchanges and stockbrokers, but between platforms vying to offer the most comprehensive asset coverage, liquidity, and user experience within a single account.

marsbitHá 1h

Gate Research Institute: The 'Wall Street-ization' Wave of Crypto Financial Products – Competition or Integration?

marsbitHá 1h

Trading

Spot

Artigos em Destaque

O que é ETH 2.0

ETH 2.0: Uma Nova Era para o Ethereum Introdução ETH 2.0, amplamente conhecido como Ethereum 2.0, marca uma atualização monumental à blockchain do Ethereum. Esta transição não é meramente uma mudança estética; visa melhorar fundamentalmente a escalabilidade, segurança e sustentabilidade da rede. Com uma mudança do mecanismo de consenso em Proof of Work (PoW), intensivo em energia, para um Proof of Stake (PoS) mais eficiente, o ETH 2.0 promete uma abordagem transformadora ao ecossistema blockchain. O que é ETH 2.0? ETH 2.0 é um conjunto de atualizações distintas e interconectadas focadas na otimização das capacidades e desempenho do Ethereum. Esta reformulação foi projetada para abordar desafios críticos que o mecanismo atual do Ethereum enfrentou, particularmente em relação à velocidade das transações e à congestão da rede. Objetivos do ETH 2.0 Os principais objetivos do ETH 2.0 giram em torno da melhoria de três aspectos centrais: Escalabilidade: Com o objetivo de melhorar significativamente o número de transações que a rede pode manejar por segundo, o ETH 2.0 procura ultrapassar a limitação atual de aproximadamente 15 transações por segundo, alcançando potencialmente milhares. Segurança: Medidas de segurança melhoradas são integrais ao ETH 2.0, especialmente através da resistência aprimorada contra ciberataques e da preservação do ethos descentralizado do Ethereum. Sustentabilidade: O novo mecanismo PoS foi projetado não apenas para melhorar a eficiência, mas também para reduzir drasticamente o consumo de energia, alinhando a estrutura operacional do Ethereum com considerações ambientais. Quem é o Criador do ETH 2.0? A criação do ETH 2.0 pode ser atribuída à Ethereum Foundation. Esta organização sem fins lucrativos, que desempenha um papel crucial no apoio ao desenvolvimento do Ethereum, é liderada pelo co-fundador notável Vitalik Buterin. A sua visão de um Ethereum mais escalável e sustentável tem sido a força motriz por trás desta atualização, envolvendo contribuições de uma comunidade global de desenvolvedores e entusiastas dedicados a melhorar o protocolo. Quem são os Investidores do ETH 2.0? Embora os detalhes sobre os investidores do ETH 2.0 não tenham sido tornados públicos, é sabido que a Ethereum Foundation recebe apoio de várias organizações e indivíduos no espaço da blockchain e tecnologia. Esses parceiros incluem firmas de capital de risco, empresas de tecnologia e organizações filantrópicas que compartilham um interesse mútuo em apoiar o desenvolvimento de tecnologias descentralizadas e infraestrutura de blockchain. Como Funciona o ETH 2.0? ETH 2.0 é notável por introduzir uma série de características chave que o diferenciam do seu predecessor. Proof of Stake (PoS) A transição para um mecanismo de consenso PoS é uma das mudanças de destaque do ETH 2.0. Ao contrário do PoW, que depende da mineração intensiva em energia para a verificação de transações, o PoS permite que os utilizadores validem transações e criem novos blocos de acordo com a quantidade de ETH que apostam na rede. Isso leva a uma maior eficiência energética, reduzindo o consumo em aproximadamente 99,95%, tornando o Ethereum 2.0 uma alternativa consideravelmente mais ecológica. Shard Chains As shard chains são outra inovação crítica do ETH 2.0. Estas cadeias menores operam em paralelo com a cadeia principal do Ethereum, permitindo que várias transações sejam processadas simultaneamente. Esta abordagem melhora a capacidade geral da rede, abordando preocupações de escalabilidade que têm atormentado o Ethereum. Beacon Chain No coração do ETH 2.0 está a Beacon Chain, que coordena a rede e gere o protocolo PoS. Ela atua como uma espécie de organizador: supervisiona os validadores, garante que as shards permaneçam conectadas à rede e monitora a saúde geral do ecossistema blockchain. Linha do Tempo do ETH 2.0 A jornada do ETH 2.0 tem sido marcada por vários marcos chave que traçam a evolução desta atualização significativa: Dezembro de 2020: O lançamento da Beacon Chain marcou a introdução do PoS, preparando o caminho para a migração para o ETH 2.0. Setembro de 2022: A conclusão de “The Merge” representa um momento crucial em que a rede Ethereum fez a transição com sucesso de um quadro PoW para um PoS, anunciando uma nova era para o Ethereum. 2023: O lançamento esperado das shard chains visa melhorar ainda mais a escalabilidade da rede Ethereum, solidificando o ETH 2.0 como uma plataforma robusta para aplicações e serviços descentralizados. Características Chave e Benefícios Escalabilidade Melhorada Uma das vantagens mais significativas do ETH 2.0 é a sua escalabilidade melhorada. A combinação de PoS e shard chains permite que a rede expanda a sua capacidade, permitindo que acomode um volume de transações muito maior em comparação com o sistema legado. Eficiência Energética A implementação do PoS representa um enorme passo em direção à eficiência energética na tecnologia blockchain. Ao reduzir drasticamente o consumo de energia, o ETH 2.0 não só reduz os custos operacionais, mas também se alinha mais estreitamente com os objetivos globais de sustentabilidade. Segurança Aprimorada Os mecanismos atualizados do ETH 2.0 contribuem para uma segurança melhorada em toda a rede. O uso do PoS, juntamente com medidas de controle inovadoras estabelecidas através das shard chains e da Beacon Chain, assegura um maior grau de proteção contra potenciais ameaças. Custos Mais Baixos para os Utilizadores À medida que a escalabilidade melhora, os efeitos sobre os custos de transação também serão evidentes. Aumentada a capacidade e reduzida a congestão, espera-se que isso se traduza em taxas mais baixas para os utilizadores, tornando o Ethereum mais acessível para transações do dia a dia. Conclusão ETH 2.0 marca uma evolução significativa no ecossistema da blockchain do Ethereum. Ao abordar questões fundamentais como a escalabilidade, o consumo de energia, a eficiência das transações e a segurança geral, a importância desta atualização não pode ser subestimada. A transição para o Proof of Stake, a introdução das shard chains e o trabalho fundamental da Beacon Chain são indicativos de um futuro em que o Ethereum pode atender à crescente demanda do mercado descentralizado. Em uma indústria movida pela inovação e progresso, o ETH 2.0 representa um testemunho das capacidades da tecnologia blockchain em pavimentar o caminho para uma economia digital mais sustentável e eficiente.

138 Visualizações TotaisPublicado em {updateTime}Atualizado em 2024.12.03

O que é ETH 2.0

O que é ETH 3.0

ETH3.0 e $eth 3.0: Uma Análise Profunda do Futuro do Ethereum Introdução No ambiente em rápida evolução da criptomoeda e da tecnologia blockchain, o ETH3.0, frequentemente denotado como $eth 3.0, emergiu como um tema de considerável interesse e especulação. O termo abrange dois conceitos principais que merecem esclarecimento: Ethereum 3.0: Esta representa uma potencial atualização futura destinada a aumentar as capacidades da atual blockchain do Ethereum, focando especialmente na melhoria da escalabilidade e desempenho. ETH3.0 Meme Token: Este distinto projeto de criptomoeda procura aproveitar a blockchain do Ethereum na criação de um ecossistema centrado em memes, promovendo o envolvimento na comunidade de criptomoedas. Compreender esses aspectos do ETH3.0 é essencial não apenas para entusiastas de criptomoedas, mas também para aqueles que observam as tendências tecnológicas mais amplas no espaço digital. O que é ETH3.0? Ethereum 3.0 Ethereum 3.0 é promovido como uma atualização proposta para a rede Ethereum já estabelecida, que tem sido a espinha dorsal de muitas aplicações descentralizadas (dApps) e contratos inteligentes desde a sua criação. As melhorias vislumbradas concentram-se principalmente na escalabilidade—integrando tecnologias avançadas como sharding e provas de conhecimento zero (zk-proofs). Essas inovações tecnológicas visam facilitar um número sem precedentes de transações por segundo (TPS), potencialmente alcançando milhões, abordando assim uma das limitações mais significativas enfrentadas pela tecnologia blockchain atual. A melhoria não é meramente técnica, mas também estratégica; visa preparar a rede Ethereum para uma adoção generalizada e utilidade em um futuro marcado por uma maior demanda por soluções descentralizadas. ETH3.0 Meme Token Em contraste com o Ethereum 3.0, o ETH3.0 Meme Token aventura-se por um domínio mais leve e divertido, combinando a cultura dos memes da internet com a dinâmica das criptomoedas. Este projeto permite que os usuários comprem, vendam e negociem memes na blockchain do Ethereum, proporcionando uma plataforma que fomenta o envolvimento da comunidade através da criatividade e interesses compartilhados. O ETH3.0 Meme Token visa demonstrar como a tecnologia blockchain pode interseccionar com a cultura digital, criando casos de uso que são tanto divertidos quanto financeiramente viáveis. Quem é o Criador do ETH3.0? Ethereum 3.0 A iniciativa em direção ao Ethereum 3.0 é impulsionada principalmente por um consórcio de desenvolvedores e pesquisadores dentro da comunidade Ethereum, notavelmente incluindo Justin Drake. Conhecido por suas percepções e contribuições para a evolução do Ethereum, Drake tem sido uma figura proeminente nas discussões sobre a transição do Ethereum para uma nova camada de consenso, referida como “Beam Chain”. Esta abordagem colaborativa ao desenvolvimento significa que o Ethereum 3.0 não é fruto de um único criador, mas sim uma manifestação da engenhosidade coletiva focada no avanço da tecnologia blockchain. ETH3.0 Meme Token Os detalhes sobre o criador do ETH3.0 Meme Token são atualmente indetectáveis. A natureza dos tokens de meme frequentemente leva a uma estrutura mais descentralizada e impulsionada pela comunidade, o que poderia explicar a falta de atribuição específica. Isso alinha-se com a ethos da comunidade de criptomoedas mais ampla, onde a inovação geralmente surge de esforços colaborativos em vez de esforços individuais. Quem são os Investidores do ETH3.0? Ethereum 3.0 O apoio ao Ethereum 3.0 provém principalmente da Fundação Ethereum, juntamente com uma comunidade entusiástica de desenvolvedores e investidores. Esta associação fundacional proporciona um grau significativo de legitimidade e melhora as perspectivas de uma implementação bem-sucedida, uma vez que aproveita a confiança e credibilidade construída ao longo de anos de operações de rede. Em um clima em rápida mudança no mundo das criptomoedas, o apoio da comunidade desempenha um papel crucial no impulso ao desenvolvimento e adoção, posicionando o Ethereum 3.0 como um sério candidato a futuros avanços na blockchain. ETH3.0 Meme Token Embora as fontes atualmente disponíveis não forneçam informações explícitas sobre as fundações ou organizações de investimento que apoiam o ETH3.0 Meme Token, é indicativo do modelo típico de financiamento para tokens de meme, que frequentemente depende de apoio base e engajamento da comunidade. Os investidores em tais projetos costumam consistir em indivíduos motivados pelo potencial de inovação impulsionada pela comunidade e pelo espírito de cooperação encontrado dentro da comunidade cripto. Como Funciona o ETH3.0? Ethereum 3.0 As características distintivas do Ethereum 3.0 residem em sua proposta de implementação de sharding e tecnologia zk-proof. Sharding é um método de partição da blockchain em partes menores e gerenciáveis ou “shards”, que podem processar transações simultaneamente em vez de sequencialmente. Esta descentralização do processamento ajuda a prevenir congestionamentos e garante que a rede permaneça responsiva mesmo sob carga pesada. A tecnologia de prova de conhecimento zero (zk-proof) contribui com outra camada de sofisticação ao permitir a validação de transações sem revelar os dados subjacentes envolvidos. Este aspecto não apenas melhora a privacidade, mas também aumenta a eficiência geral da rede. Há também conversas sobre a incorporação de uma Máquina Virtual Ethereum de conhecimento zero (zkEVM) nesta atualização, amplificando ainda mais as capacidades e utilidade da rede. ETH3.0 Meme Token O ETH3.0 Meme Token distingue-se ao capitalizar sobre a popularidade da cultura dos memes. Estabelece um mercado para que os usuários participem da negociação de memes, não apenas para entretenimento, mas também para potencial ganho econômico. Ao integrar recursos como staking, provisão de liquidez e mecanismos de governança, o projeto fomenta um ambiente que incentiva a interação e participação da comunidade. Ao oferecer uma mistura única de entretenimento e oportunidade econômica, o ETH3.0 Meme Token visa atrair um público diversificado, variando de entusiastas de criptomoedas a conhecedores casuais de memes. Cronologia do ETH3.0 Ethereum 3.0 11 de novembro de 2024: Justin Drake sugere a próxima atualização do ETH 3.0, centrada nas melhorias de escalabilidade. Este anúncio sinaliza o início de discussões formais sobre a futura arquitetura do Ethereum. 12 de novembro de 2024: A proposta antecipada para Ethereum 3.0 deve ser revelada no Devcon em Bangkok, preparando o cenário para um feedback mais amplo da comunidade e potenciais próximos passos no desenvolvimento. ETH3.0 Meme Token 21 de março de 2024: O ETH3.0 Meme Token é oficialmente listado no CoinMarketCap, marcando sua entrada no domínio público das criptomoedas e aumentando a visibilidade de seu ecossistema baseado em memes. Pontos Chave Em conclusão, Ethereum 3.0 representa uma evolução significativa dentro da rede Ethereum, focando em superar limitações quanto à escalabilidade e desempenho através de tecnologias avançadas. As atualizações propostas refletem uma abordagem proativa às futuras demandas e usabilidade. Por outro lado, o ETH3.0 Meme Token encapsula a essência da cultura impulsionada pela comunidade no espaço das criptomoedas, aproveitando a cultura dos memes para criar plataformas envolventes que incentivam a criatividade e participação dos usuários. Compreender os distintos propósitos e funcionalidades do ETH3.0 e $eth 3.0 é fundamental para qualquer pessoa interessada nos desenvolvimentos contínuos dentro do espaço cripto. Com ambas as iniciativas a pavimentar caminhos únicos, elas sublinham coletivamente a natureza dinâmica e multifacetada da inovação em blockchain.

143 Visualizações TotaisPublicado em {updateTime}Atualizado em 2024.12.03

O que é ETH 3.0

Como comprar ETH

Bem-vindo à HTX.com!Tornámos a compra de Ethereum (ETH) simples e conveniente.Segue o nosso guia passo a passo para iniciar a tua jornada no mundo das criptos.Passo 1: cria a tua conta HTXUtiliza o teu e-mail ou número de telefone para te inscreveres numa conta gratuita na HTX.Desfruta de um processo de inscrição sem complicações e desbloqueia todas as funcionalidades.Obter a minha contaPasso 2: vai para Comprar Cripto e escolhe o teu método de pagamentoCartão de crédito/débito: usa o teu visa ou mastercard para comprar Ethereum (ETH) instantaneamente.Saldo: usa os fundos da tua conta HTX para transacionar sem problemas.Terceiros: adicionamos métodos de pagamento populares, como Google Pay e Apple Pay, para aumentar a conveniência.P2P: transaciona diretamente com outros utilizadores na HTX.Mercado de balcão (OTC): oferecemos serviços personalizados e taxas de câmbio competitivas para os traders.Passo 3: armazena teu Ethereum (ETH)Depois de comprar o teu Ethereum (ETH), armazena-o na tua conta HTX.Alternativamente, podes enviá-lo para outro lugar através de transferência blockchain ou usá-lo para transacionar outras criptomoedas.Passo 4: transaciona Ethereum (ETH)Transaciona facilmente Ethereum (ETH) no mercado à vista da HTX.Acede simplesmente à tua conta, seleciona o teu par de trading, executa as tuas transações e monitoriza em tempo real.Oferecemos uma experiência de fácil utilização tanto para principiantes como para traders experientes.

3.3k Visualizações TotaisPublicado em {updateTime}Atualizado em 2026.06.02

Como comprar ETH

Discussões

Bem-vindo à Comunidade HTX. Aqui, pode manter-se informado sobre os mais recentes desenvolvimentos da plataforma e obter acesso a análises profissionais de mercado. As opiniões dos utilizadores sobre o preço de ETH (ETH) são apresentadas abaixo.

活动图片













