Monad eyes all-time high: Accumulation surges as MON bulls test key resistance

ambcryptoPublicado em 2026-04-09Última atualização em 2026-04-09

Resumo

Monad (MON) has surged 13% in 24 hours, emerging as a top market performer. The rally is supported by strong accumulation, with the Accumulation/Distribution indicator and Money Flow Index (MFI) both trending upward, indicating sustained buying pressure and capital inflows. However, the price faces a key resistance zone, and the Bollinger Bands suggest MON is overbought, signaling potential for a short-term pullback. Breaking this resistance is crucial for a sustained upward move toward its all-time high, which would require a 56% increase and an additional $851 million in market capitalization. This depends on continued bullish sentiment across spot and futures markets, as well as broader crypto market stability.

Monad [MON] could rank among the market’s top gainers if bullish strength persists, especially as the asset posts a 13% gain over the past day, placing it among the leading performers in the crypto market over the last 24 hours.

However, the rally still faces a major obstacle, as price trades within a resistance block expected to cap further upside. The key question is whether Monad can break above this level and open a path toward its all-time high.

Monad rallies on the back of accumulation

The recent surge in accumulation has supported MON’s upward momentum, and current indicators suggest that this trend may not slow down soon.

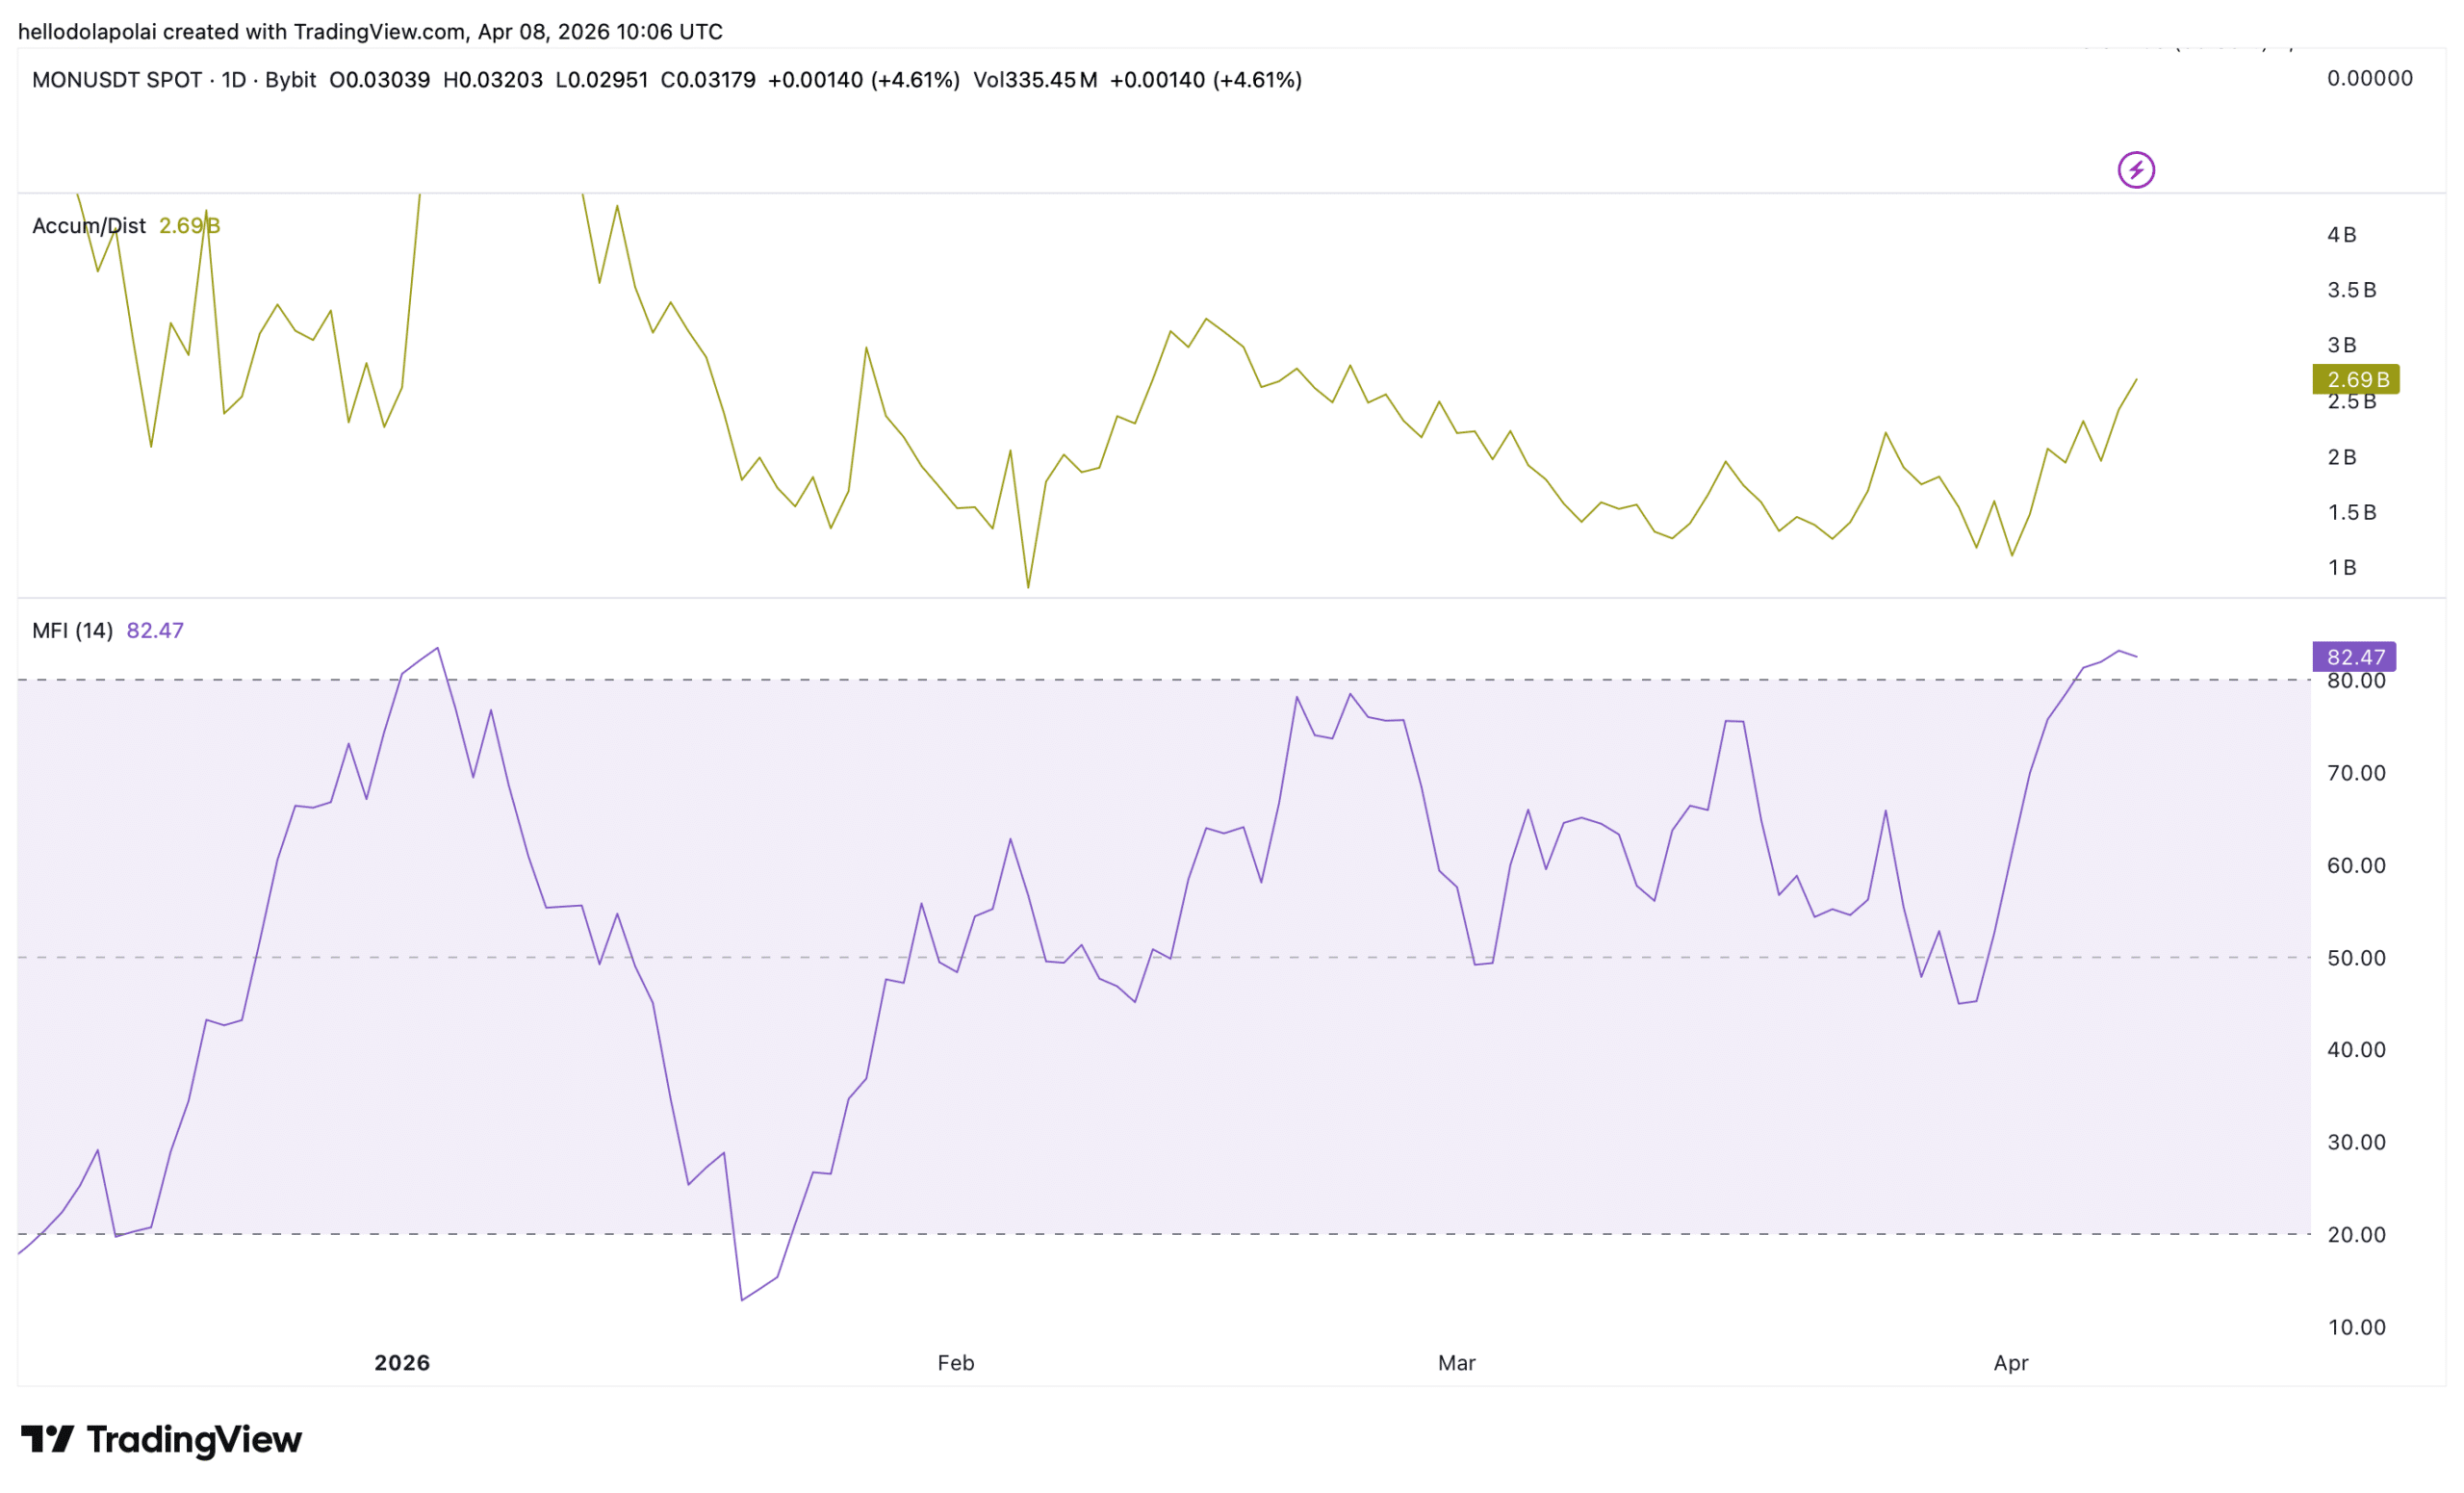
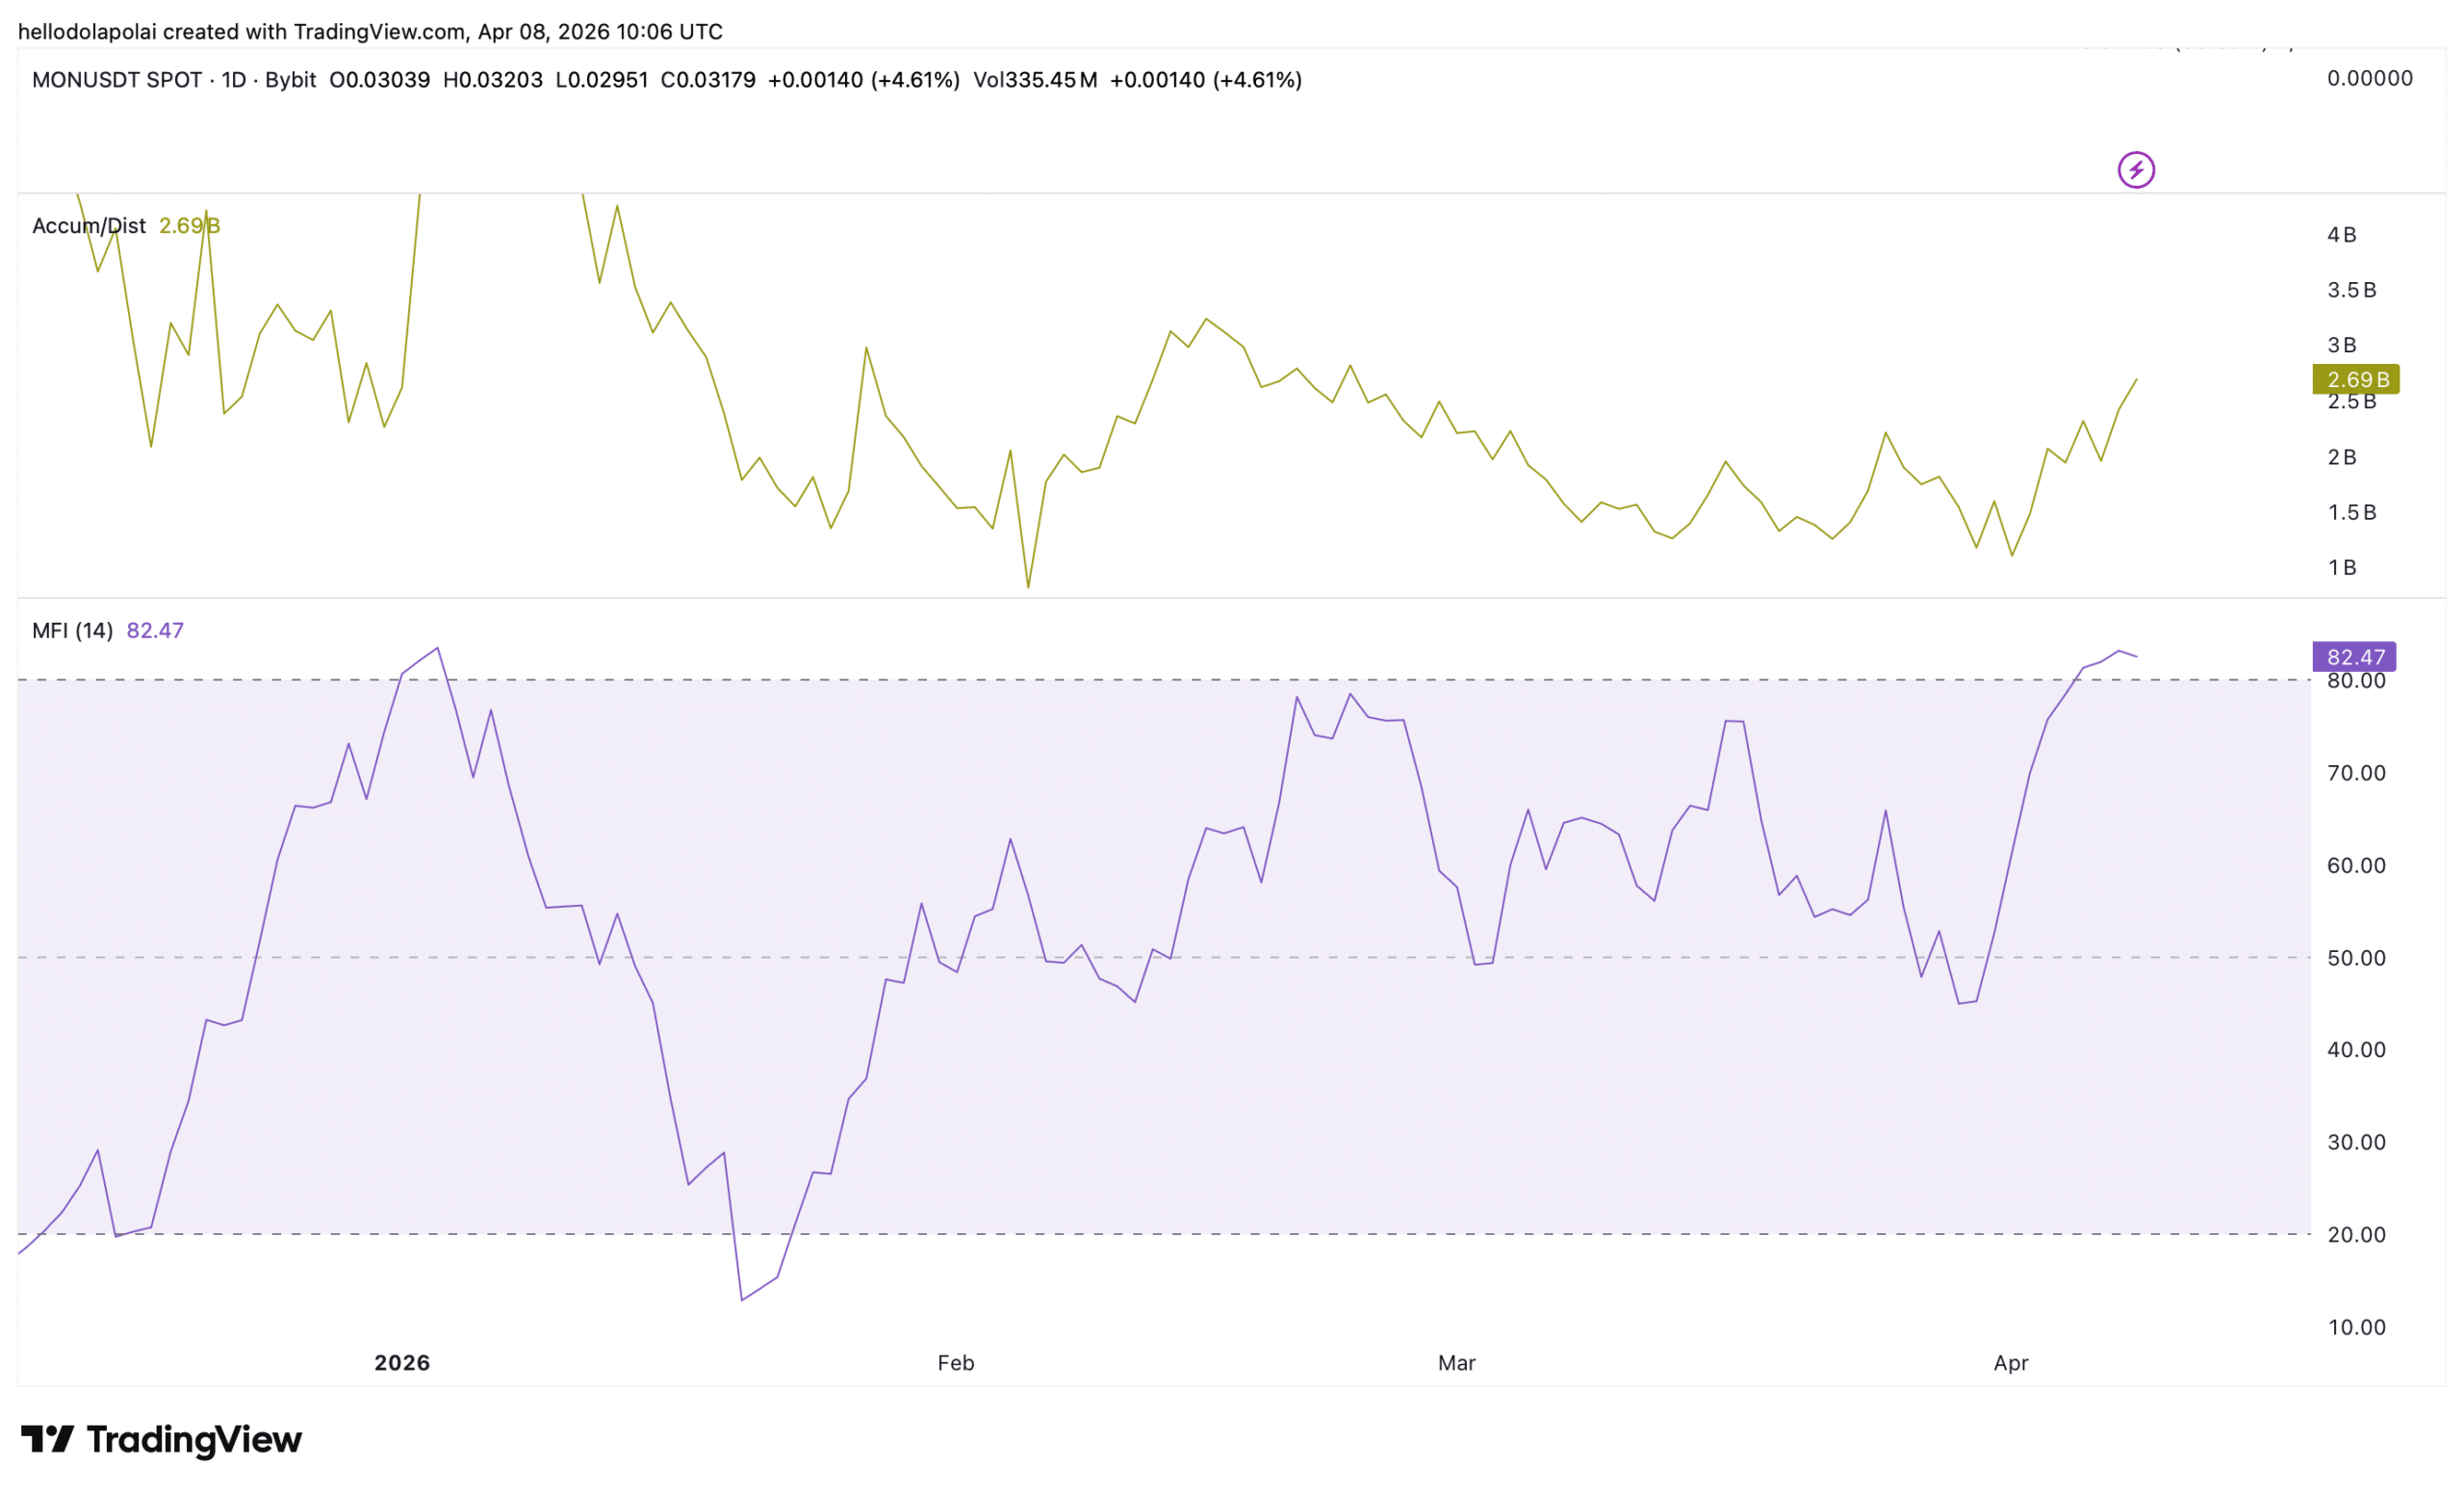
The Accumulation/Distribution indicator continues to trend higher, showing that as price increases, investors keep buying. Trading volume has also strengthened, exceeding 2.69 billion over the past day.

Accumulation tells only part of the story. The Money Flow Index (MFI), which tracks capital inflow and outflow, also indicates stronger inflows over the same period.
Source: TradingView

The MFI remains slightly above the 80 level and trends upward, suggesting that investors are positioning for further upside gains.

While this outlook remains bullish, market volatility requires close attention, as sentiment can shift quickly, particularly with the broader market still in a bearish phase.

Warning signs emerge

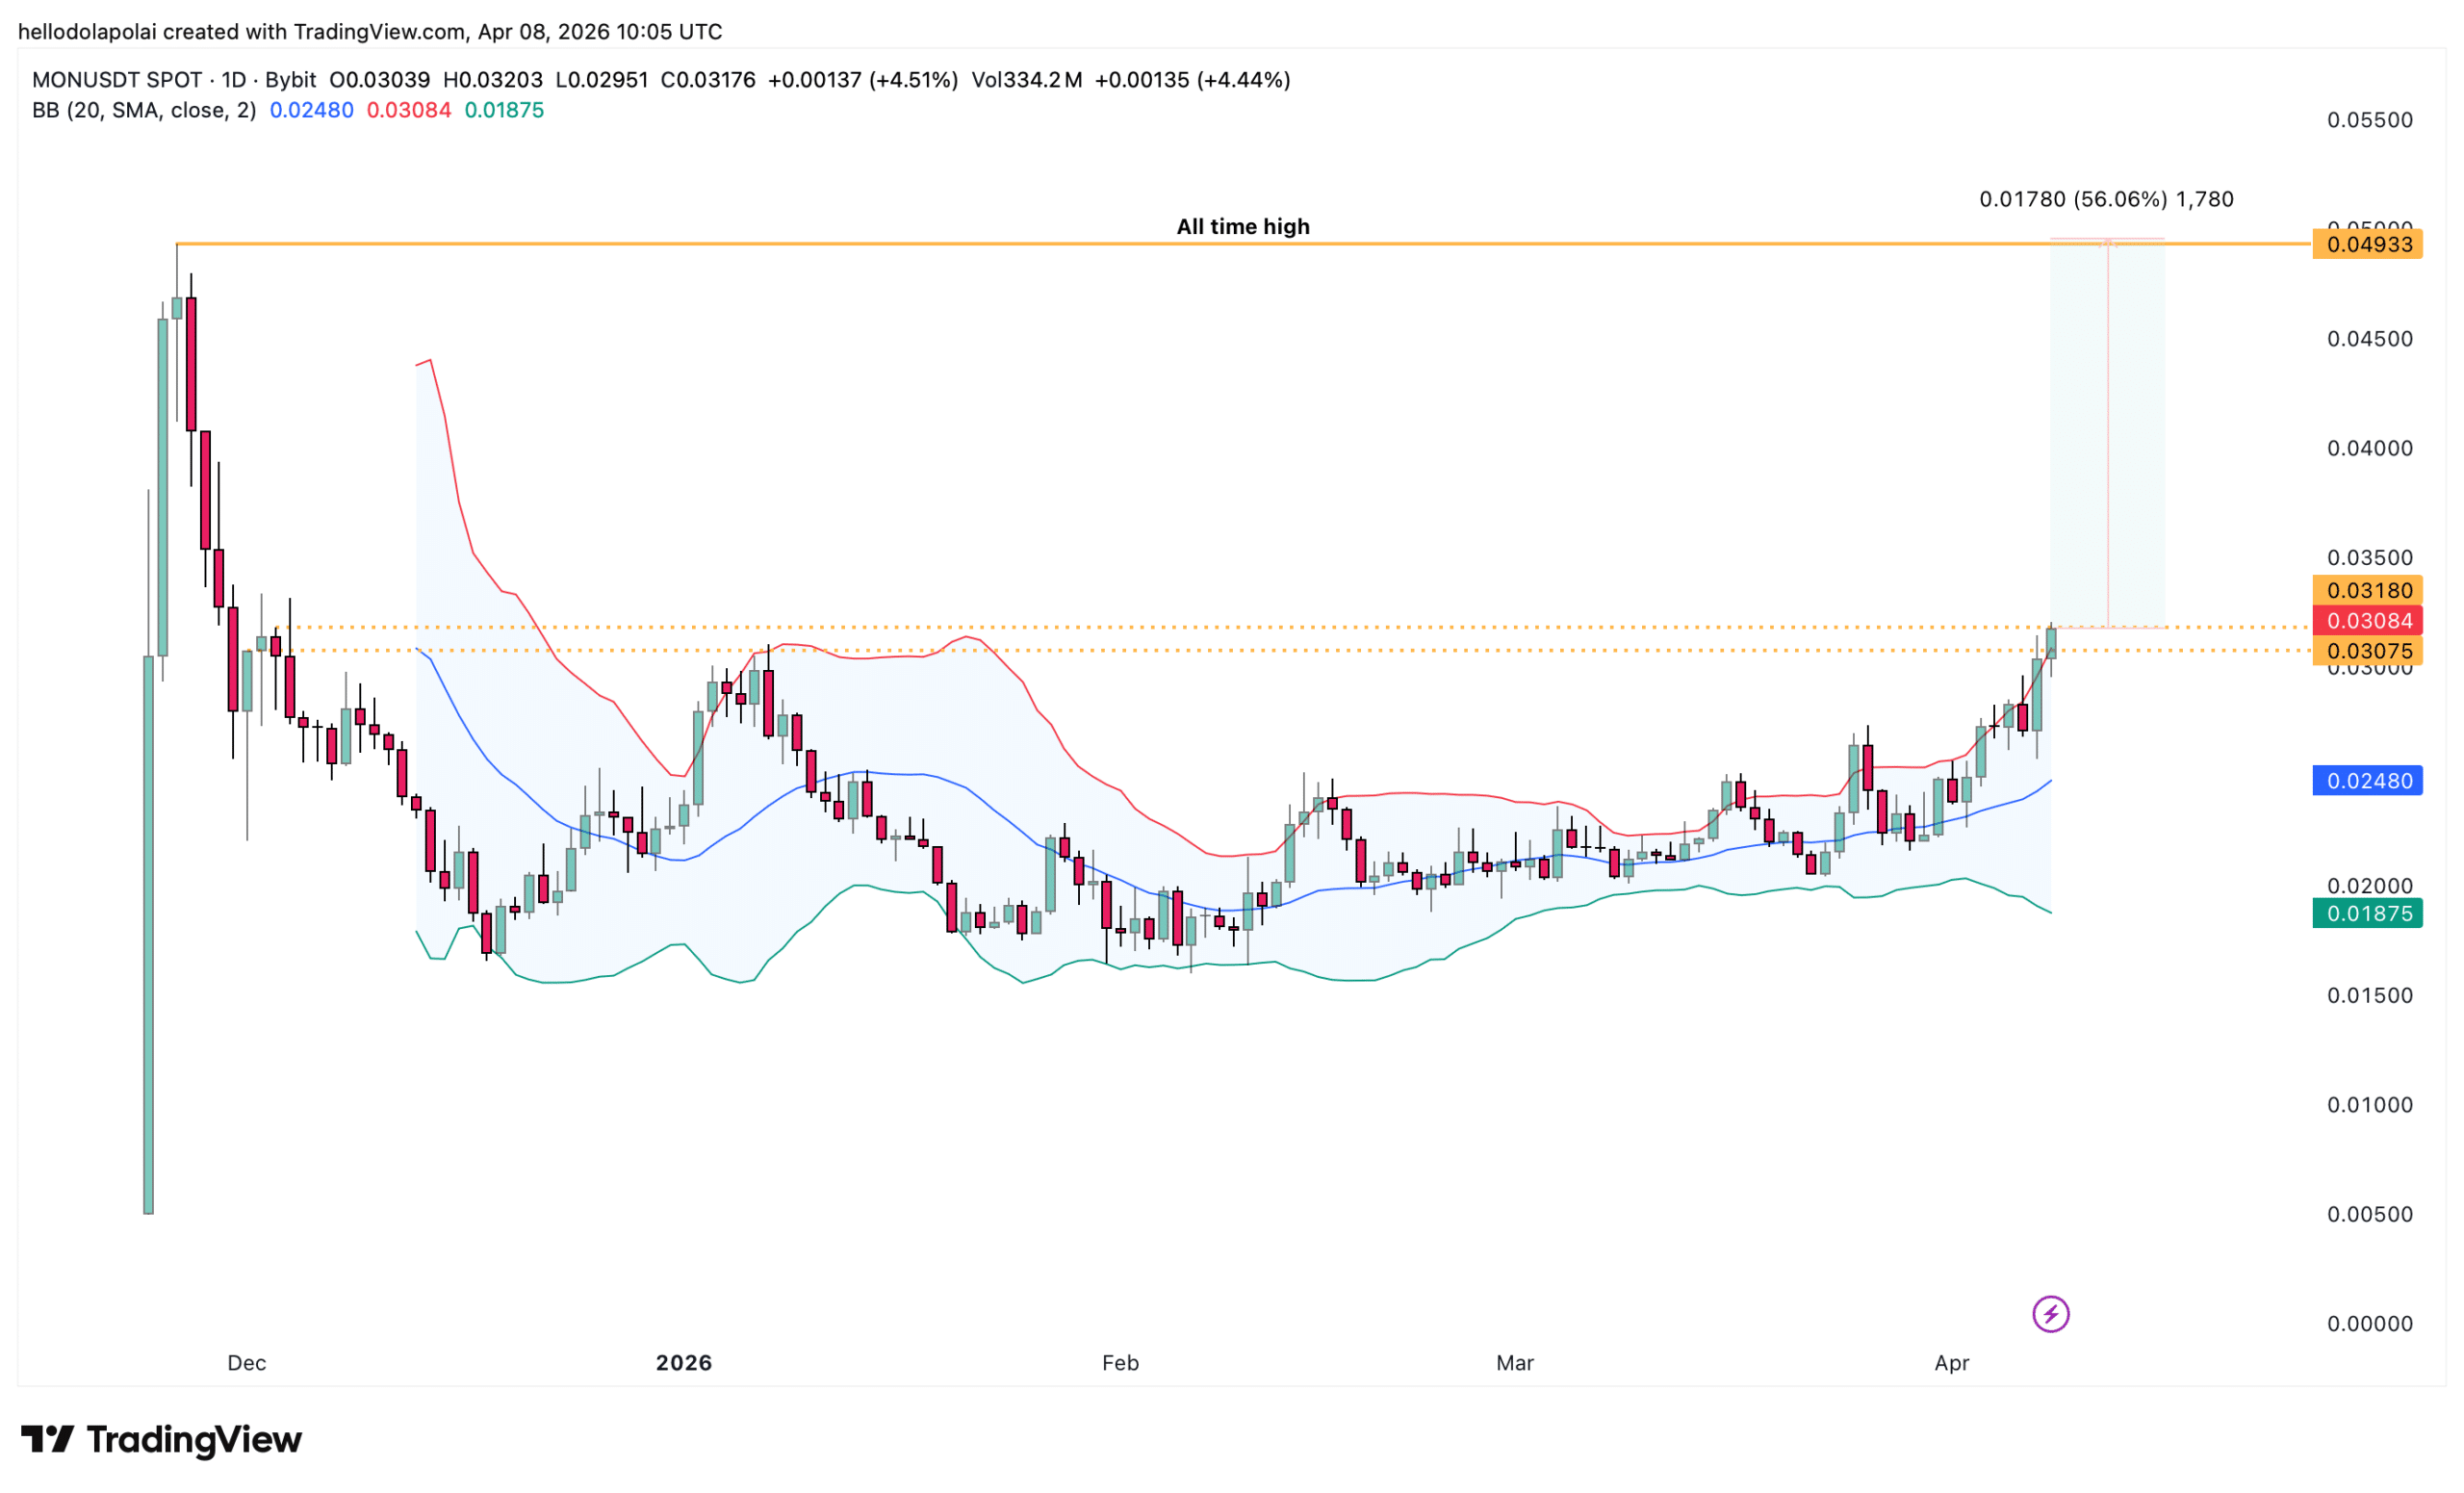
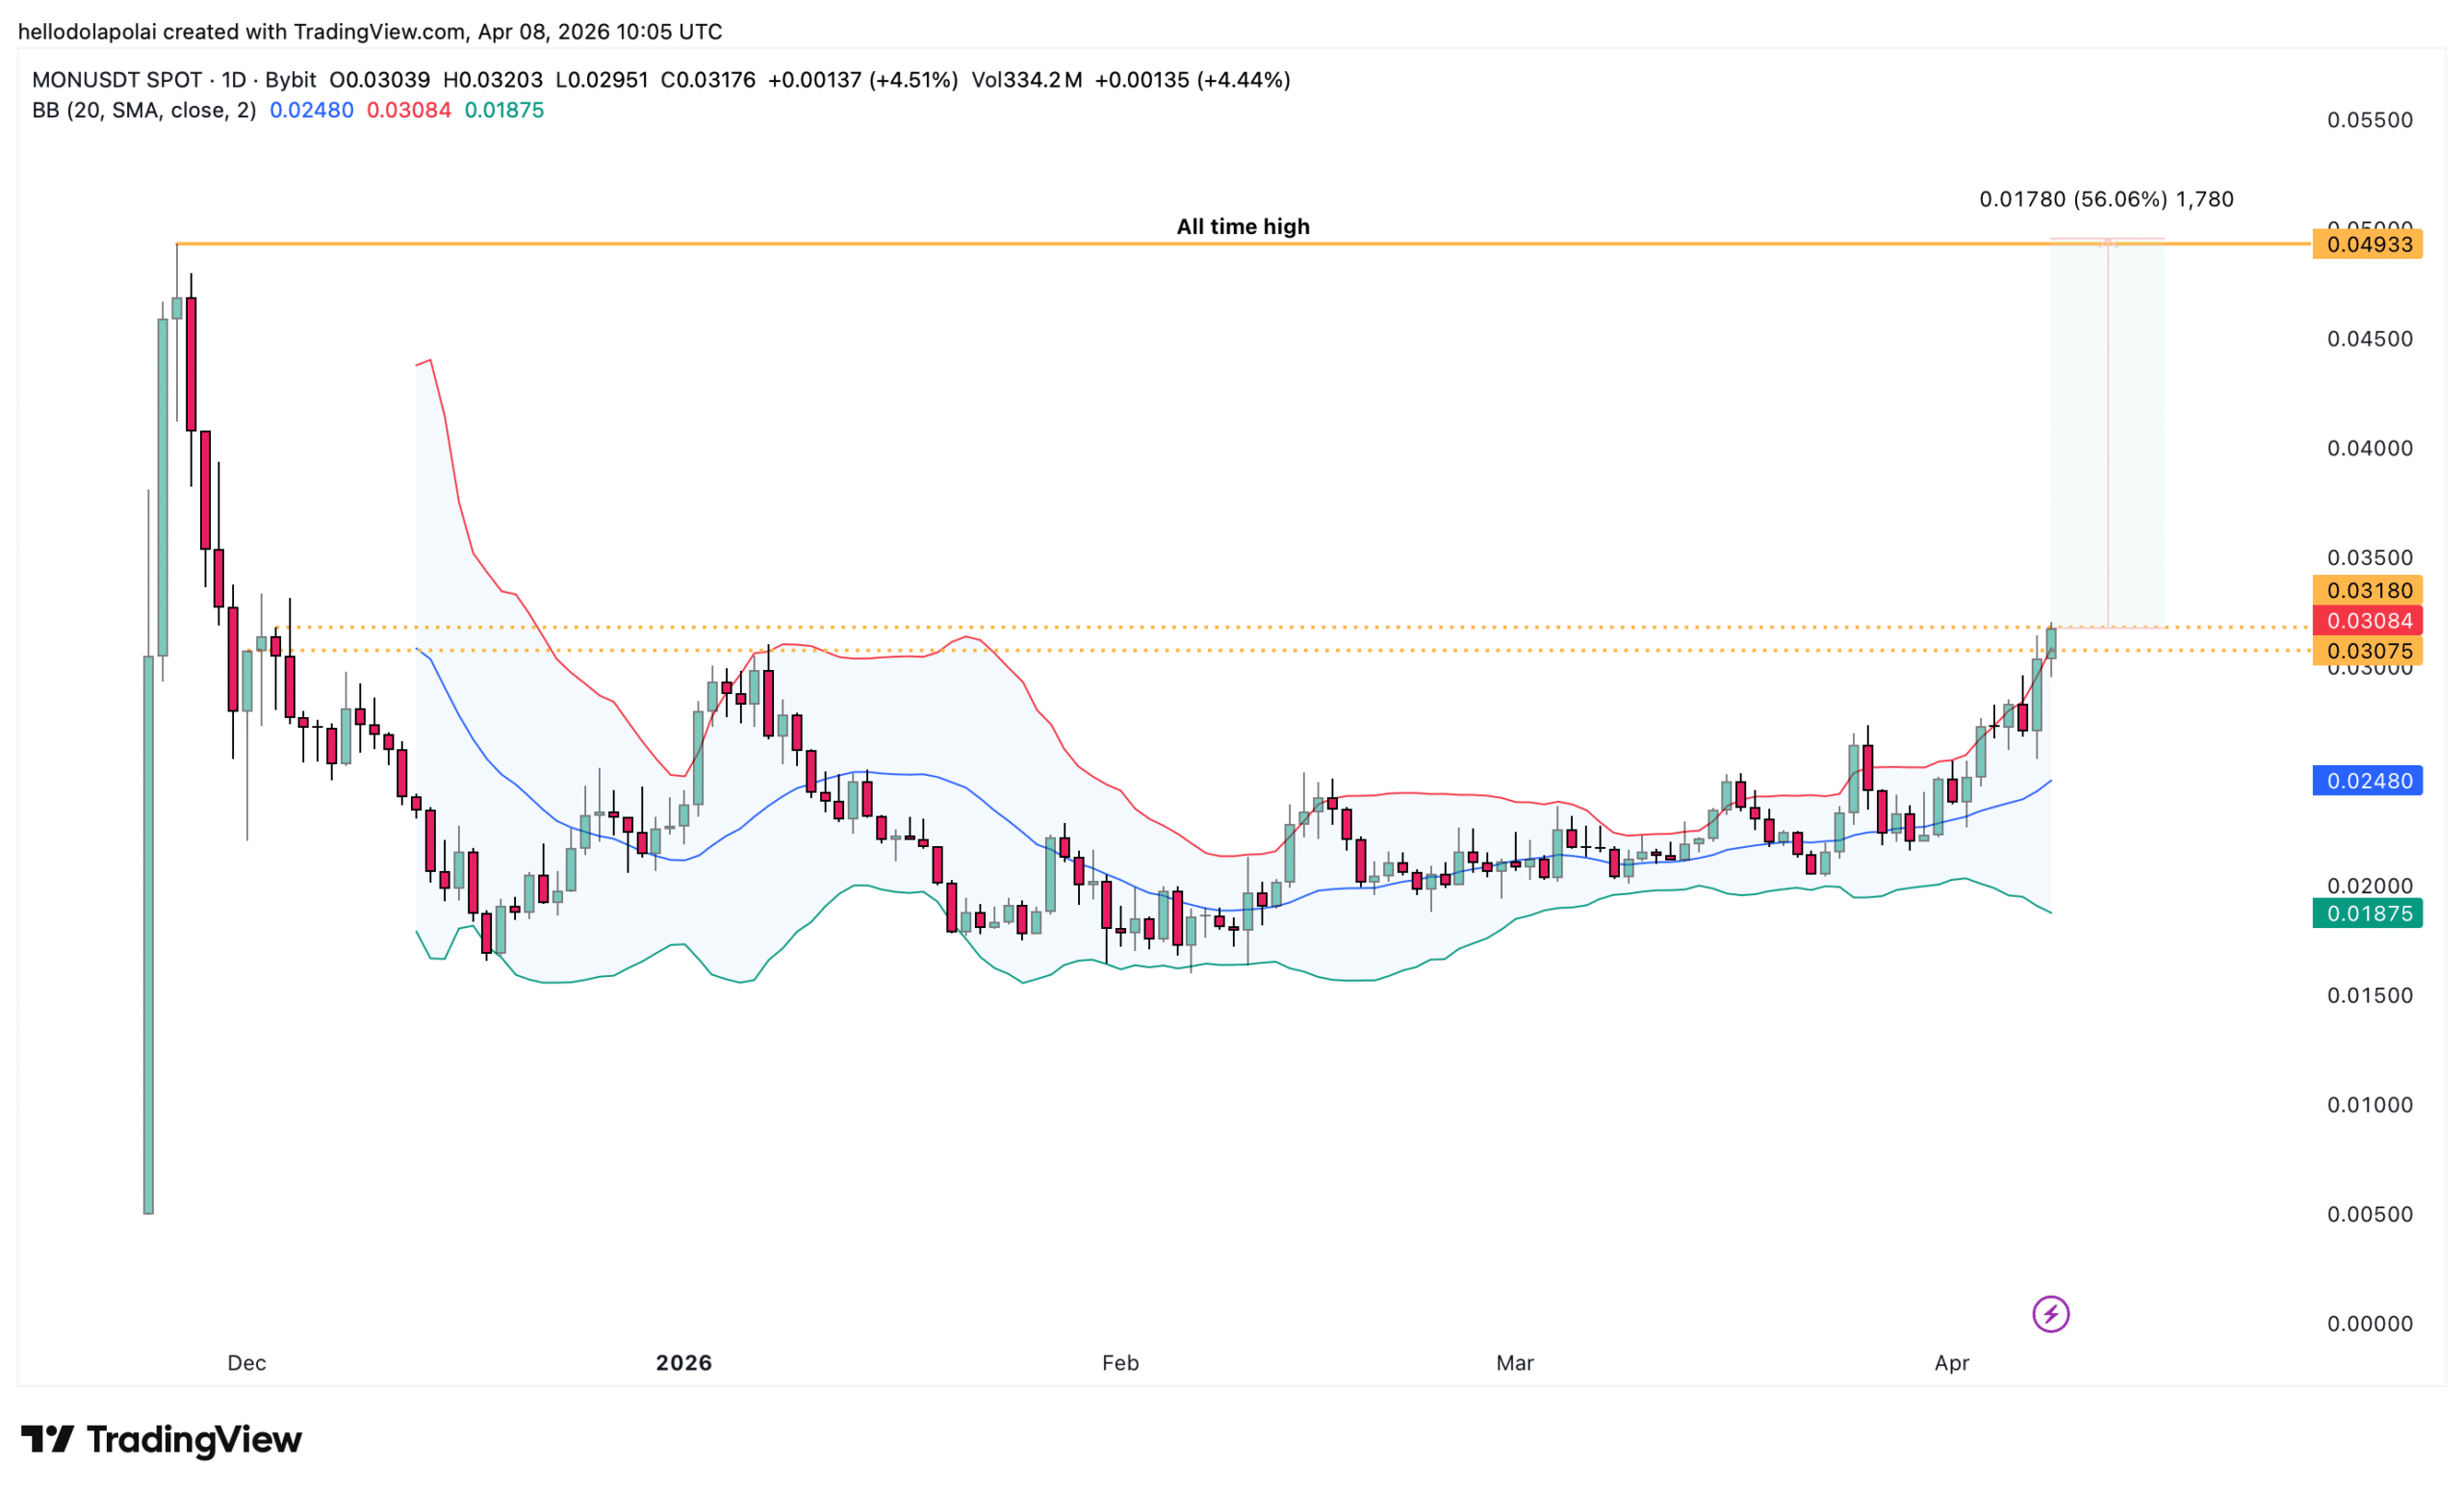
Bullish positioning comes with caution. The Bollinger Bands indicator, which measures whether an asset is overbought or oversold, shows that MON has entered the overbought region.

This level, marked by the upper band, suggests that buying pressure could weaken, potentially leading to a pullback toward lower levels, though not necessarily an immediate reversal.
Source: TradingView

This aligns with the resistance zone on the chart, which could act as a strong barrier and push prices lower. In that scenario, MON could form lower lows or continue to range, with the latter more likely if accumulation continues to build.

On the other hand, a breakout would significantly strengthen MON’s structure. Price would face less resistance on the path higher, as fewer supply zones remain overhead.

Is an all-time high likely?

A move toward a new all-time high depends on several factors, with capital inflow remaining the most critical.

A rally from the current level to the all-time high represents roughly a 56% increase. With a market capitalization of $1.52 billion, this would require an additional $851 million, pushing total valuation toward $2.37 billion.

For this to materialize, bullish sentiment must align across multiple fronts. Spot market accumulation must remain strong, perpetual Futures should continue to support long positioning, and broader crypto market sentiment must either turn bullish or stabilize.

At present, short-term data from both perpetual and Spot markets suggests that bulls remain in control. Over the past 10 days, MON’s perpetual flows reached $12.88 million, while Spot market inflows held at $7.31 million over the past five days, according to CoinGlass.


Final Summary

  • MON extends its run as accumulation surges again, while capital inflow into the market continues to rise.
  • A key resistance obstacle remains the critical level to watch in determining whether MON can sustain a major price rally.


Perguntas relacionadas

QWhat is the main obstacle Monad (MON) faces in its current rally according to the article?

AThe main obstacle is a key resistance block that is expected to cap further upside and could potentially push prices lower if not broken.

QWhich two indicators are highlighted as showing strong investor accumulation and capital inflow for MON?

AThe Accumulation/Distribution indicator and the Money Flow Index (MFI) both indicate strong accumulation and capital inflows.

QWhat does the Bollinger Bands indicator suggest about MON's current price level?

AThe Bollinger Bands indicator shows that the asset has entered the overbought region, suggesting buying pressure could weaken and a pullback is possible.

QHow much of a price increase is required for MON to reach a new all-time high from its current level?

AA rally from the current level to the all-time high would represent roughly a 56% increase.

QWhat are the three factors that must align for MON to achieve a new all-time high?

ASpot market accumulation must remain strong, perpetual Futures should continue to support long positioning, and broader crypto market sentiment must either turn bullish or stabilize.

Leituras Relacionadas

How Token Economy Reshapes the Business Rules of AI 'Measurement' | ToB Industry Observation

"Token Economy: How It Reshapes the Business Rules of AI's 'Metrics' | ToB Industry Observation" The article discusses how the token economy is fundamentally changing the business landscape for AI, moving from a phase of explosive technical supply to a focus on measurable value for enterprise demand. It highlights the astronomical growth in daily token usage in China, framing tokens as the new "measurement standard" or "electricity" of the intelligent era. A central challenge is determining a token's value, which varies drastically—up to 100,000x—across different applications, from drug discovery to casual chat. The concept of "high-quality tokens" that deliver real intelligence, versus "noise," is emphasized as crucial. Lenovo's Vice President shares three proposed "laws" of token economics: 1. **Law of Inertia:** The cost per token will continuously decline due to technological innovation, system optimization, and intelligent runtime scheduling. 2. **Law of Acceleration:** The value generated per token accelerates based on the depth of AI integration into business workflows, the level of engineering support, and organizational readiness. 3. **Law of the Singularity:** A tipping point where the value curve of AI application surpasses its cost curve, shifting from cost-saving to generating incremental, previously impossible value—enabling "innovation at scale." The article notes real-world struggles, such as companies exceeding AI budgets due to unpredictable token pricing and "token inflation" from agentic AI workflows. Solutions being explored include standardized metrics for token quality, transparent pricing, and new infrastructure like "Token Factories" for efficient, on-demand token production. The ultimate goal is for businesses to move past anxiety and reach the "singularity," where AI drives scalable innovation, akin to how electricity enabled countless modern appliances.

marsbitHá 9m

How Token Economy Reshapes the Business Rules of AI 'Measurement' | ToB Industry Observation

marsbitHá 9m

Bitcoin Rebounds to $64k as Fed Rate Hike Expectations Plummet?

Bitcoin rebounded strongly this week, climbing back above $60,000 and briefly touching $64,000. This recovery followed a significant drop after the U.S. presidential election, with the market now closely watching Federal Reserve policy signals. The key trigger was a weaker-than-expected June U.S. jobs report, showing only 57,000 new jobs versus an expected 115,000. While the unemployment rate fell, analysts noted concerning details like declining labor force participation. However, wage growth accelerated to 3.5% year-over-year, sustaining inflation concerns. Market focus has shifted to the upcoming July Consumer Price Index (CPI) data. Analysts expect a monthly decline in overall prices, partly due to falling gasoline costs. This has led traders to reduce bets on further Fed rate hikes this year, with markets now pricing in a high probability of rates holding steady at the July meeting. Fed Chair Kevin Warsh's recent comments about easing inflation risks have further supported this dovish shift. The anticipation of lower borrowing costs and a weaker dollar is seen as supportive for risk-sensitive assets like Bitcoin. Some investors are positioning for a potential Fed policy pivot to easing later this year, which could benefit "devaluation trades" including cryptocurrencies. Looking ahead, Bitcoin's price trajectory remains highly sensitive to U.S. economic data—particularly jobs and inflation reports—and evolving Fed policy expectations. Other critical factors include institutional ETF flows and geopolitical developments. Analysts suggest that if these factors improve, the recent sell-off could be seen as a buying opportunity; otherwise, high volatility may persist until a solid price floor is established.

marsbitHá 28m

Bitcoin Rebounds to $64k as Fed Rate Hike Expectations Plummet?

marsbitHá 28m

Trading

Spot
活动图片