Ethereum Price Surges Following The Final Testnet Details

newsbtcPublicado em 2022-07-31Última atualização em 2022-07-31

Resumo

The Ethereum community has been anticipating the move from the Proof-of-Work (PoW) to the Proof-of-Stake mechanism. Luckily for everyone, the Merge will soon occur, and reports show that the developers are approaching the final test phase before the significant event.

The Ethereum community has been anticipating the move from the Proof-of-Work (PoW) to the Proof-of-Stake mechanism. Luckily for everyone, the Merge will soon occur, and reports show that the developers are approaching the final test phase before the significant event.

Tim Beiko, the lead developer on Ethereum, disclosed these details on July 28. According to him, the testnet transition will take place on the Goerli testnet, a close simulation of the Ethereum mainnet.

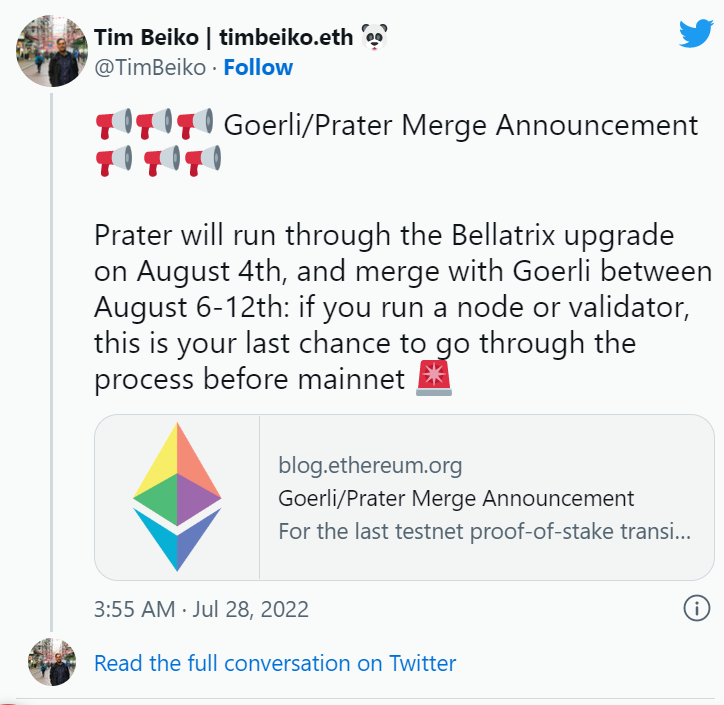
This version is known as Prator, and the date will be between August 6 and 12. The network upgrade will be called Paris, but another upgrade, Bellatrix, will position Prater well for the Goerl Merge.

According to Beiko, the date for the Bellatrix upgrade will be on August 4. However, the lead developer also stated that validators and those who run nodes on Ethereum should pass through the process to prepare thoroughly for the mainnet move to PoS.

Final Preparations Before Moving To PoS

According to the information released, the network has to complete one more testnet. The developers have completed many devnets, merges, and shadow forks on deprecated testnets. For instance, early in July, the developers ended the ninth shadow fork testing the MEV boost feature.

In the announcement, the lead developer stated that node operators must update their execution and consensus layer clients in tandem. But for stakers and holders of Ethereum, there’s nothing to do now. Those to take action are the testnet participants and node operators.

Regarding the significant Merge, the community already knows it will take place on September 19, as the developers previously announced. But if there is an issue with the Goerli testing phase, the date might be pushed forward again.

Merge Becomes The Most Significant Ethereum Upgrade

Since Ethereum started operating on July 30, 2015, this is the highest upgrade on the network. But the plans to migrate to the Poof-of-Work mechanism have been ongoing for some years. Unfortunately, the developers have had many delays, which haven’t been okay with the community.

Thankfully, September 2022 will mark the end of the frustrations. For instance, traders have staked 13.1 million ETH on Beacon Chain, worth $21.5 billion. Even though these stakers earn 4.6% APY in Ether, withdrawing the gains will only occur many months after the Merge.

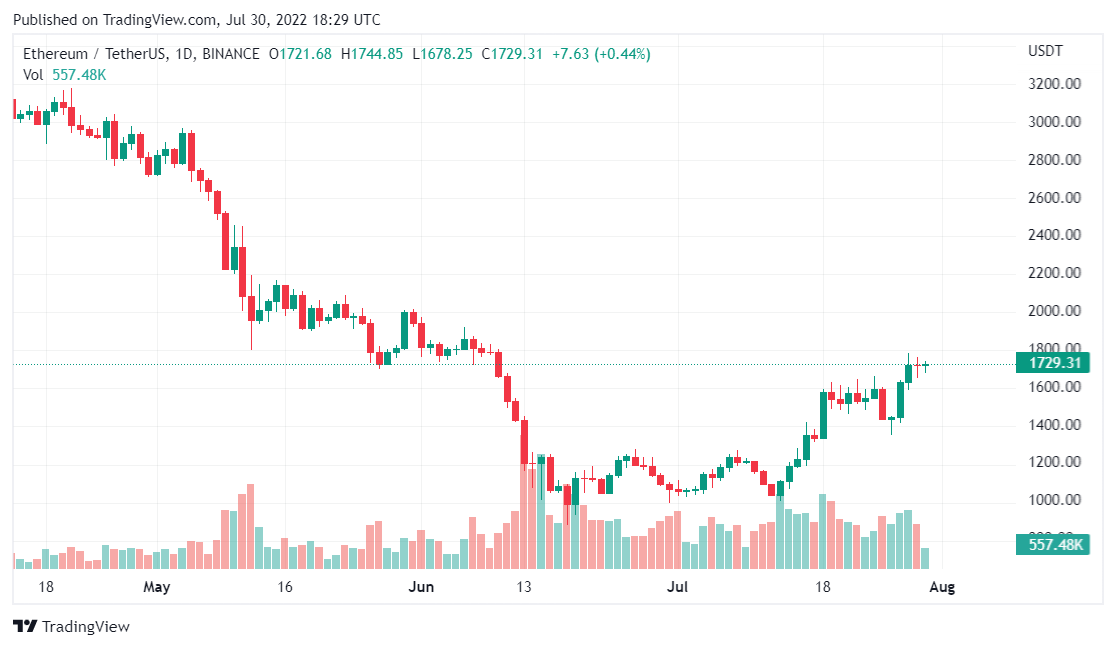
The announcement also brought another price surge for ETH as it gained by 15% on July 28 to sell at $1,667 during the morning hours of the Asian trading session. This position shows a 47% increase over two weeks, even though it has yet to reach its 2021 highest price point.

Leituras Relacionadas

Gate Research Institute: Analysis of Chart Patterns and Breakout Trading Strategies

Gate Research Institute: Chart Pattern Analysis and Breakout Trading Strategies Chart patterns are crucial tools in technical analysis for observing market supply and demand shifts, trend continuations, and reversals. This analysis involves a comprehensive evaluation of trend, volume, support/resistance, time cycles, and breakout validity, not just rote pattern recognition. Patterns are broadly categorized into reversal patterns (e.g., Double Tops/Bottoms, Head and Shoulders) and continuation patterns (e.g., Flags, Triangles, Rectangles). An effective breakout, key for trading, requires clear support/resistance, prolonged consolidation, a prevailing trend backdrop, and volume confirmation. However, breakouts are not guaranteed, as false breakouts are common. Risk must be managed through position sizing, stop-loss orders, pullback confirmations, and profit-taking in stages. Key pattern types discussed include: * **Rectangle Patterns:** Indicate market indecision within parallel support and resistance, with breakouts projecting a move equal to the pattern's width. * **Flag & Pennant Patterns:** Short-term continuation patterns following sharp price moves ("flagpoles"). * **Triangle Patterns:** Symmetrical, Ascending (bullish bias), and Descending (bearish bias) triangles, representing consolidation before a directional move. * **Head and Shoulders Patterns:** Major reversal patterns signaling trend exhaustion. The article details breakout trading strategies, defining valid breakouts by price closing beyond a key level with increased volume and minimal immediate re-entry into the prior range. It contrasts range trading with breakout trading and outlines entry methods (immediate entry, pullback entry, scaling in), stop-loss placement (based on pattern failure), and profit-taking techniques (target-based, structure-based, trend-following). It further classifies breakout outcomes: 1. **Valid Breakouts:** Strong, sustained moves in the breakout direction. 2. **Pullback Breakouts:** Price breaks out, retests the breakout level as support/resistance, then resumes the trend—offering a lower-risk entry. 3. **False Breakouts:** Price briefly breaches a level but quickly reverses back into the prior range, a common risk managed by strict stop-losses. Key validation tools for breakouts include volume analysis, the principle of support/resistance role reversal, and momentum indicators like ATR, Moving Averages, Bollinger Bands, and RSI. In conclusion, while chart patterns and breakout analysis provide a structured framework, their effectiveness relies on multiple confirming factors—trend context, volume, and proper risk management. They should be integrated into a broader trading system rather than used as standalone signals.

marsbitHá 23m

Gate Research Institute: Analysis of Chart Patterns and Breakout Trading Strategies

marsbitHá 23m

Joseph Chalom: Ethereum is Becoming the "Settlement Layer of Trust" for Global Finance

In a speech titled "The Industrialization of Trust," Sharplink CEO Joseph Chalom (former BlackRock digital assets head) discussed the future transformation of global finance. Drawing from 20 years at BlackRock, where he led the launch of Bitcoin/ETH ETFs and tokenized funds, Chalom highlighted the immense hidden costs of establishing trust in traditional finance—estimated at over $9.3 trillion annually in the US alone due to fragmented systems, multi-day settlements, and countless reconciliations. He argued that Ethereum is emerging as the global financial "settlement layer for trust," with its robust, decentralized infrastructure securing over $300 billion in on-chain assets and most stablecoins and tokenized assets. The future, he stated, will be driven by three accelerating pillars: stablecoins (evolving beyond crypto gateways to become efficient cross-border payment rails), tokenized assets (enabling 24/7 trading and reshaping capital markets), and DeFi (providing automated, accessible financial services). A potential game-changer, Chalom added, is the fourth pillar: "Agentic Finance," where AI agents autonomously execute programmable financial transactions via smart contracts and stablecoins. He envisions individuals soon having AI-powered "CFOs in their pockets" to optimize idle capital and manage tokenized portfolios. This shift, facilitated by Ethereum's trustless settlement, could multiply on-chain transaction volume 1000x within a year, moving finance toward a seamless, digitized future.

marsbitHá 23m

Joseph Chalom: Ethereum is Becoming the "Settlement Layer of Trust" for Global Finance

marsbitHá 23m

STRC Severely Unpegged, What Risks Is the Market Pricing In?

The article analyzes the recent significant de-pegging of Strategy's perpetual preferred stock, STRC, whose price fell to approximately $89, far below its $100 face value. This discount has pushed its simple yield to around 12.9%, creating a paradox. The stock was designed as a high-yield instrument trading near par, and Strategy maintains an 11.5% annual dividend, even recently switching to semi-monthly payments to support the price. The author explores several reasons why the high yield hasn't attracted enough buying pressure to restore the par value. A key factor is potential reverse deleveraging from carry trades, where leveraged investors may be forced to sell due to margin calls as the price falls, creating a self-reinforcing downward spiral. Additionally, the tokenization and integration of STRC into DeFi protocols (like Apyx, Saturn, Pendle) have introduced faster, more transparent, and potentially more volatile price adjustment mechanisms through leverage and yield-splitting products. The emergence of a competing product, Strive's SATA, offering a 13% yield with daily dividends, has also changed the yield benchmark, challenging STRC's unique high-yield narrative. Furthermore, the market is questioning the distinction between Strategy's substantial Bitcoin reserves, which provide long-term balance sheet coverage, and the certainty of stable near-term cash flow for dividends. Ultimately, the price dip represents a stress test for this type of BTC-backed, high-yield financing tool. The future path of STRC depends on whether Strategy acts to reinforce the $100 peg (e.g., by adjusting dividends), whether DeFi-related leverage unwinds further, and how investors ultimately price the risks of leverage, competition, and cash flow uncertainty against the offered yield.

marsbitHá 35m

STRC Severely Unpegged, What Risks Is the Market Pricing In?

marsbitHá 35m

LIT Token Hits Six-Month High: How Long Can the Buyback Flywheel Keep Burning Fuel?

The LIT token of decentralized perpetual exchange Lighter surged to a six-month high above $1.90 on June 18th, with a market cap of $425 million. After a price correction earlier this year, the recent rebound is attributed to its core "buyback flywheel" mechanism. All protocol fee revenue is used for programmatic, hourly market buybacks of LIT. Since its TGE in December 2025, approximately 15 million LIT (6% of circulating supply) has been repurchased for around $21 million. Additional price support comes from the LLP (Lighter Liquidity Pool), where providers must stake LIT worth 10% of their deposited USDC, locking significant token supply. However, challenges persist. Trading volume has declined amidst a sluggish market, with total volume at $1.68 trillion, significantly lower than leading competitor Hyperliquid's $4.37 trillion. While Lighter focuses on perpetual contracts, RWA, and Pre-IPO markets, Hyperliquid has expanded into prediction markets and boasts a U.S. spot ETF, attracting institutional investment and influencer endorsements like from Arthur Hayes. In contrast, LIT currently lacks similar high-profile backing. With 75% of LIT's total 1 billion supply still locked (team and investor tokens begin a 3-year linear unlock in December 2026), there is no immediate unlock selling pressure. The token's future performance hinges on sustaining trading volume growth, successful product iteration, and executing its transparent buyback strategy against a dominant competitor.

Foresight NewsHá 54m

LIT Token Hits Six-Month High: How Long Can the Buyback Flywheel Keep Burning Fuel?

Foresight NewsHá 54m

Trading

Spot
Futuros
活动图片