Tesla Dumped 75% of Its Bitcoin Holdings, Should We Worried?

HuobiPublicado em 2022-07-21Última atualização em 2022-07-25

Resumo

Tesla has significantly reduced its position on Bitcoin, but it may not have much negative impact on the market.

Tesla announced a massive reduction in bitcoin holdings on Wednesday night, which seems to show that Musk is giving up his belief in bitcoin? But Tesla’s position on Dogecoin remains unchanged which indicates that this dump may respond to Chinna‘s Covid regulation.

Other analysts argue that a Tesla sale would relieve the potential disruption Musk may cause to the crypto ecosystem and be more conducive to the long-term development of the industry.

1. Tesla dumped 75% of its Bitcoin holdings

Tesla’s Q2 financial report shows that the company reduced its bitcoin holdings by 75% to about $30,000, which added nearly $1 billion cash to its balance sheet.

On the earnings conference call, Elon Musk stressed that this move is a pre-judgment of the uncertain impact of the external environment and did not represent Tesla's forecast on the price of Bitcoin. He also insisted that Tesla may increase its position on cryptocurrencies in the future.

2. Why did Tesla sell its bitcoin?

Tesla had announced a 10% layoff plan for its regular employees and closed an office in Silicon Valley in last month. This year, due to the closure of Shanghai factory, Tesla’s did tremendous job to keep a health cash flow. Selling bitcoins in a bad market environment is a good move to hedge risks.

Since the beginning of this year, Tesla's short-term solvency has deteriorated, with its quick ratio and current ratio hitting a quiet low position for few years. In addition, due to the shutdown of the Shanghai factory, the demand for working capital has continued to increase, and the company's solvency is being tested.

So far, Tesla has withdrawn about 123.5 million US dollars from Bitcoin, and has not fully refunded for its inverstment (150 million US dollars). This large-scale withdrawal of Bitcoin should be interpreted as a helpless move.

From another perspective, Elon Musk is still in the lawsuit trouble with Twitter. Selling Bitcoin can alleviate the market’s worries about Tesla’s stock price, which will provide more financial support for the upcoming lawsuit.

3. Will Tesla's move sabotage Bitcoin's upward trend?

While the market appears to have pulled back slightly over the past ten hours, Bitcoin quickly stabilize after aborbing this news.

Tesla's dump may not necessarily be a bad thing for the BTC. If we use logic like: "Pendulum Effect", this rebound of BTC may not have seen the peaked.

We may still need to pay attention to the final decision of the market who will decide the market will choose "bounce"or "reversal"?

Appendix. Musk's Web3.0 journey

In 2002, Musk sold PayPal, and this start-up experience gave him a deeper understanding of the monetary system.

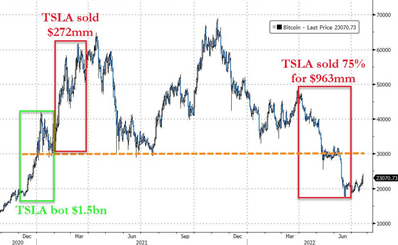
In February 2019, Musk tweeted that Bitcoin is well structured. This paved the way for Tesla’s $1.5 billion purchase of Bitcoin in January 2021.

On February 8, 2021, Tesla announced that it would begin accepting Bitcoin as a form of payment to its cars.

But in its Q1 2021 report, Tesla announced it had sale of $272 million in bitcoin.

In May of the same year, Tesla called a halt to Bitcoin as a means of payment, citied his concerns about "the rapid increase in the use of fossil fuels for Bitcoin mining."

In the 2022 Q2 earnings report, Tesla announced the sale of $963 million in Bitcoin to meet the funding needs of the unexpected environment. He also mentioned that Tesla did not sell Dogecoin.

Leituras Relacionadas

Gate Research Institute: Analysis of Chart Patterns and Breakout Trading Strategies

Gate Research Institute: Chart Pattern Analysis and Breakout Trading Strategies Chart patterns are crucial tools in technical analysis for observing market supply and demand shifts, trend continuations, and reversals. This analysis involves a comprehensive evaluation of trend, volume, support/resistance, time cycles, and breakout validity, not just rote pattern recognition. Patterns are broadly categorized into reversal patterns (e.g., Double Tops/Bottoms, Head and Shoulders) and continuation patterns (e.g., Flags, Triangles, Rectangles). An effective breakout, key for trading, requires clear support/resistance, prolonged consolidation, a prevailing trend backdrop, and volume confirmation. However, breakouts are not guaranteed, as false breakouts are common. Risk must be managed through position sizing, stop-loss orders, pullback confirmations, and profit-taking in stages. Key pattern types discussed include: * **Rectangle Patterns:** Indicate market indecision within parallel support and resistance, with breakouts projecting a move equal to the pattern's width. * **Flag & Pennant Patterns:** Short-term continuation patterns following sharp price moves ("flagpoles"). * **Triangle Patterns:** Symmetrical, Ascending (bullish bias), and Descending (bearish bias) triangles, representing consolidation before a directional move. * **Head and Shoulders Patterns:** Major reversal patterns signaling trend exhaustion. The article details breakout trading strategies, defining valid breakouts by price closing beyond a key level with increased volume and minimal immediate re-entry into the prior range. It contrasts range trading with breakout trading and outlines entry methods (immediate entry, pullback entry, scaling in), stop-loss placement (based on pattern failure), and profit-taking techniques (target-based, structure-based, trend-following). It further classifies breakout outcomes: 1. **Valid Breakouts:** Strong, sustained moves in the breakout direction. 2. **Pullback Breakouts:** Price breaks out, retests the breakout level as support/resistance, then resumes the trend—offering a lower-risk entry. 3. **False Breakouts:** Price briefly breaches a level but quickly reverses back into the prior range, a common risk managed by strict stop-losses. Key validation tools for breakouts include volume analysis, the principle of support/resistance role reversal, and momentum indicators like ATR, Moving Averages, Bollinger Bands, and RSI. In conclusion, while chart patterns and breakout analysis provide a structured framework, their effectiveness relies on multiple confirming factors—trend context, volume, and proper risk management. They should be integrated into a broader trading system rather than used as standalone signals.

marsbitHá 29m

Gate Research Institute: Analysis of Chart Patterns and Breakout Trading Strategies

marsbitHá 29m

Joseph Chalom: Ethereum is Becoming the "Settlement Layer of Trust" for Global Finance

In a speech titled "The Industrialization of Trust," Sharplink CEO Joseph Chalom (former BlackRock digital assets head) discussed the future transformation of global finance. Drawing from 20 years at BlackRock, where he led the launch of Bitcoin/ETH ETFs and tokenized funds, Chalom highlighted the immense hidden costs of establishing trust in traditional finance—estimated at over $9.3 trillion annually in the US alone due to fragmented systems, multi-day settlements, and countless reconciliations. He argued that Ethereum is emerging as the global financial "settlement layer for trust," with its robust, decentralized infrastructure securing over $300 billion in on-chain assets and most stablecoins and tokenized assets. The future, he stated, will be driven by three accelerating pillars: stablecoins (evolving beyond crypto gateways to become efficient cross-border payment rails), tokenized assets (enabling 24/7 trading and reshaping capital markets), and DeFi (providing automated, accessible financial services). A potential game-changer, Chalom added, is the fourth pillar: "Agentic Finance," where AI agents autonomously execute programmable financial transactions via smart contracts and stablecoins. He envisions individuals soon having AI-powered "CFOs in their pockets" to optimize idle capital and manage tokenized portfolios. This shift, facilitated by Ethereum's trustless settlement, could multiply on-chain transaction volume 1000x within a year, moving finance toward a seamless, digitized future.

marsbitHá 29m

Joseph Chalom: Ethereum is Becoming the "Settlement Layer of Trust" for Global Finance

marsbitHá 29m

STRC Severely Unpegged, What Risks Is the Market Pricing In?

The article analyzes the recent significant de-pegging of Strategy's perpetual preferred stock, STRC, whose price fell to approximately $89, far below its $100 face value. This discount has pushed its simple yield to around 12.9%, creating a paradox. The stock was designed as a high-yield instrument trading near par, and Strategy maintains an 11.5% annual dividend, even recently switching to semi-monthly payments to support the price. The author explores several reasons why the high yield hasn't attracted enough buying pressure to restore the par value. A key factor is potential reverse deleveraging from carry trades, where leveraged investors may be forced to sell due to margin calls as the price falls, creating a self-reinforcing downward spiral. Additionally, the tokenization and integration of STRC into DeFi protocols (like Apyx, Saturn, Pendle) have introduced faster, more transparent, and potentially more volatile price adjustment mechanisms through leverage and yield-splitting products. The emergence of a competing product, Strive's SATA, offering a 13% yield with daily dividends, has also changed the yield benchmark, challenging STRC's unique high-yield narrative. Furthermore, the market is questioning the distinction between Strategy's substantial Bitcoin reserves, which provide long-term balance sheet coverage, and the certainty of stable near-term cash flow for dividends. Ultimately, the price dip represents a stress test for this type of BTC-backed, high-yield financing tool. The future path of STRC depends on whether Strategy acts to reinforce the $100 peg (e.g., by adjusting dividends), whether DeFi-related leverage unwinds further, and how investors ultimately price the risks of leverage, competition, and cash flow uncertainty against the offered yield.

marsbitHá 41m

STRC Severely Unpegged, What Risks Is the Market Pricing In?

marsbitHá 41m

LIT Token Hits Six-Month High: How Long Can the Buyback Flywheel Keep Burning Fuel?

The LIT token of decentralized perpetual exchange Lighter surged to a six-month high above $1.90 on June 18th, with a market cap of $425 million. After a price correction earlier this year, the recent rebound is attributed to its core "buyback flywheel" mechanism. All protocol fee revenue is used for programmatic, hourly market buybacks of LIT. Since its TGE in December 2025, approximately 15 million LIT (6% of circulating supply) has been repurchased for around $21 million. Additional price support comes from the LLP (Lighter Liquidity Pool), where providers must stake LIT worth 10% of their deposited USDC, locking significant token supply. However, challenges persist. Trading volume has declined amidst a sluggish market, with total volume at $1.68 trillion, significantly lower than leading competitor Hyperliquid's $4.37 trillion. While Lighter focuses on perpetual contracts, RWA, and Pre-IPO markets, Hyperliquid has expanded into prediction markets and boasts a U.S. spot ETF, attracting institutional investment and influencer endorsements like from Arthur Hayes. In contrast, LIT currently lacks similar high-profile backing. With 75% of LIT's total 1 billion supply still locked (team and investor tokens begin a 3-year linear unlock in December 2026), there is no immediate unlock selling pressure. The token's future performance hinges on sustaining trading volume growth, successful product iteration, and executing its transparent buyback strategy against a dominant competitor.

Foresight NewsHá 1h

LIT Token Hits Six-Month High: How Long Can the Buyback Flywheel Keep Burning Fuel?

Foresight NewsHá 1h

Trading

Spot
Futuros
活动图片