Tether Mints Another 1B USDT – $7B in Stablecoins Issued Since The Crash

bitcoinistPublicado em 2025-10-23Última atualização em 2025-10-23

Resumo

Tether has just minted another 1 billion USDT, only hours ago, reigniting debate over stablecoin-driven liquidity flows across the crypto...

Trusted Editorial content, reviewed by leading industry experts and seasoned editors. Ad Disclosure

Tether has just minted another 1 billion USDT, only hours ago, reigniting debate over stablecoin-driven liquidity flows across the crypto market. The mint comes at a crucial time — Bitcoin is struggling to reclaim higher levels after weeks of volatility, while altcoins continue to bleed as if a full-blown bear market were underway.
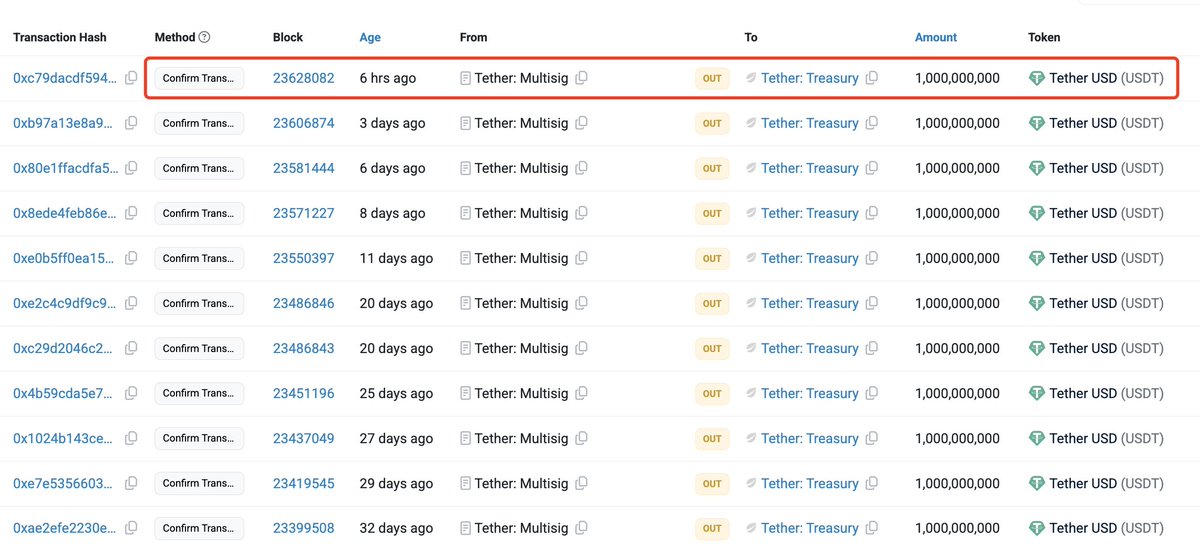
Tether mints $1B USDT | Source: Lookonchain

These mints tend to inject liquidity into exchanges, providing the capital needed for traders and market makers to re-enter positions or stabilize volatile price swings. While not always an immediate bullish catalyst, they frequently precede recoveries in market sentiment and volume.

The latest mint follows a wave of renewed uncertainty across the crypto landscape, with investors closely watching Bitcoin’s $110K level as a make-or-break support zone. Altcoins, meanwhile, are experiencing double-digit declines, raising concerns that risk appetite remains weak.

If history is any indication, this new influx of stablecoin liquidity could be setting the stage for a short-term rebound — or at least a temporary relief rally — as liquidity begins to circulate across major exchanges and derivative markets in the days ahead.

A Liquidity Wave That Could Shake the Market

According to data from Lookonchain, Tether and Circle have collectively minted over $7 billion in stablecoins since the October 10 market crash. This surge in new supply marks one of the most significant liquidity injections since midyear, sparking speculation about its potential impact on Bitcoin and the broader crypto market.

Stablecoin mints on this scale often act as precursors to major price swings. While not a direct form of buying, they indicate that fresh capital is being positioned to enter the market — typically through market makers, institutional desks, or exchanges preparing for renewed trading activity. In this context, the $7 billion influx suggests that liquidity conditions are improving after the sharp drawdown that liquidated billions in long positions earlier this month.

Related Reading: 2,496 Bitcoin Moved After Years Of Inactivity – Long-Term Holders Take Action

However, such rapid capital movement can also heighten volatility. As this liquidity begins to circulate, it can amplify both sides of the market — first triggering relief rallies as buyers re-enter, and then sharp corrections as leveraged positions unwind.

For Bitcoin, the timing is especially critical. With BTC still struggling to hold above $108K–$110K, this new liquidity could determine whether the next move is a bullish breakout or another leg lower. Historically, large stablecoin issuances have preceded upward shifts in Bitcoin’s price, but in a fragile market, they can also fuel speculative whipsaws.

Tether’s USDT Dominance Rebounds As Traders Seek Stability

Tether’s market dominance has risen sharply to around 5.06%, signaling a notable shift in sentiment as investors move capital into stablecoins amid heightened market volatility. The weekly chart shows a strong rebound from the 4.6% level, with USDT dominance now testing resistance near the 100-week moving average. This uptick coincides with the broader crypto market downturn following Bitcoin’s failure to hold key support at $110K and widespread selling across altcoins.
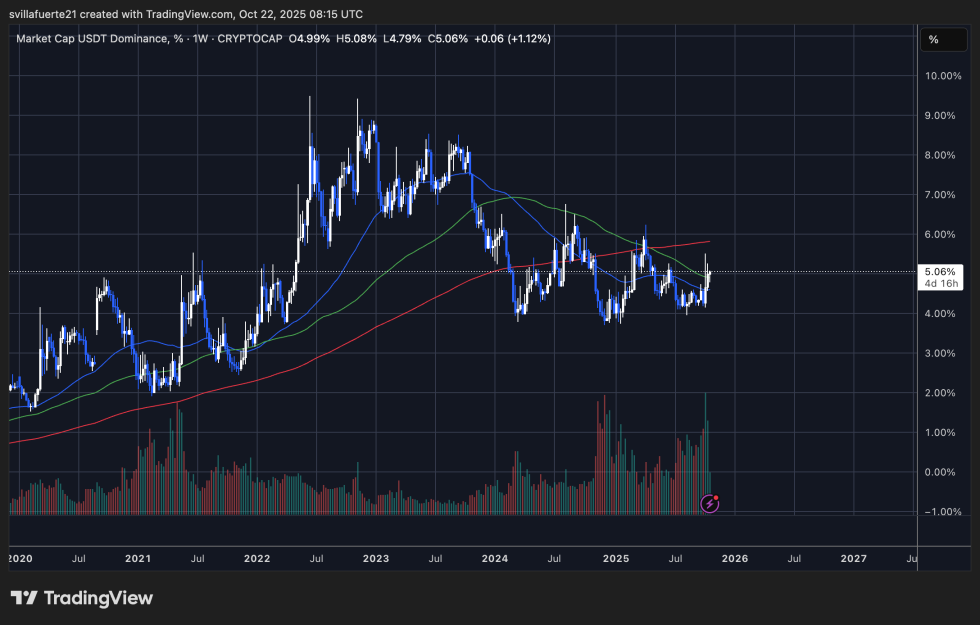
USDT Market Dominance | Source: USDT.C.D chart on TradingView

Historically, rising USDT dominance reflects increased demand for safety — traders exiting volatile assets and parking capital in stablecoins to wait for clearer market direction. This pattern often precedes periods of accumulation, as sidelined liquidity builds up, ready to re-enter once confidence returns.

From a technical standpoint, the structure suggests that a sustained breakout above 5.2% could extend the dominance rally toward 6%, a level last seen during previous market corrections. However, rejection here would imply stabilization and potential capital rotation back into risk assets.

Featured image from ChatGPT, chart from TradingView.com

Editorial Process for bitcoinist is centered on delivering thoroughly researched, accurate, and unbiased content. We uphold strict sourcing standards, and each page undergoes diligent review by our team of top technology experts and seasoned editors. This process ensures the integrity, relevance, and value of our content for our readers.

Sebastian's journey into the world of crypto began four years ago, driven by a fascination with the potential of blockchain technology to revolutionize financial systems. His initial exploration focused on understanding the intricacies of various crypto projects, particularly those focused on building innovative financial solutions. Through countless hours of research and learning, Sebastian developed a deep understanding of the underlying technologies, market dynamics, and potential applications of cryptocurrencies. As his knowledge grew, Sebastian felt compelled to share his insights with others. He began actively contributing to online discussions on platforms like X and LinkedIn, focusing on fintech and crypto-related content. His goal was to expose valuable trends and insights to a wider audience, fostering a deeper understanding of the rapidly evolving crypto landscape. Sebastian's contributions quickly gained recognition, and he became a trusted voice in the online crypto community. To further enhance his expertise, Sebastian pursued a UC Berkeley Fintech: Frameworks, Applications, and Strategies certification. This rigorous program equipped him with valuable skills and knowledge regarding Financial Technology, bridging the gap between traditional finance (TradFi) and decentralized finance (DeFi). The certification deepened his understanding of the broader financial landscape and its intersection with blockchain technology. Sebastian's passion for finance and writing is evident in his work. He enjoys delving into financial research, analyzing market trends, and exploring the latest developments in the crypto space. In his spare time, Sebastian can often be found immersed in charts, studying 10-K forms, or engaging in thought-provoking discussions about the future of finance. Sebastian's journey as a crypto analyst and investor has been marked by a relentless pursuit of knowledge and a dedication to sharing his insights. His ability to navigate the complex world of crypto, combined with his passion for financial research and communication, makes him a valuable asset to the industry. As the crypto landscape continues to evolve, Sebastian remains at the forefront, providing valuable insights and contributing to the growth of this revolutionary technology.

Leituras Relacionadas

BofA Research Report Analysis: Marvell Takes TPU Peripherals, Broadcom Holds Core Value of $250 Billion

Bank of America's report analyzes the impact of Google's new custom chip agreement with Marvell on the TPU supply chain. While Marvell secured a deal for "XPU-attach" chips (like AI inference accelerators and memory controllers), corresponding to a potential $120B in cumulative purchases, BofA argues the core high-value components remain with Broadcom. Broadcom retains design and supply for the core ASIC, advanced packaging, HBM integration, high-speed SerDes, and network switching/physical layer connectivity. These form the highest Bill-of-Materials (BOM) value in TPU systems. BofA estimates Google's 5-year capex could reach $1.5-$2T, with TPU systems representing 25-30% ($400B-$600B TAM). Within this, Broadcom is projected to hold a 55-60% value share ($250B-$350B), Marvell 10-20% ($50B-$100B), and MediaTek 20-30% in lower-value, cost-optimized chips. The report emphasizes Broadcom's entrenched position through long-term agreements locked until CY31, increasing silicon content per TPU generation, and high unit value creating a competitive barrier. It sets a $530 price target for Broadcom (30x CY27 P/E), viewing current valuation as attractive given growth certainty from AI and locked leadership. Downsides include semiconductor cycles, customer concentration, and debt. In conclusion, while competition reshapes the supply chain for peripheral chips, the core high-value structure and Broadcom's dominance in compute silicon remain intact.

marsbitHá 23m

BofA Research Report Analysis: Marvell Takes TPU Peripherals, Broadcom Holds Core Value of $250 Billion

marsbitHá 23m

Semiconductor Mid-Game Check-in: How Much Left in the Tail-End Rally?

Semiconductor Mid-Game Review: How Much is Left in the Rally? This analysis compares the current semiconductor market trend to NVIDIA's trajectory in 2024, drawing lessons on identifying market tops and bottoms. In July-August 2024, NVIDIA's stock fell 33%, triggered by a combination of "fundamental rumors" (Blackwell delays, antitrust probes) and "macro-driven asset selling" (BOJ rate hike leading to carry-trade unwinding). The low was marked by extreme panic selling across global markets. Key characteristics of a TOP include: Technical patterns like double tops or failure to break highs; Overcrowded and leveraged positioning (e.g., excessive retail and ETF inflows into a single stock like NVDA); High fragility where even a minor fundamental disappointment (e.g., a slight margin dip in stellar earnings) triggers a sharp correction. The practical action is to reduce exposure upon seeing technical warning signs combined with crowded trades. Key characteristics of a BOTTOM include: Technical reversal signals like a high-volume bullish engulfing pattern after a steep drop; Panic indicators hitting extremes (e.g., record VIX, major index crashes) signaling selling exhaustion; The downturn being driven by macro or systemic shocks unrelated to the company's core business fundamentals, creating a mispricing that quality companies eventually recover from. The conclusion is that while the current semiconductor rally may be in its later stages ("fish tail"), understanding these patterns—where tops form from crowded optimism and bottoms from panic unrelated to fundamentals—can help navigate remaining volatility.

marsbitHá 43m

Semiconductor Mid-Game Check-in: How Much Left in the Tail-End Rally?

marsbitHá 43m

Trading

Spot
活动图片