Bitcoin whales are accumulating, but why is BTC’s growth stunted

AmbcryptoPublicado em 2022-07-05Última atualização em 2022-07-05

Resumo

Bitcoin has had a lot of support from the community over the years. These holders have maintained an undeterred positive narrative despite challenging market conditions. However, BTC’s price didn’t quite show the same enthusiasm.

Bitcoin, the largest cryptocurrency has had a lot of support from the community over the years. These holders have maintained an undeterred positive narrative despite challenging market conditions. However, BTC’s price didn’t quite show the same enthusiasm.

Holders assemble

Bitcoin has been extremely choppy of late, the king coin lost 7% over the last week. This marked the worst quarter for Bitcoin as the coin shed close to 50% in the second quarter of this year. At press time, BTC traded under the $20k mark despite holders buying the dip.

Whales (wallets with over 1k BTC) have been stacking BTC at a good pace. At present, the group bought 140k BTC per month from crypto exchanges and now owns 8.69 million BTC which is about 45.6% of the circulating supply.
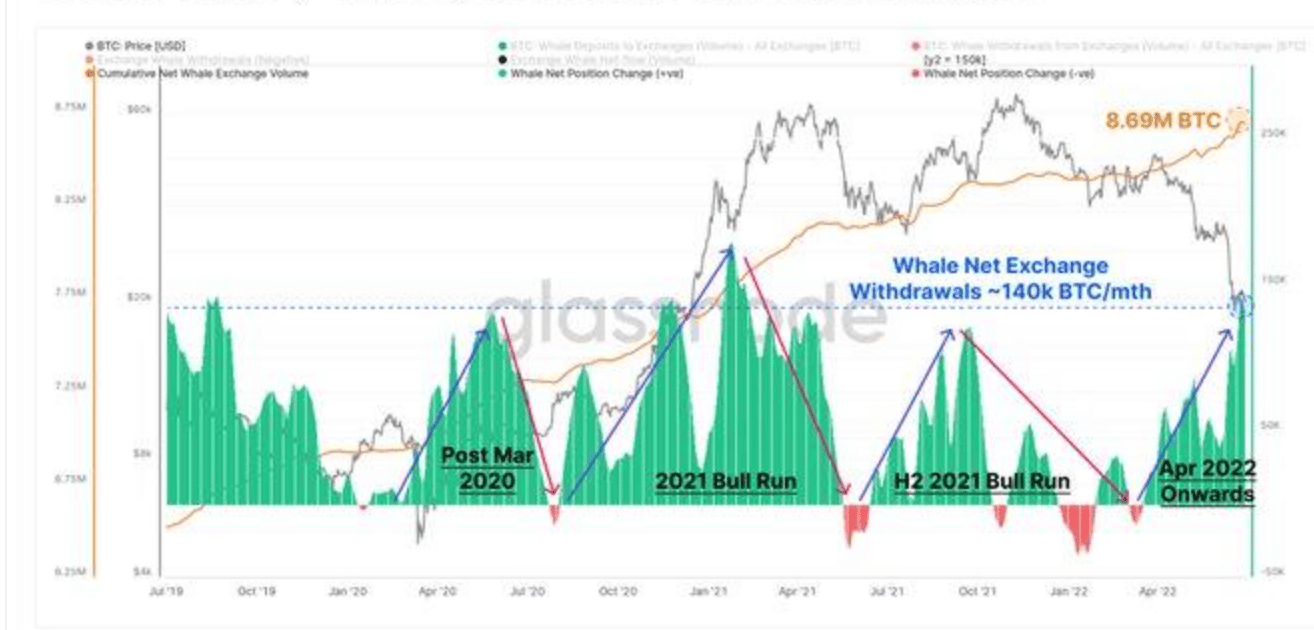
Source: Glassnode

However, the accumulation has been very slow. This is one of the reasons why the price didn’t appreciate much. Moreover, shrimps as well (wallets with one or less than one BTC) have capitalized on the dip.

In the past two quarters, shrimps have added about 36.75k BTC per month which is about 0.2% of the aggregate circulating supply and now hold 1.12 million BTC in total.
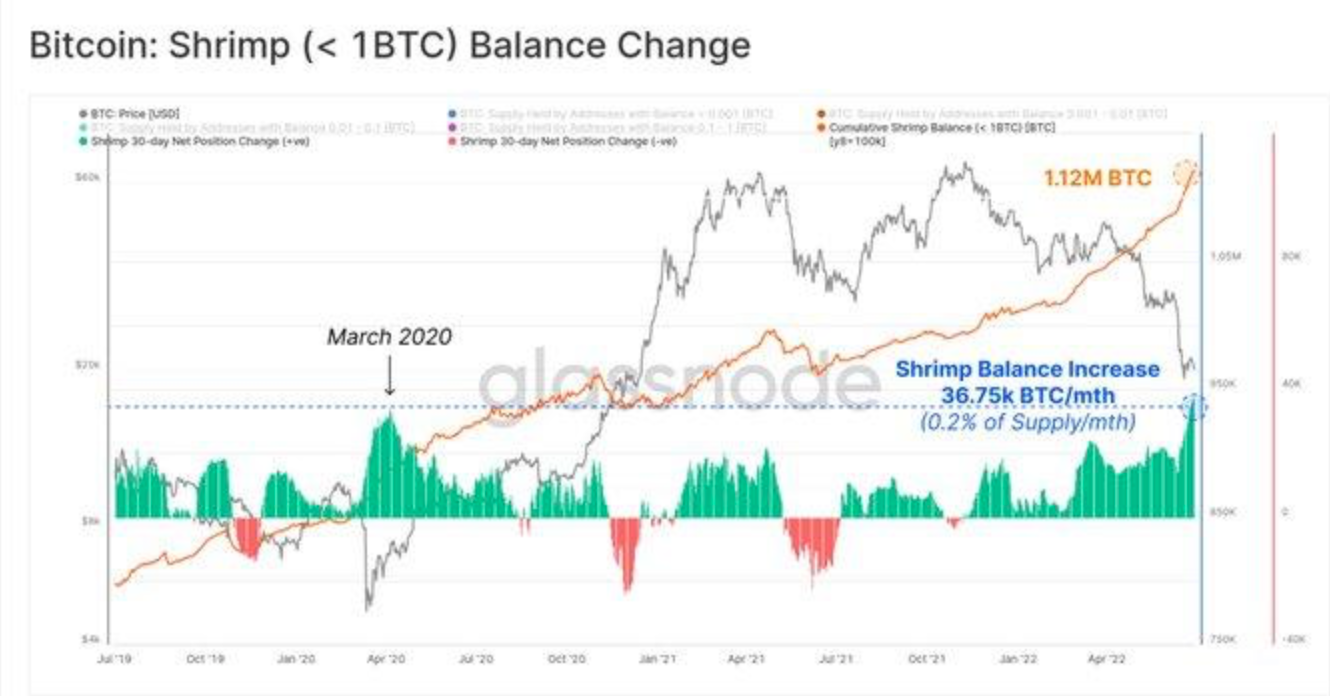
Source: Glassnode

Needless to say, although the second group acquired more BTC relative to the first, it didn’t quite affect BTC’s price. Santiment, an analytical platform shed more light on this situation. Consider the graph below. BTC’s largest whale transaction spikes happened on minor rallies. Ergo, keeping the prices ‘dormant.’
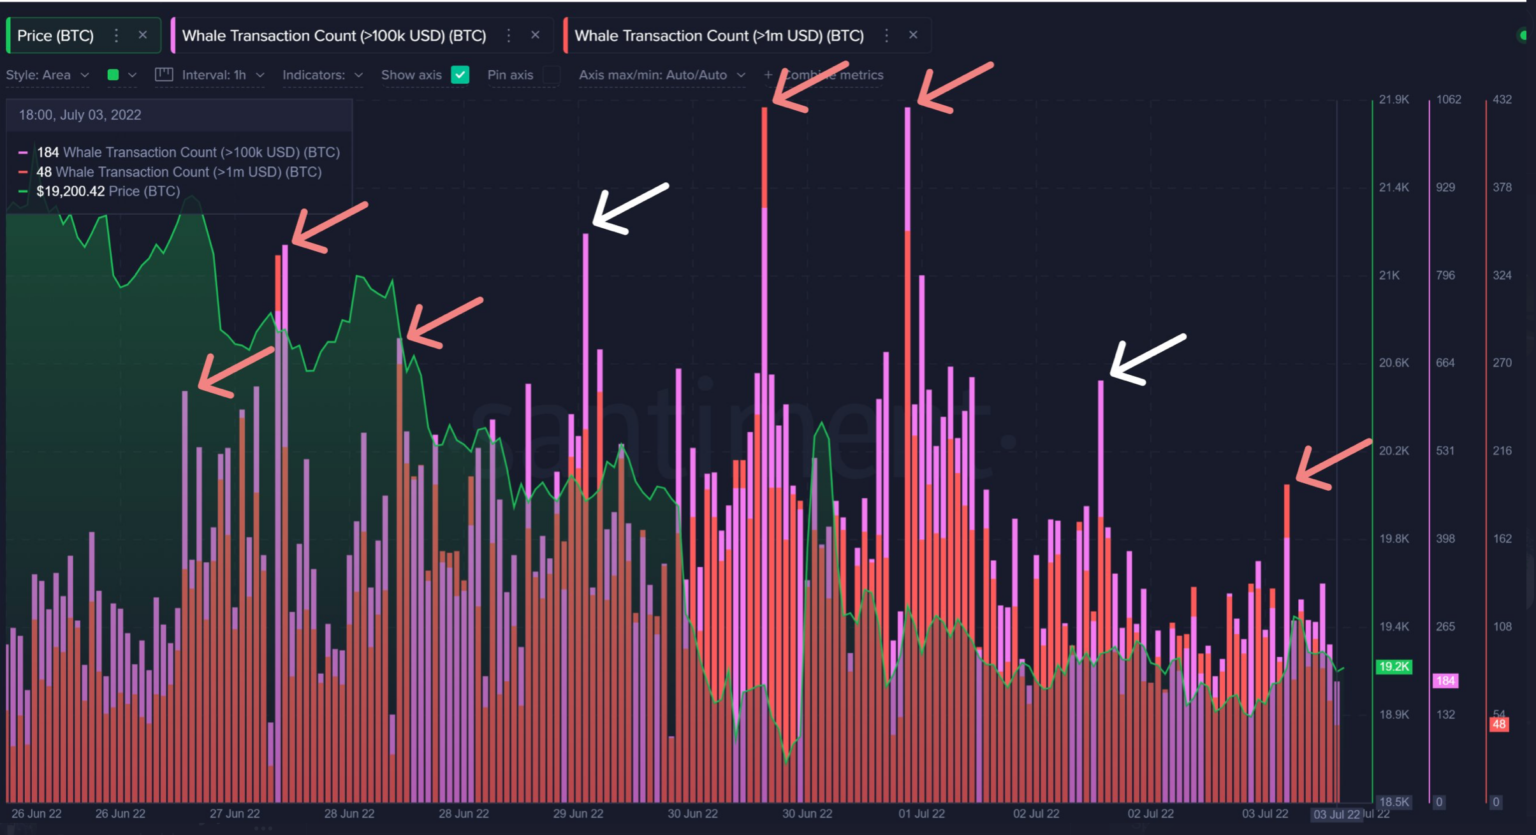
Source: Santiment

The vast majority of the largest spikes in BTC’s whale transactions occurred after small $100 to $200 $BTC price gains. However, ‘prices have subsequently fallen after each of these temporary increases in $100k+ or $1M+ transactions.’

Opportunity arises

Dominant buyers or long-term holders are scared to lose more portions of their portfolios. An analyst shared a solution for the aforementioned problem. Not to forget that Bitcoin is approaching a price zone that could offer a highly favorable risk-reward ratio for long-term BTC investors.

A crypto strategist Rekt Capital narrated this scenario to his 320,900 Twitter followers in a recent tweet.

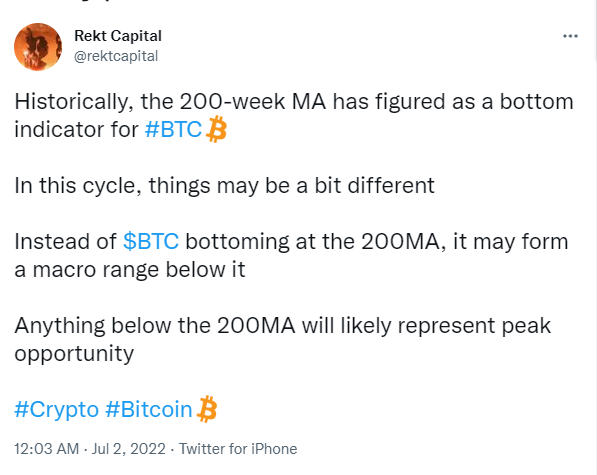
Eventually, Bitcoin is expected to face seller exhaustion as it traded below the 200-week moving average at the press time. This could eventually put long-term investors in a position to pick up BTC at a price area that offers maximum rewards.

Leituras Relacionadas

Bitcoin Trading Strategy Breakdown: Celebrity Predictions and Classic Models All Fail, Only These Four Indicators Remain

Analysis of Bitcoin Trading Strategies: Why Celebrity Forecasts and Classic Models Fail, Leaving Only These Four Reliable Indicators This analysis examines the failure of common Bitcoin prediction methods and identifies four reliable indicators for constructing a trading strategy. The author reviewed all major BTC prediction approaches from 2017-2025, categorizing them into three groups: celebrity price targets (consistently over-optimistic), analytical models like Stock-to-Flow (broken post-2022), and on-chain signals. The key finding is that more data often creates confusion, not clarity. The strategy discards unreliable elements: celebrity predictions (incentivized to be extreme), pure models (invalidated by post-ETF market changes), and the Fear & Greed Index used alone (too many false signals). Four reliable indicators were selected: 1. **MVRV Z-Score:** Accurately identifies cycle bottoms when entering its green zone (e.g., 2018, 2020, 2022). Note: Its ability to call tops is now ineffective post-2024. 2. **SOPR (28-day MA):** Consistently signals bottoms when below 1.0, indicating holders are selling at a loss. 3. **ETF Net Flow:** A crucial post-2024 metric showing institutional momentum (e.g., sustained inflows = buying). 4. **Macro Liquidity (Fed policy & M2):** Sets the overall directional bias (e.g., bullish during easing cycles). The core strategy involves waiting for a multi-signal共振 (resonance). For example, a bottom signal requires MVRV in the green zone + SOPR < 1.0. A top signal requires overheated on-chain data + sustained ETF outflows. Macro policy sets the overall direction. The Fear & Greed Index is only used as a weighted confirmatory signal, never alone. Action is only taken when three or more indicators align. The author automated this into a monitoring system that sends Telegram alerts only when signals trigger. As of the article's date (April 15, 2026), the system showed a strong bottom signal: extreme fear (F&G=12), MVRV in the buy zone, and SOPR < 1.0. The only contrary signal was weak ETF flows. Historically, such triple on-chain共振 has preceded 100%+ returns. The conclusion emphasizes building a personal framework over relying on external predictions, allowing for iterative improvement and customization based on individual risk tolerance.

marsbitHá 2h

Bitcoin Trading Strategy Breakdown: Celebrity Predictions and Classic Models All Fail, Only These Four Indicators Remain

marsbitHá 2h

Trading

Spot
Futuros
活动图片