Bitcoin Eyes $97,000-$99,000 As Key Support Zone If Price Decline Persists – Analyst

bitcoinistPublicado em 2025-06-01Última atualização em 2025-06-02

Resumo

Bitcoin prices fell by over 3% in the past week as the broader crypto market suffers from a general price...

Trusted Editorial content, reviewed by leading industry experts and seasoned editors. Ad Disclosure

Bitcoin prices fell by over 3% in the past week as the broader crypto market suffers from a general price correction influenced by macroeconomic pressure. Notably, the premier cryptocurrency now trades above $104,000 representing an estimated 7% decline from its new all-time high at $111,970. Amidst what may yet be a mere correction, market analyst Daan Crypto has highlighted a support zone with strong potentials to halt any further price decline. 

$97,000-$99,000 Emerges As Key BTC Price Level

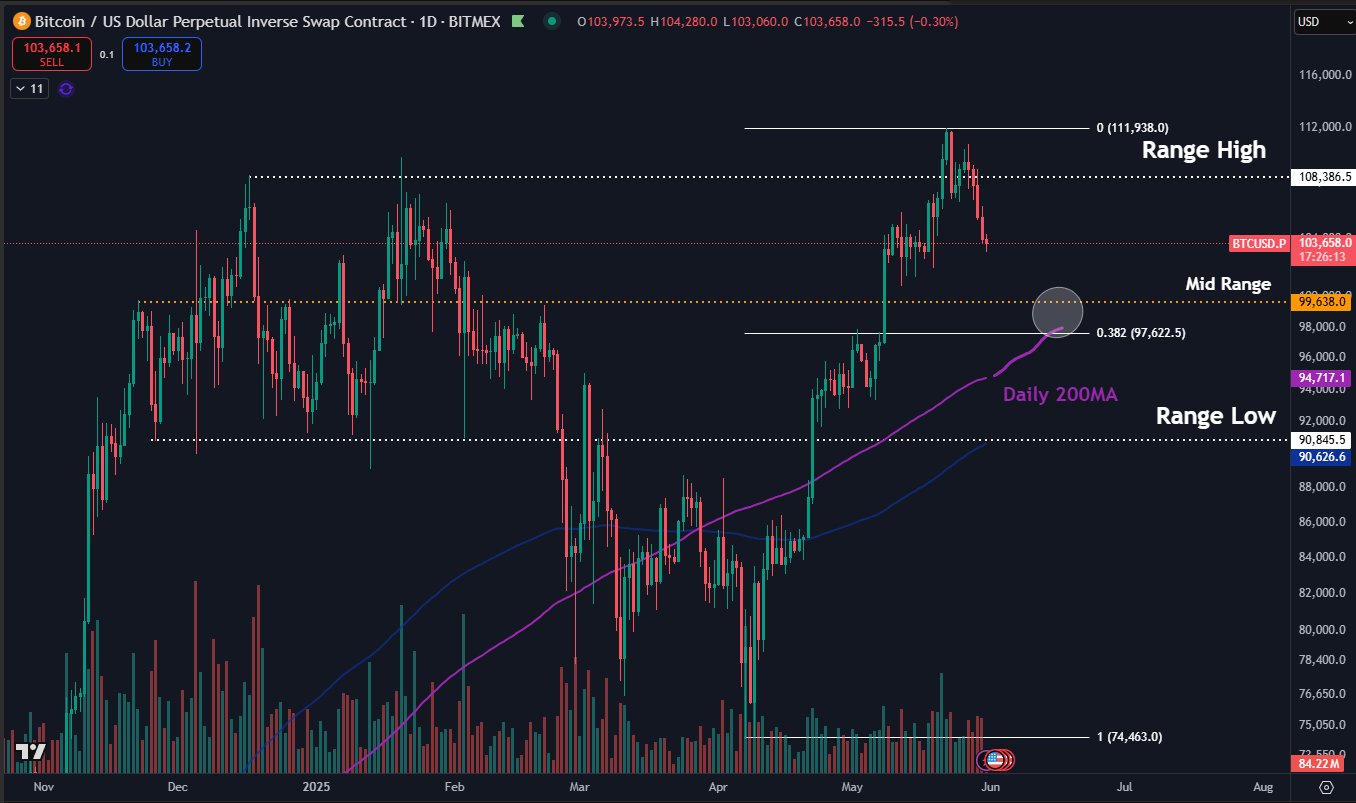
In a brief X post on May 31, Daan Crypto has shared a cautious outlook on Bitcoin amidst an ongoing price correction. The analyst notes that if the retracement persists into June, Bitcoin is likely to fall to around $97,000 -$99,000 at which it may find a credible market resistance.

Daan Crypto’s selection of this price range as the next major support level for Bitcoin stems from a confluence of technical indicators. As seen in the chart below, the $97,000-$99,000 price region represents the mid range of Bitcoin trading channel between $90,845 and $108,386, alongside hosting the 200-day moving average and the 0.382 Fibonacci retracement level.
Bitcoin
Source: @DaanCrypto on X

The mid-range in a trading channel usually serves as a key level of support or resistance, depending on where the price is relative to it. Amidst Bitcoin’s price correction, the current mid-range at $97,000-$99,000 represents the next major price floor for the premier cryptocurrency — a decisive price fall below which would signal a bearish price trend.

Meanwhile, the 0.382 Fibonacci retracement level represents a healthy market correction zone meaning prices generally pull back to this area before resuming the initial trend. In addition, the 200 day MA is a long-term indicator averaging the market closing price over the past 200 days. It also functions as a support level during bullish trends acting as a common retest level before price continues an uptrend.

Generally, all three indicators suggest the $97,000-$99,000 would act as a sound technical support zone should Bitcoin price dip any further. However, the loss of the support zone would threaten Bitcoin’s bullish potential with the next support level set around $94,000.

Bitcoin Price Overview

At press time, Bitcoin trades at $104,650 reflecting a slight price gain of 0.14% in the past day. The premier cryptocurrency also reports a monthly gain of 7.21% indicating that the majority of new market entrants remain in profits. However, the weekly decline of 2.86% suggests there is need for a resurgence in market demand to halt a creeping bearish sentiment investment.

Bitcoin
BTC trading at $104,632 on the daily chart | Source: BTCUSDT chart on Tradingview.com
Featured image from Pexels, chart from Tradingview
Editorial Process for bitcoinist is centered on delivering thoroughly researched, accurate, and unbiased content. We uphold strict sourcing standards, and each page undergoes diligent review by our team of top technology experts and seasoned editors. This process ensures the integrity, relevance, and value of our content for our readers.

Semilore Faleti works as a crypto-journalist at Bitconist, providing the latest updates on blockchain developments, crypto regulations, and the DeFi ecosystem. He is a strong crypto enthusiast passionate about covering the growing footprint of blockchain technology in the financial world.

Leituras Relacionadas

After Aave's Exit and TVL's Sharp Fluctuation, Where Does MegaETH's Valuation Anchor Lie?

Following the withdrawal of Aave and a sharp drop in its Total Value Locked (TVL), the valuation of the high-performance DeFi blockchain MegaETH faces scrutiny. Once a highly anticipated project with a fully diluted valuation (FDV) reaching around $2 billion, MegaETH saw its TVL plummet from a May peak of $245 million to just over $30 million in July, a roughly 70% decline. Its native token, MEGA, currently trades around $0.048 with a market cap of approximately $54 million and an FDV of about $480 million. The report identifies a core vulnerability: MegaETH's TVL was heavily dependent on a single protocol, Aave V3, which at its peak contributed around 90% of the chain's TVL. A significant portion of this capital is attributed to leveraged yield-farming strategies involving stablecoins like USDe. When the profitability of these strategies diminished, capital rapidly exited, exposing the lack of diversified, sustainable activity. Three key mismatches between MegaETH's valuation and its fundamentals are highlighted: 1. **Valuation vs. Real Usage:** With an FDV of ~$4.8B but only ~$1M in annualized protocol revenue and ~2,600 daily active addresses, the valuation appears disconnected from current economic activity. 2. **Token Narrative vs. Ecosystem Reality:** Despite its DeFi narrative, nearly 80% of the chain's recent protocol revenue comes from a trading card game, Monster, not from core DeFi applications like Aave. The chain's native stablecoin, USDM, also shows low trading volume and a declining market cap. 3. **Short-Term Hype vs. Long-Term Delivery:** Initial hype from token generation, blue-chip integrations, and influencer support has faded. Major protocols like Uniswap now hold minimal TVL on the chain, indicating that early capital was largely transient and driven by incentives rather than organic demand. The situation reflects a broader market trend where investors are becoming less tolerant of valuations based on inflated TVL and narrative, demanding clearer evidence of sustainable transactions, revenue, and ecosystem development. While MEGA's price may experience short-term rebounds from market sentiment, a fundamental re-rating likely depends on the team's ability to convert its remaining resources into tangible, user-retaining applications and genuine ecosystem growth.

链捕手Há 5h

After Aave's Exit and TVL's Sharp Fluctuation, Where Does MegaETH's Valuation Anchor Lie?

链捕手Há 5h

Trading

Spot
活动图片