Rippling Away

insights.glassnodePublicado em 2025-04-01Última atualização em 2025-04-02

Executive Summary

  • The Bitcoin market continues to consolidate within the $76k to $87k range, with the Realized Profit/Loss Ratio starting to show signs of near-term seller exhaustion but not yet a renewal of sustained bullish momentum.
  • A longer-term view reveals a deterioration of investor profitability, and an on-chain ‘Death-Cross’ has occurred, suggesting the market may remain weak for the foreseeable future.
  • Supply in loss remains elevated at 4.7M BTC, while the behavior of coins held in-loss is signalling moderate investor stress. Together, these metrics build a picture of deepening bearish conditions.
  • Ripple’s XRP network recently experienced a +490% spike in address activity and a near-doubling of Realized Cap, signalling aggressive retail interest. However, profitability has rapidly faded, suggesting retail interest may be increasingly fragile.
💡
View all charts in this edition in The Week On-chain Dashboard.

Short-Term Relief

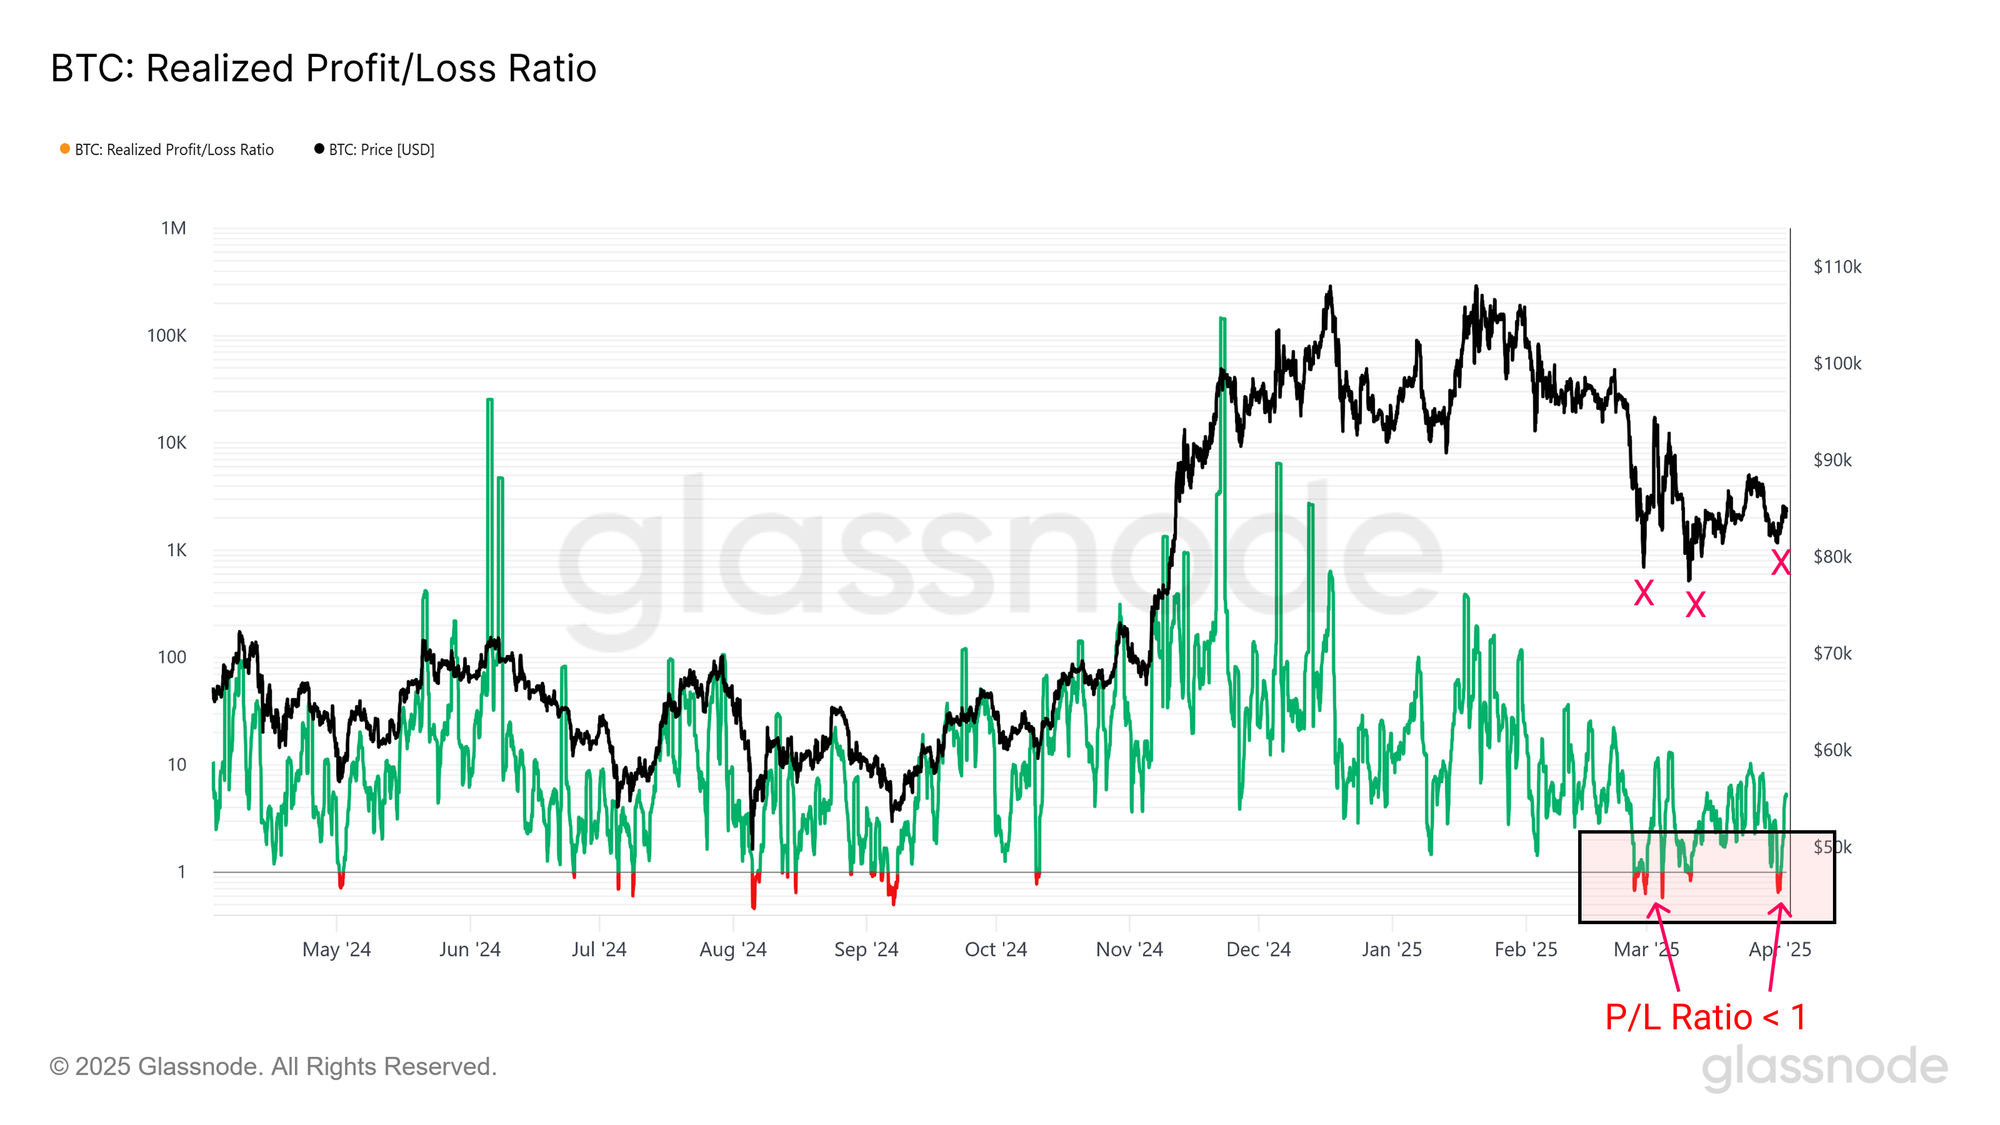
Recent weeks in digital asset markets have been defined by a steady downtrend, with Bitcoin prices trading -30% below the ATH. During this correction, the $76k to $85k zone has emerged as a critical area of interest, with the market trading in this range since late February. Each sell-off towards the range lows has been met with a swift recovery, suggesting the presence of strong reactive demand has shown up whenever prices trade below $80k.

To better understand these dynamics, we turn to the Realized Profit/Loss Ratio — a metric that compares the USD volume of realized profits versus losses. When this ratio falls below 1.0, it signals that more capital is being locked in a loss than a profit. These retests of the 1.0 level often coincide with local capitulation events and short-term price reversals.

Most notably, each dip into the $76k to $80k range has coincided with a P/L Ratio dipping below 1.0, highlighting episodes where losses outweighed profits. This imbalance typically marks a degree of seller exhaustion, where downside momentum fades as sell-side pressure is absorbed.

The resulting rebound appears as relief rallies, but we have not yet seen signs of renewed and sustained strength, reflecting a market which is still processing the emotional and financial hangover of the $109k ATH peak.
Live Chart

Zooming Out

Although short-term seller exhaustion can provide momentary relief, a deeper question emerges: Are these rebounds signs of a larger bullish impulse, or simply reactive bounces within a broader downtrend?

While some market participants may speculate that repeated bounce-backs from the $76k–$80k range could eventually rally toward new all-time highs, a longer-term perspective is necessary to gauge the sustainability of such momentum.

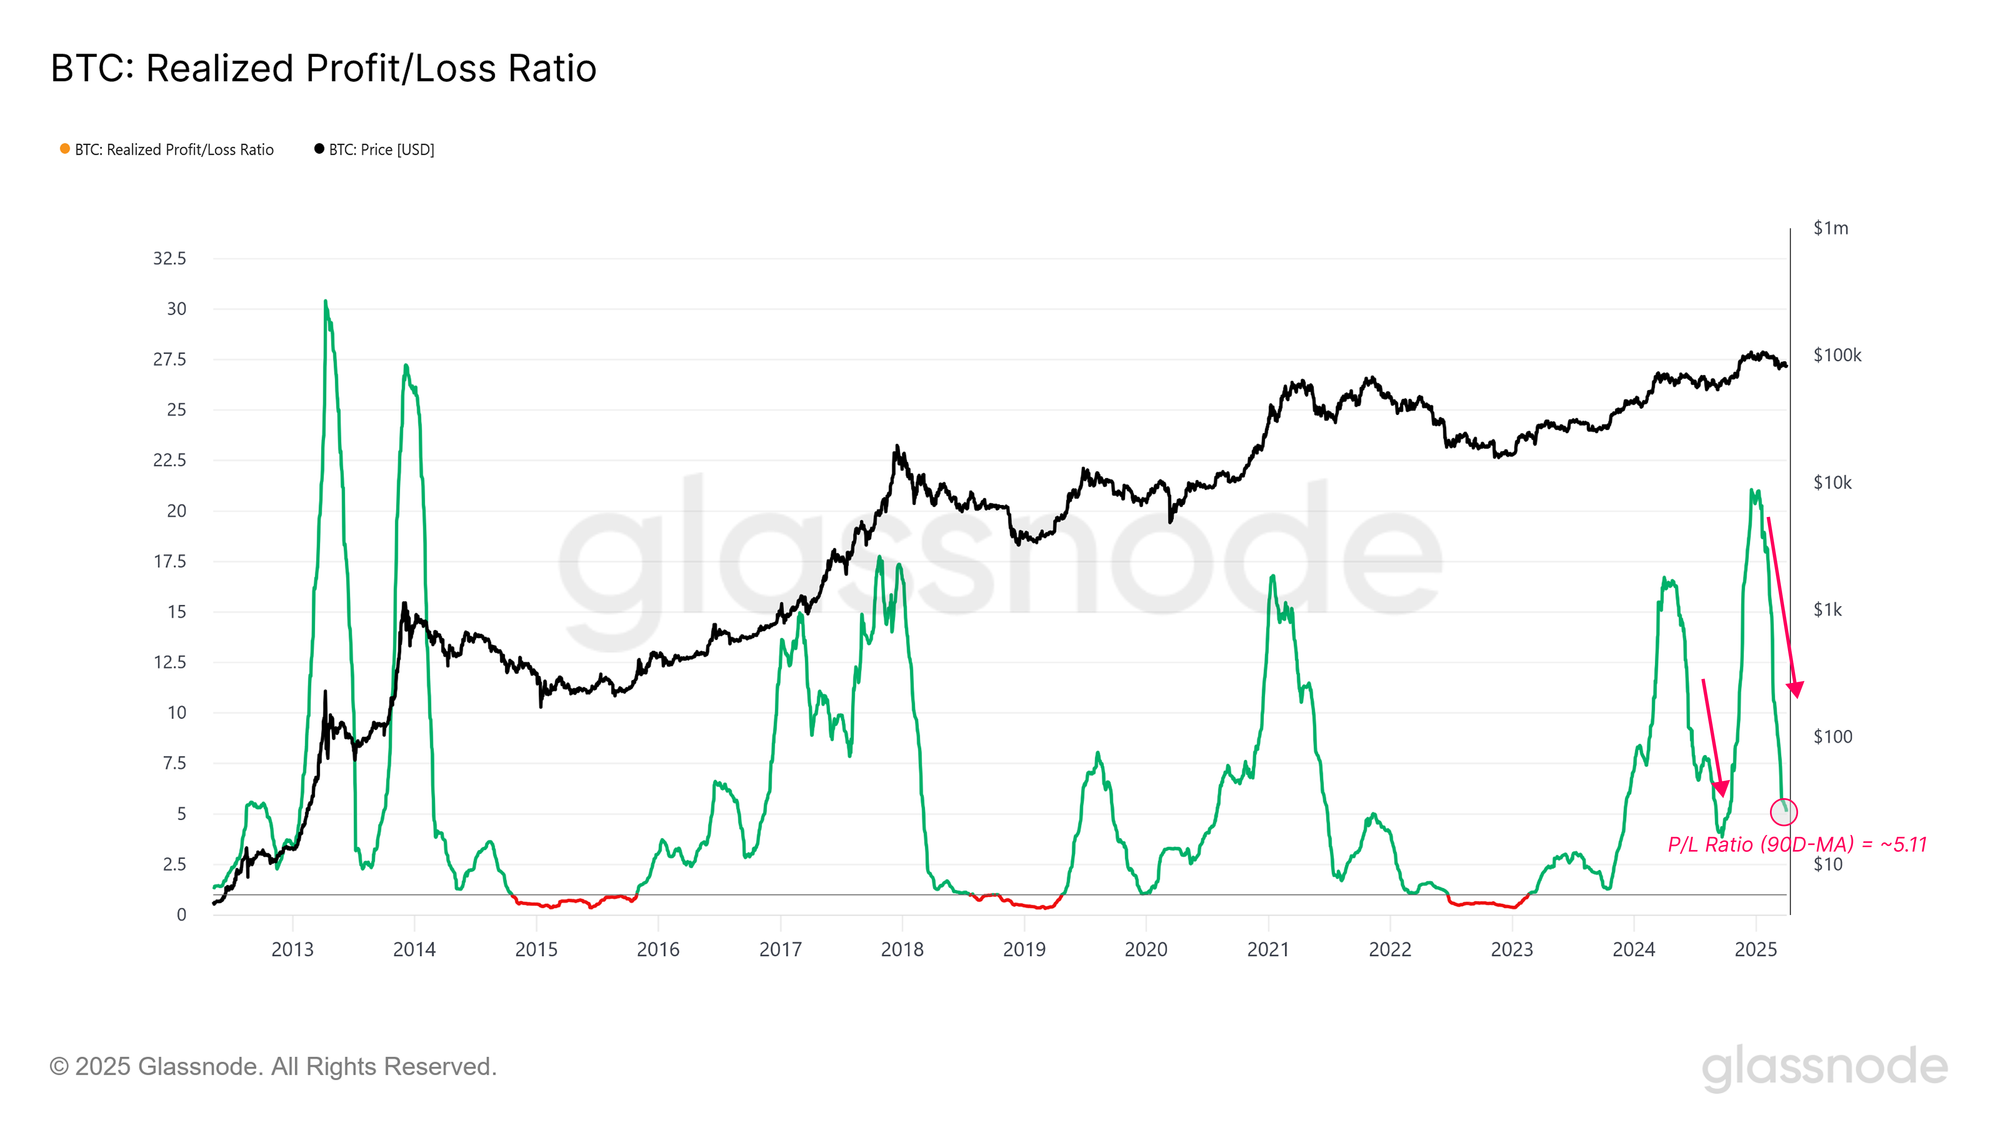
The Realized Profit/Loss Ratio, is traditionally shown in logarithmic scale due to its volatility and wide range. To provide a clearer view of broader market dynamics, we have plotted a 90-day simple moving average to the metric on a linear scale. This smoothed presentation helps filter out the daily noise and highlights prevailing trends in spending profitability.

From this vantage point, the longer-term momentum has declined markedly since early January, despite the recent short-term spikes seen on the raw daily resolution. These brief profit-driven surges have failed to reverse the broader downtrend, suggesting that the macro picture remains one of generally weaker liquidity and deteriorating investor profitability.

So far, there is little evidence suggesting a structural bullish shift in momentum is underway.
Live Chart

An On-Chain Death Cross

With profitability trending lower, it’s logical to turn our attention to price momentum as a core driver behind investors locking in both profit and loss.

Traditionally, technical analysts identify major shifts in momentum when a “Death Cross” occurs, indicating where the 50-day moving average drops below the 200-day. This event often signals a weakening trend.

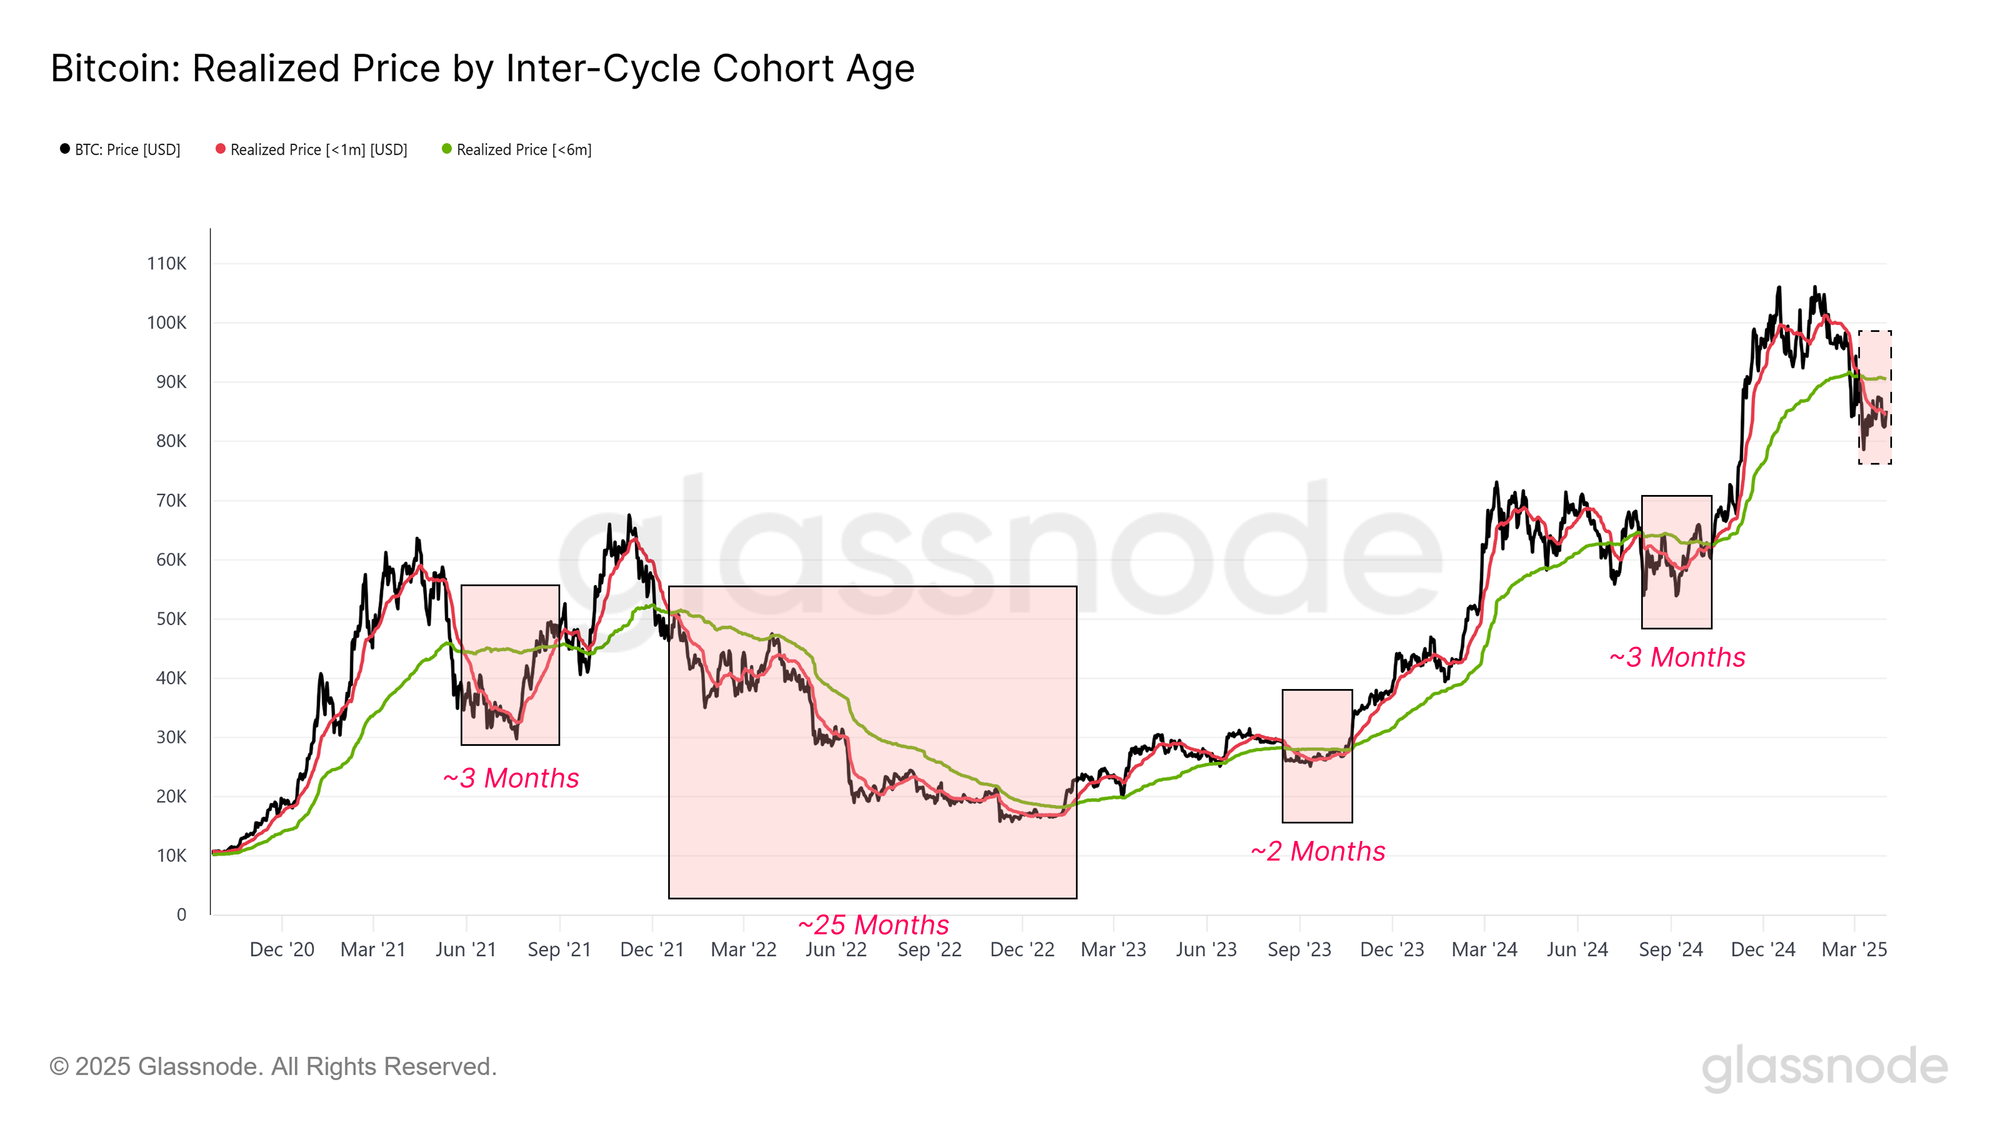
To bring this concept into the on-chain domain, we construct an analogue using on-chain volume-weighted prices for coins moved in the last 1 month, compared to the last 6 months. This method directly reflects market sentiment by factoring in both when and how much capital actually moves on-chain.

The recent crossover of the short-term 1-month average below the long-term 6-month price could be considered to mark an on-chain Death Cross. This pattern has historically preceded 3–6 month-long bearish trends. If this cycle follows suit, it suggests the market may still be working through a period of weakness before the bulls can reestablish a robust uptrend.
Live Chart

Bear Market Depth

Following signs of weakening momentum and shrinking profitability, the current market structure ticks nearly many of the boxes we look at for a typical bear market phase. The current market is characterized by tighter liquidity conditions, negative sentiment and momentum, and investor behaviour increasingly moving toward loss-taking events.

In such environments, investor psychology is dominated by fear and emotional fatigue. Historically, the most extreme bearish phases tend to culminate with a capitulation event, often setting the stage for bottom formation and an eventual recovery.

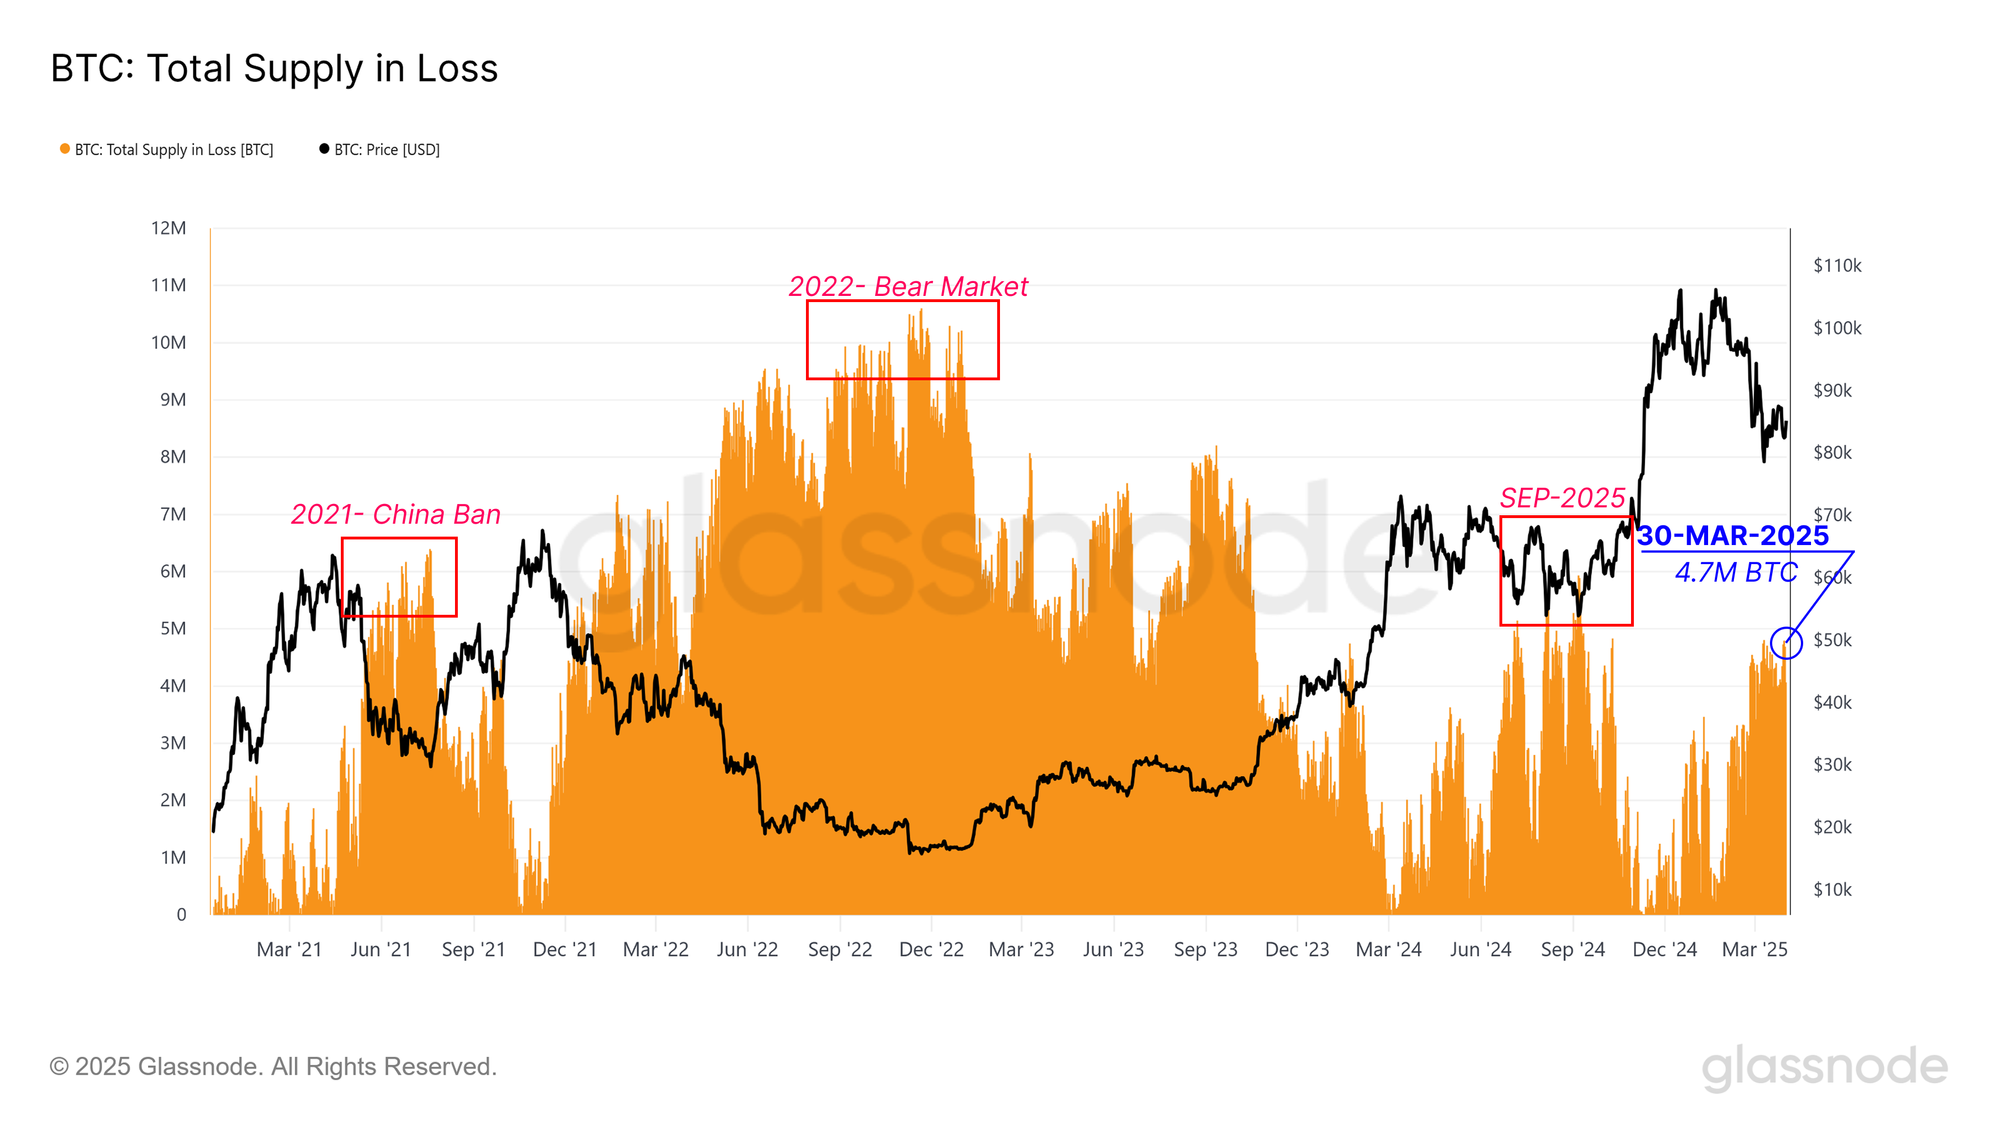
A comprehensive analysis of bearish markets involves two key dimensions: loss dominance and loss intensity. Loss dominance is captured by the Total Supply held in Loss, which tracks the volume of coins held below their on-chain acquisition price. On March 30, 4.7M BTC were held below their cost basis, which is an elevated level, though still below extremes seen in mid-2021, the 2022 bear market, and during the September 2024 drawdown.

Sizing up these losses helps frame where we are in the cycle and whether the market is deep in despair, nearing exhaustion, or may still have more pain to endure.
Live Chart

Measuring Loss Intensity

Building on our view of loss dominance, the second dimension of investor stress is loss intensity, which captures how far below the cost basis investor holdings are. To assess this, we turn to the Market Value to Realized Value (MVRV) ratio, a metric that compares the spot price to the average cost basis of all coins in the supply.

To isolate the experience of underwater investors, we can focus specifically on the MVRV of supply held in loss. We can construct this metric by dividing the total USD-denominated unrealized loss held by the market by the number of coins contributing to it.

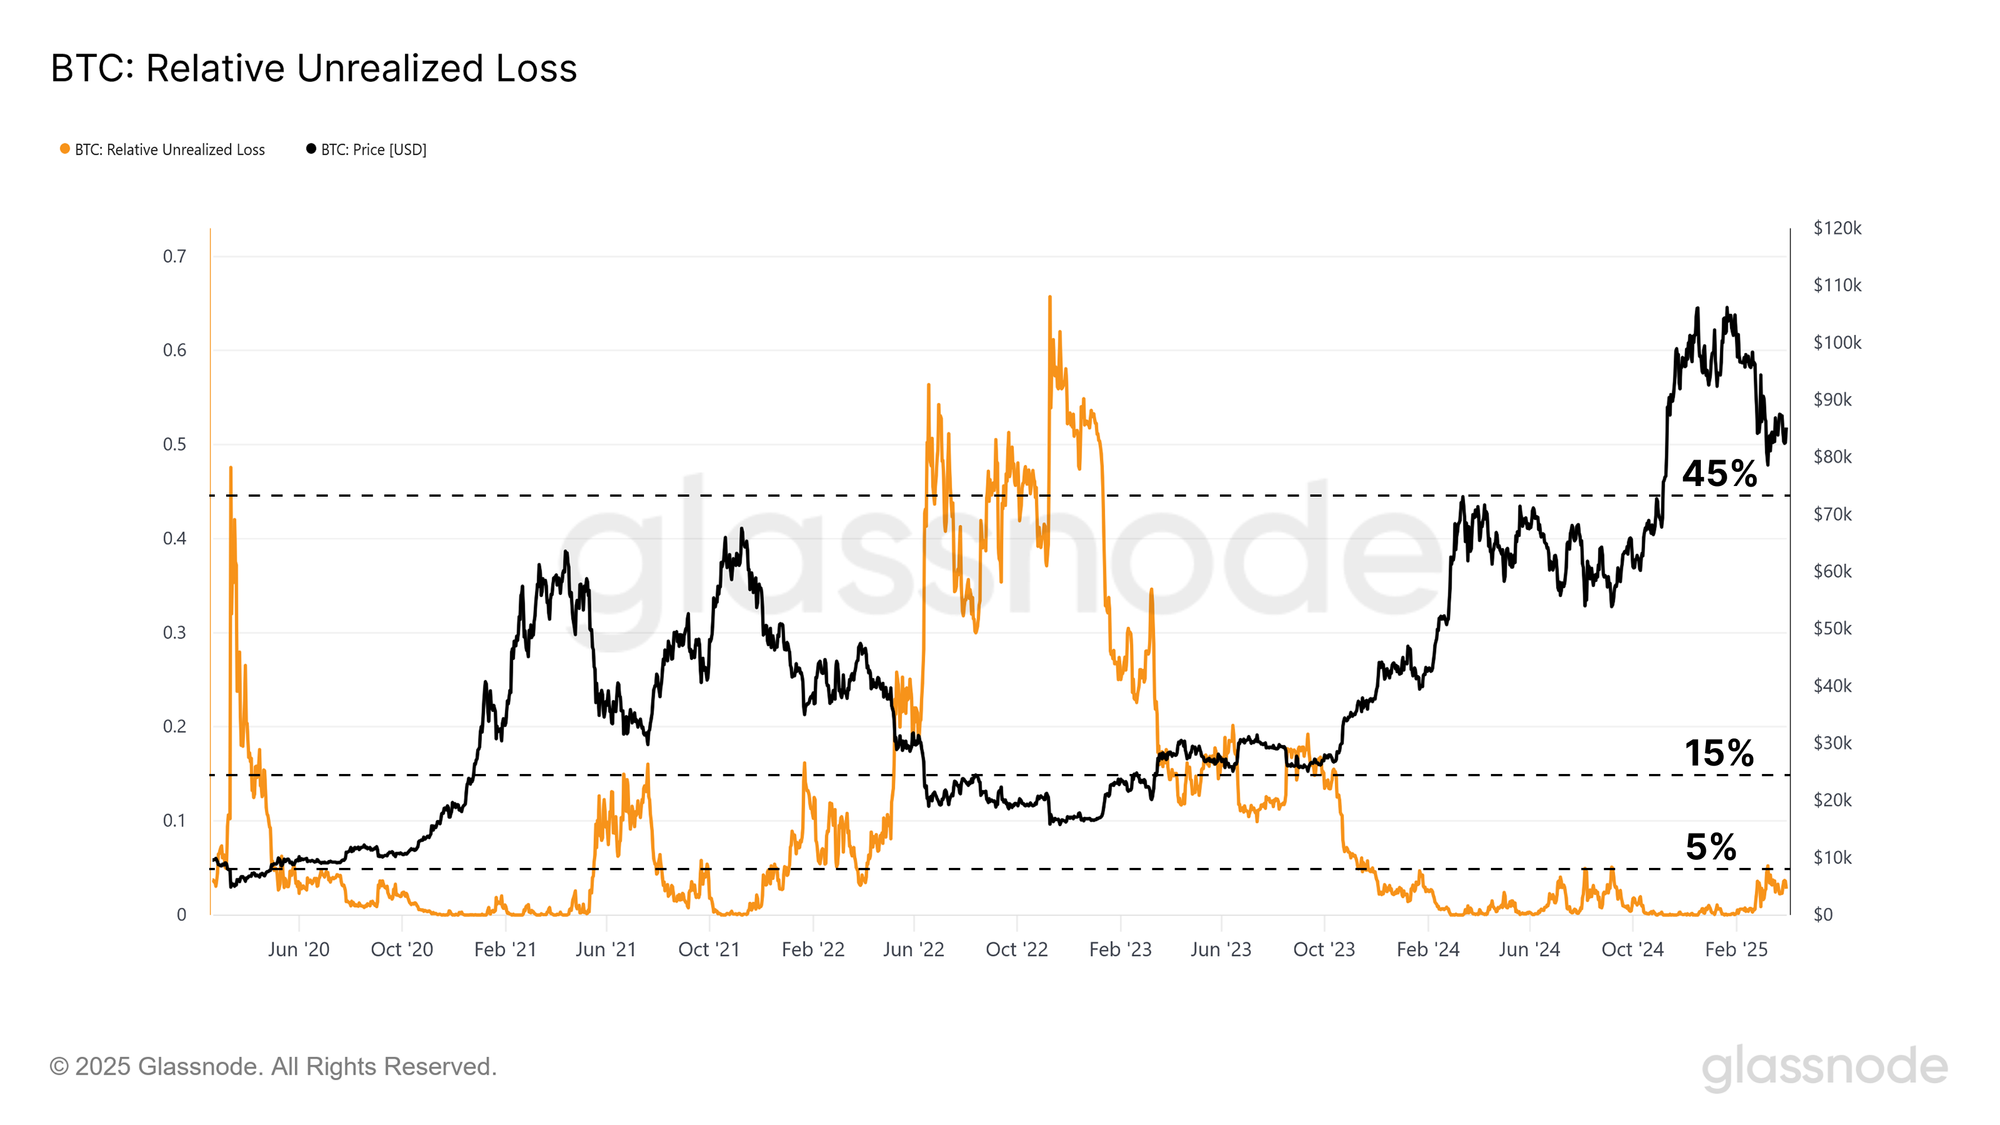
The Relative unrealized loss, which expresses the proportion of the market cap that is underwater, is currently at 2%. This is notably lower in magnitude than what we have seen in previous bear markets, such as in 2022. By this measure, whilst the number of coins held in loss is substantial, the magnitude of the unrealized losses they carry is not.
Live Chart

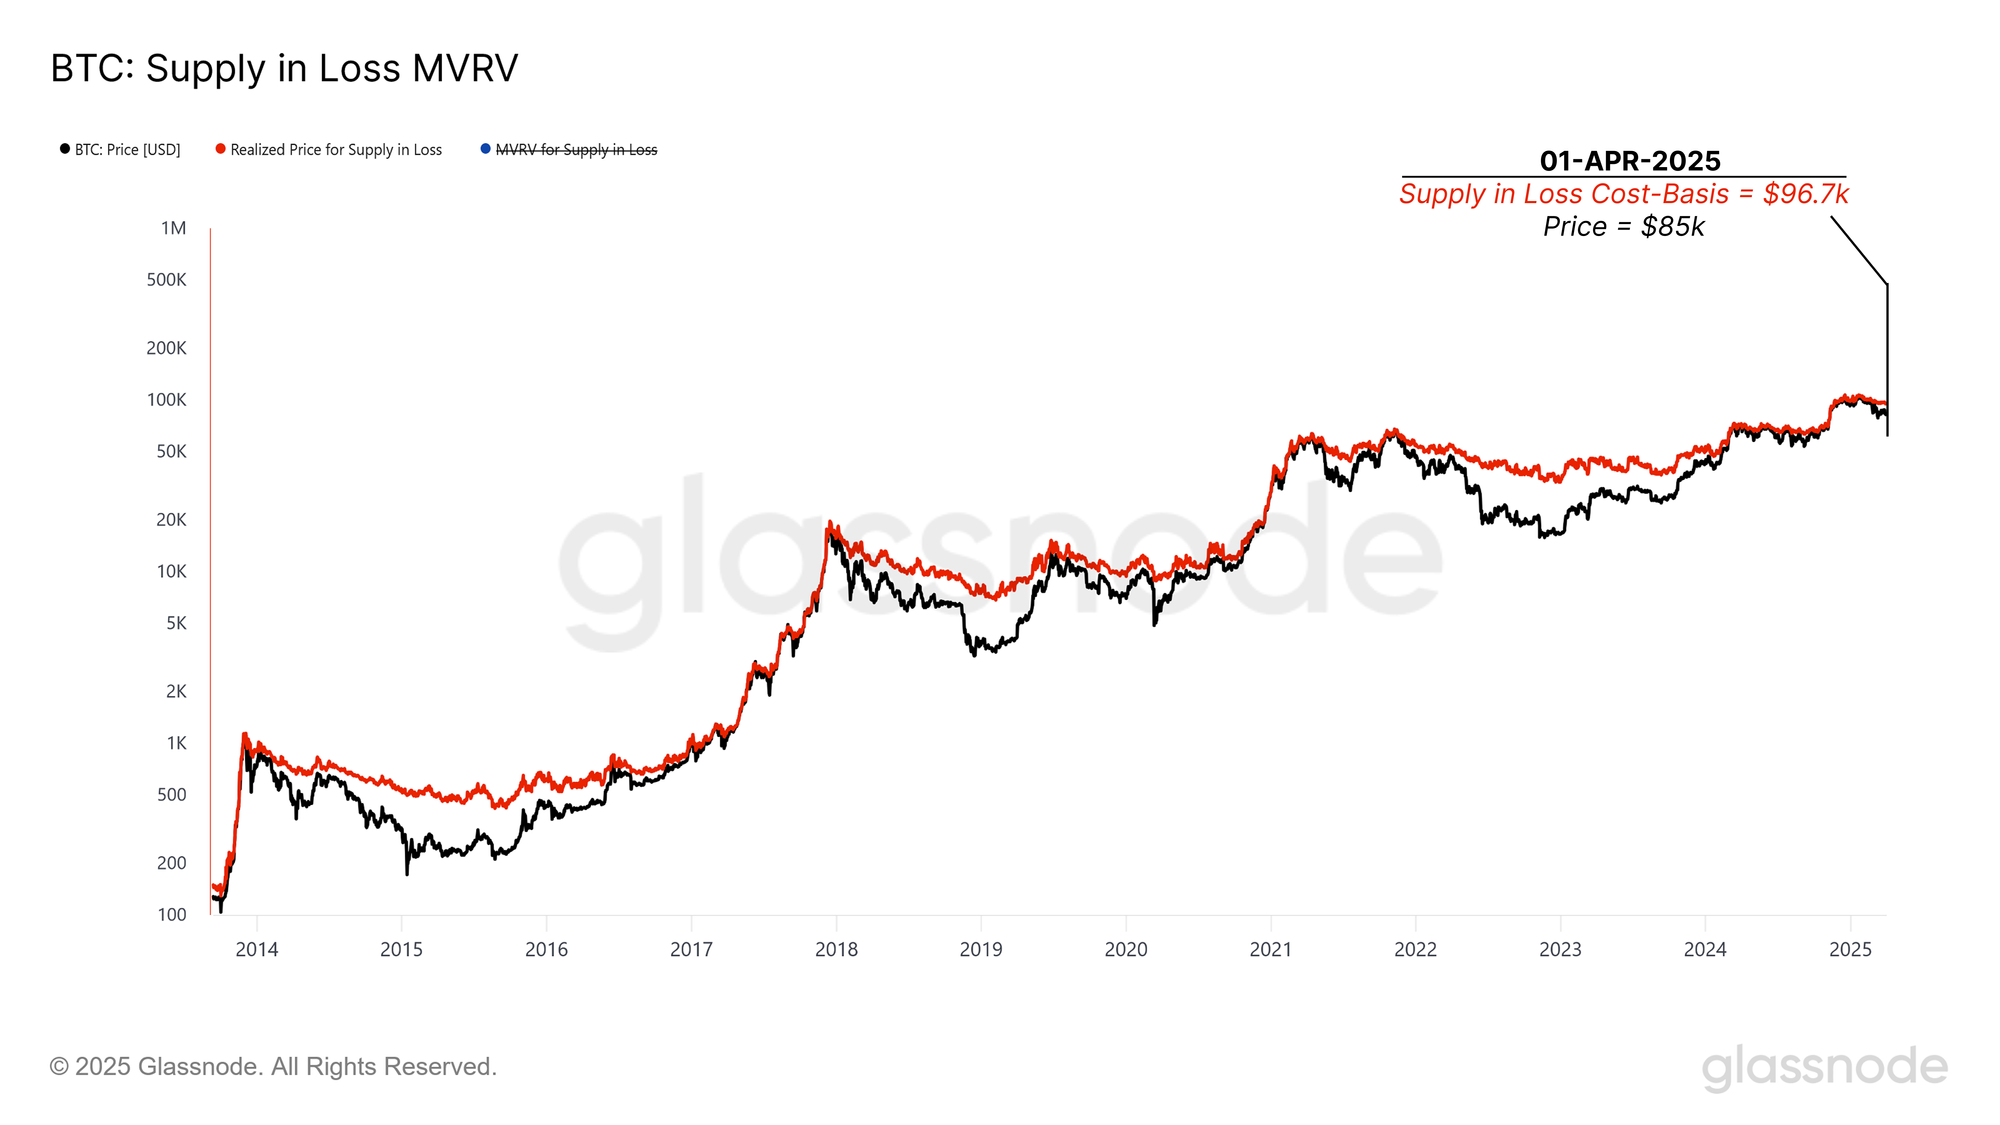
From this, we can compute the average cost basis of coins in loss using the following formula:

The realized price for the supply in loss is at $96.7k, which means, on average, the average underwater coin is holding an unrealized loss of -12%.
Live Chart

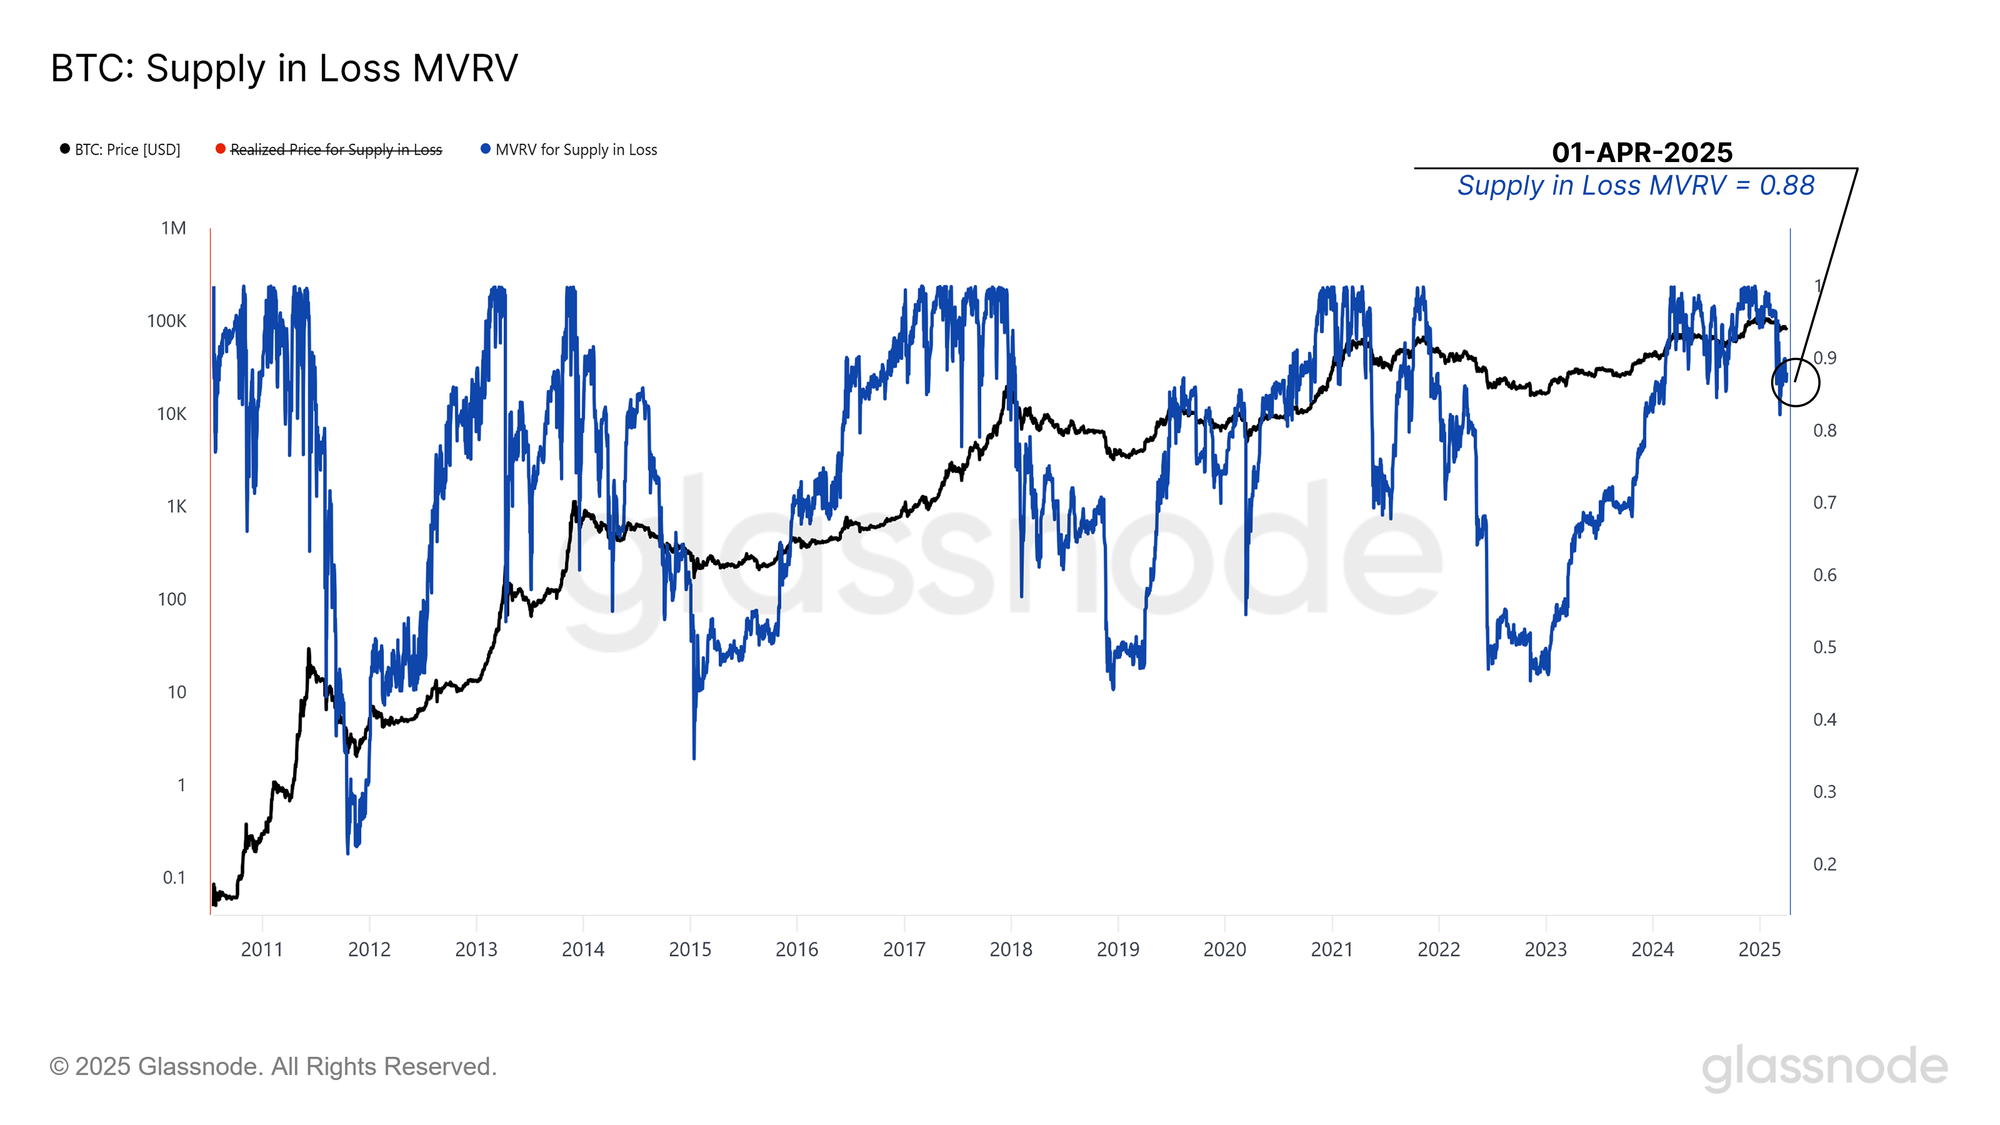
This Supply in-Loss Realized Price then serves as the denominator for constructing an MVRV ratio for these coins, creating an oscillator to compare how far underwater the average loss-holding investors are. We can then use this metric to compare across previous cycles and use this as an input for identifying how deep the investor distress is and whether there are any early signs of recovery.

The Supply in-Loss MVRV dropped sharply when the price broke below $93k and is now trading at 0.88, indicating a moderate degree of loss and stress within the market. This is one of the lowest levels of this MVRV for this cycle, although it is again not at the deeply low levels seen in prior bear markets.

Overall, there are many signs of weakness for Bitcoin investors. However, we should note that the magnitude of this weakness across several dimensions is not yet at the depth and severity of some of the more brutal downtrends Bitcoin has experienced in the past.
Live Chart

Rippling Away

As Bitcoin investors grapple with deepening losses, a contrasting trend emerges in more retail-driven corners of the market. One defining feature of this cycle has been the rise of institutional demand via U.S. spot ETFs, with a lot of retail participation and speculation pulled toward alternative digital assets.

For this cycle in particular, Ripple (XRP) has been a preferred asset for trade amongst retail investors, and studying its behavior can therefore serve as a proxy for measuring retail speculative demand.

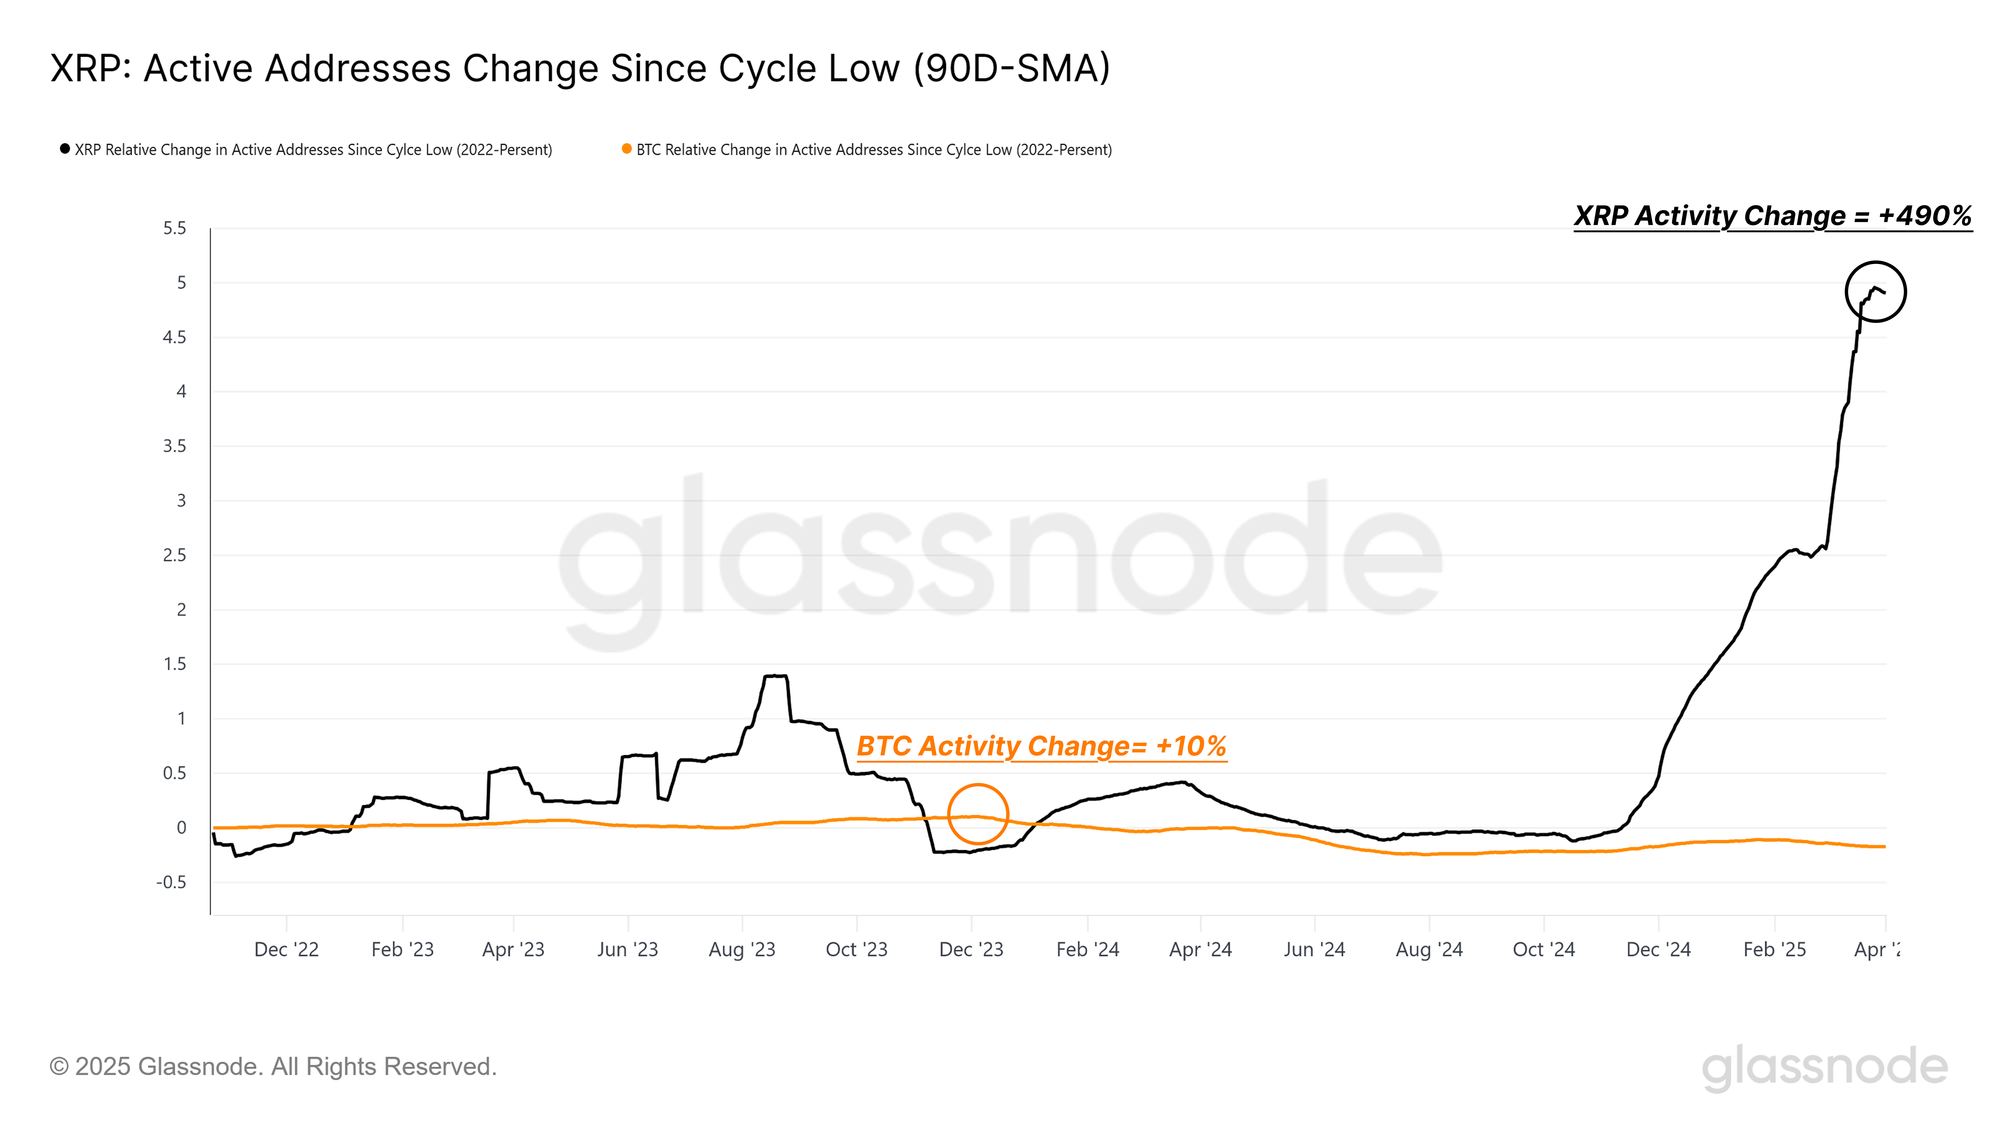
Since the 2022 cycle low, the quarterly average of daily active addresses for XRP has jumped by +490%, compared to just 10% for Bitcoin. This stark contrast suggests that retail enthusiasm has been attracted by XRP, thus providing a mirror for speculative appetite in the crypto space.
Live Chart

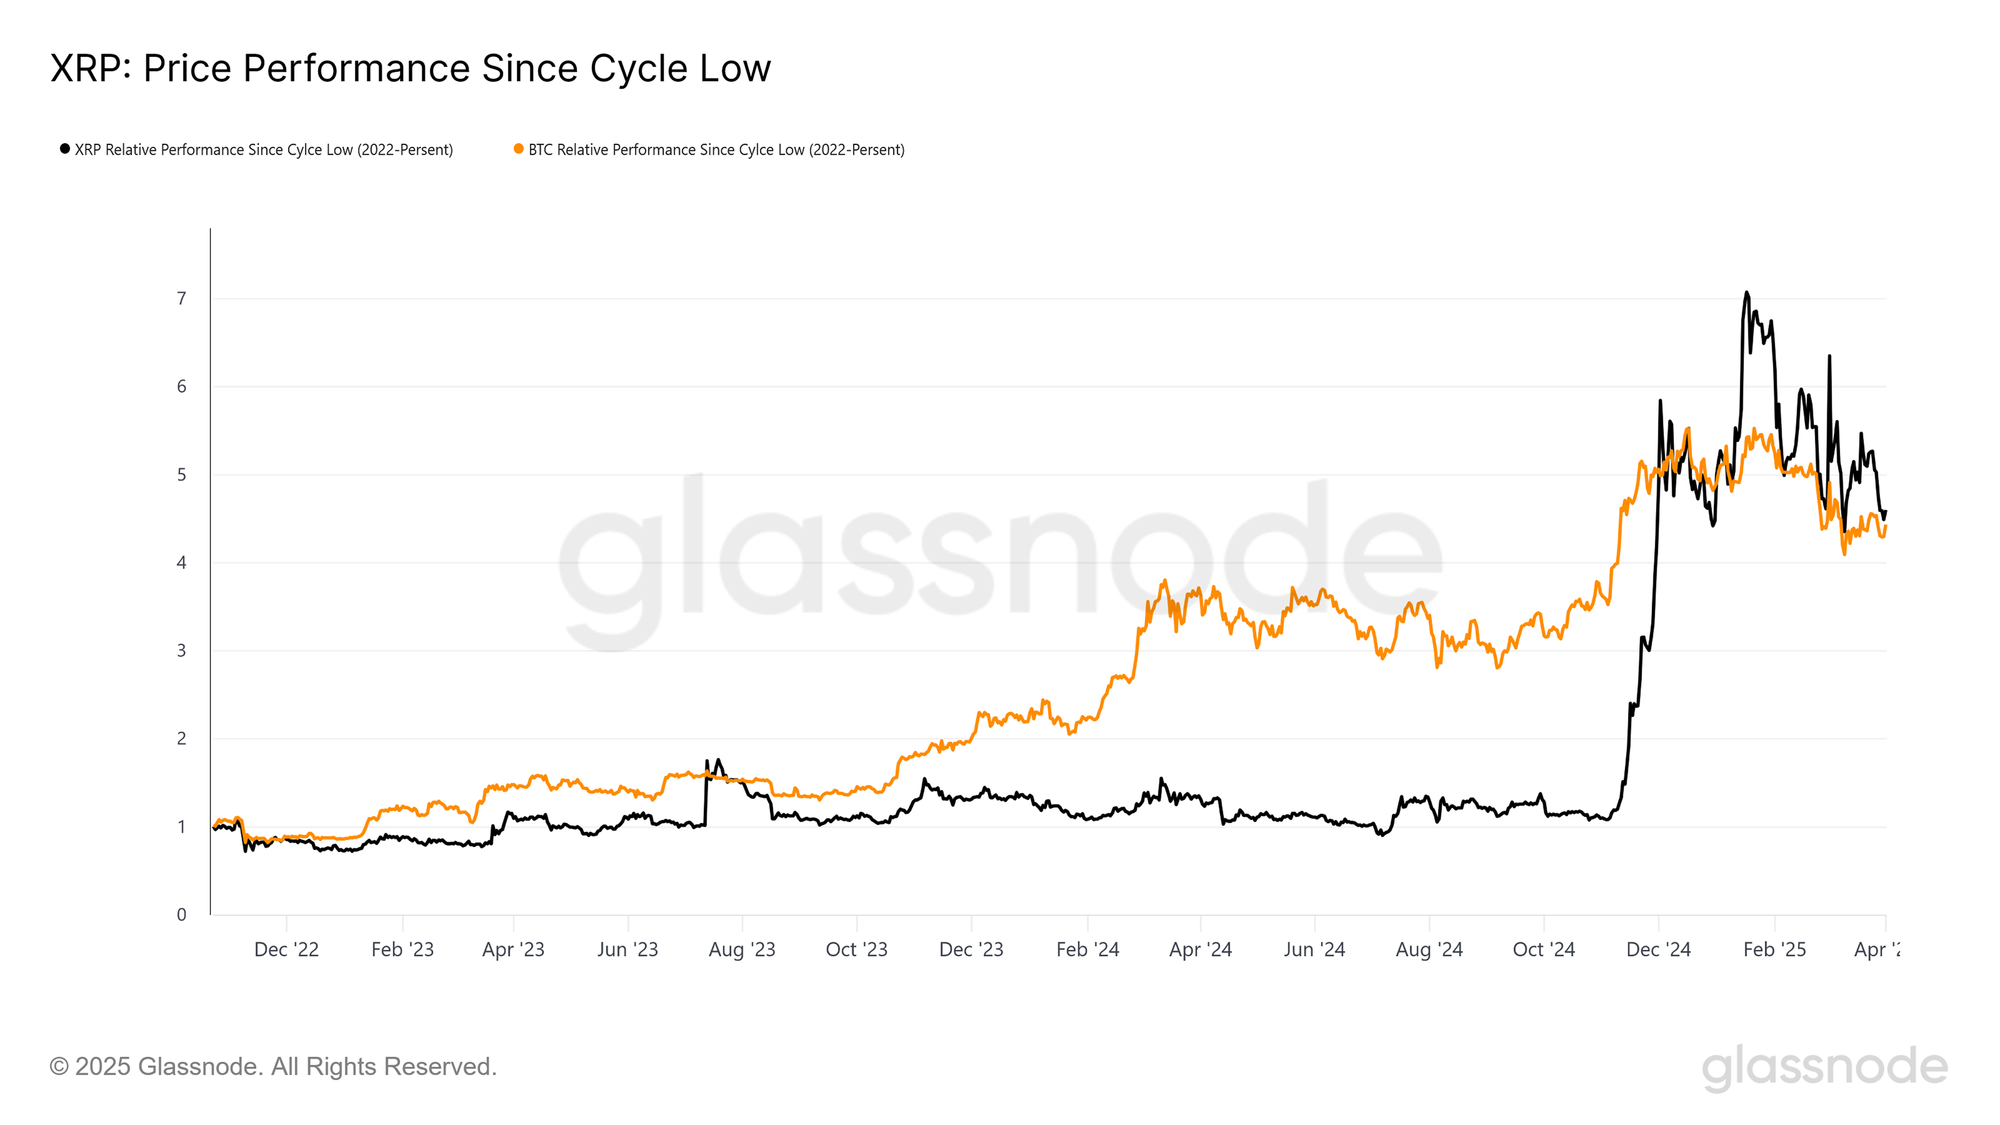
This becomes even clearer when we examine the path each asset has taken since the 2022 cycle low. While both Bitcoin and XRP have delivered a similar performance, both trading, roughly 5x to 6x off the bottom, the journey has been fundamentally different.

Bitcoin’s rally has followed a more organic and progressive trajectory, marked by steady growth and punctuated by sharp uptrends during key catalysts such as the launch of spot ETFs and developments around the U.S. elections.

In contrast, XRP traded largely sideways until December 2024 before experiencing an explosive surge higher, a price pattern more consistent with retail-driven speculation than with structured and sustained inflow of new demand.
Live Chart

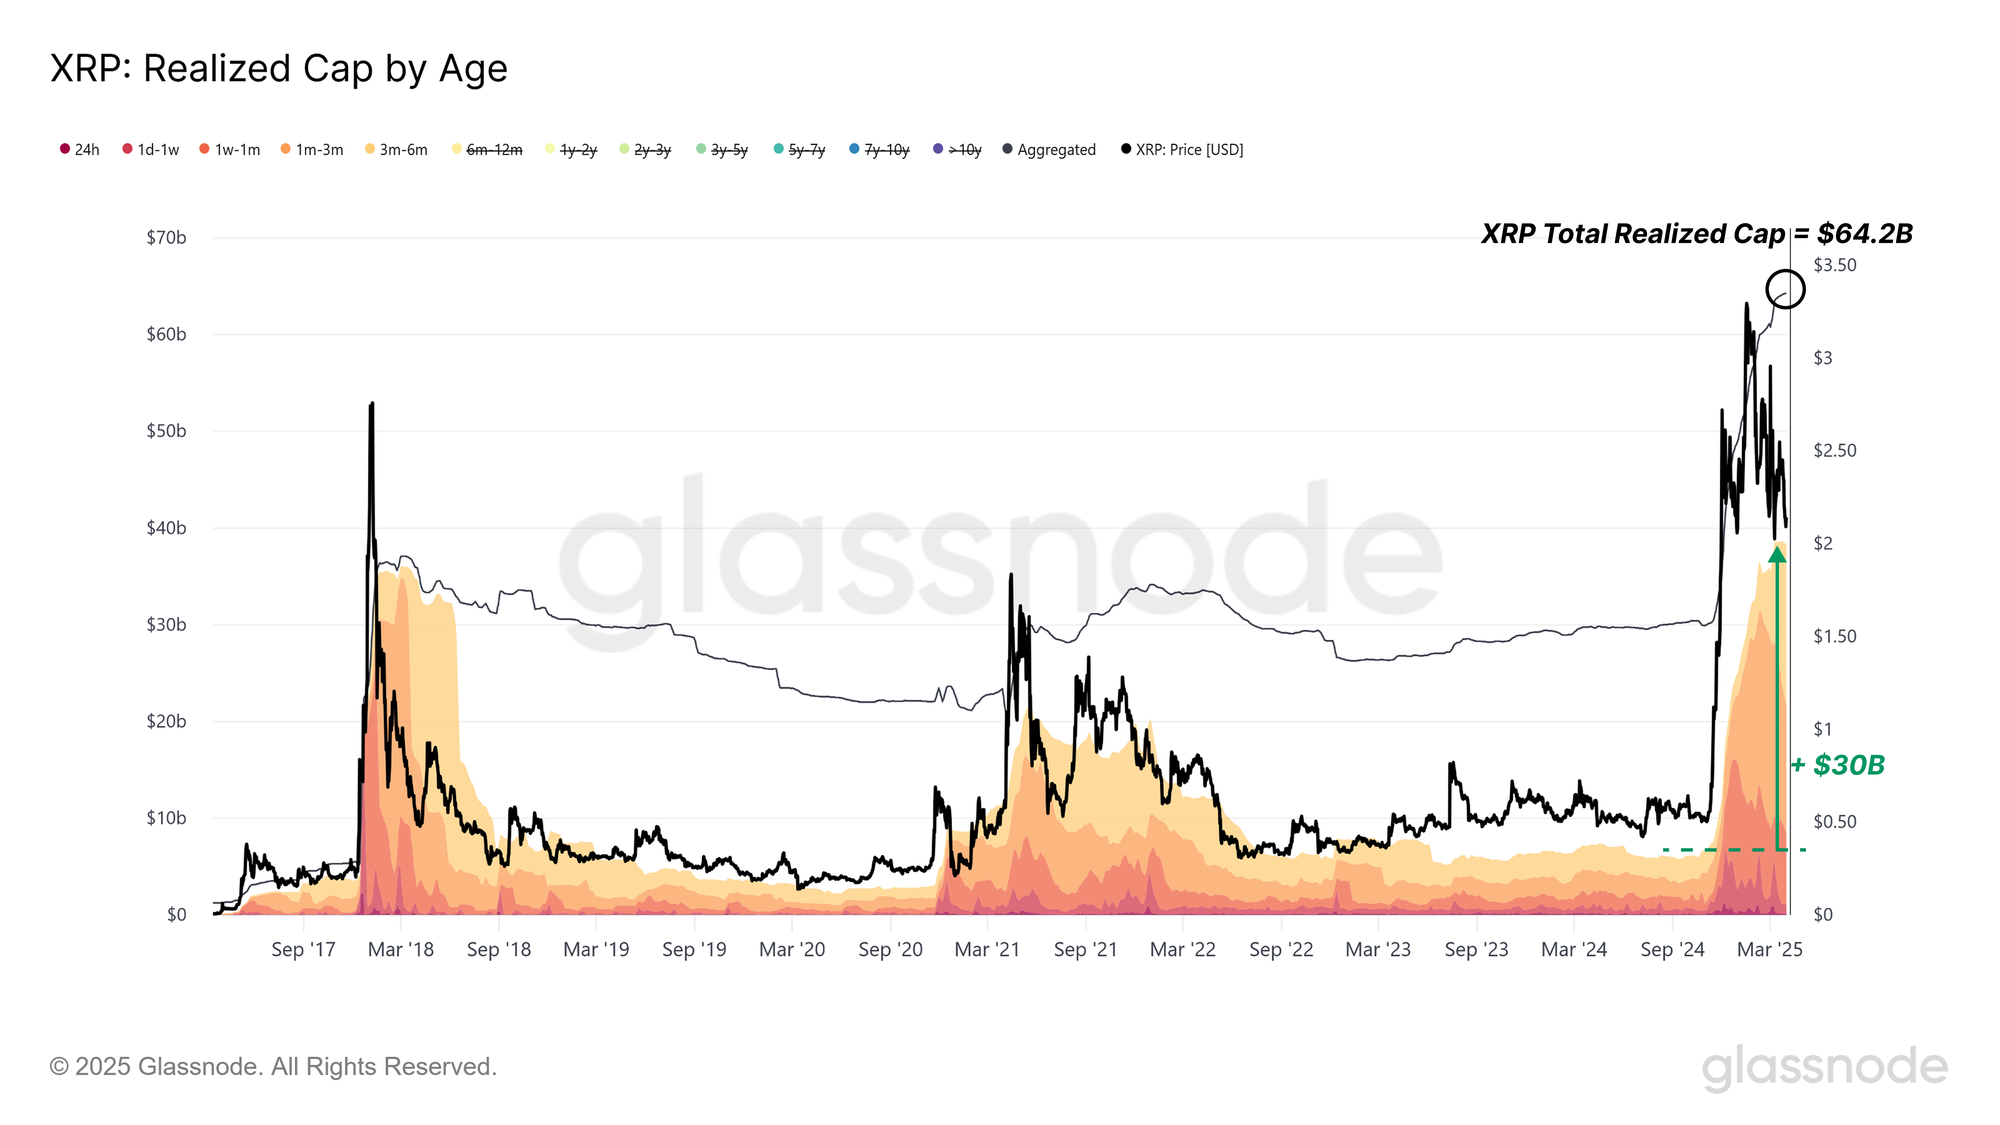
During this recent surge, XRP’s Realized Cap nearly doubled from $30.1B to $64.2B, reflecting a substantial inflow of capital. Notably, close to $30B of this increase came from investors deploying capital within the last six months, highlighting the short concentration of this retail-led rally.

However, this capital influx has started to slow down since late February 2025, signalling a potential cooling-off in speculative appetite.
Live Chart

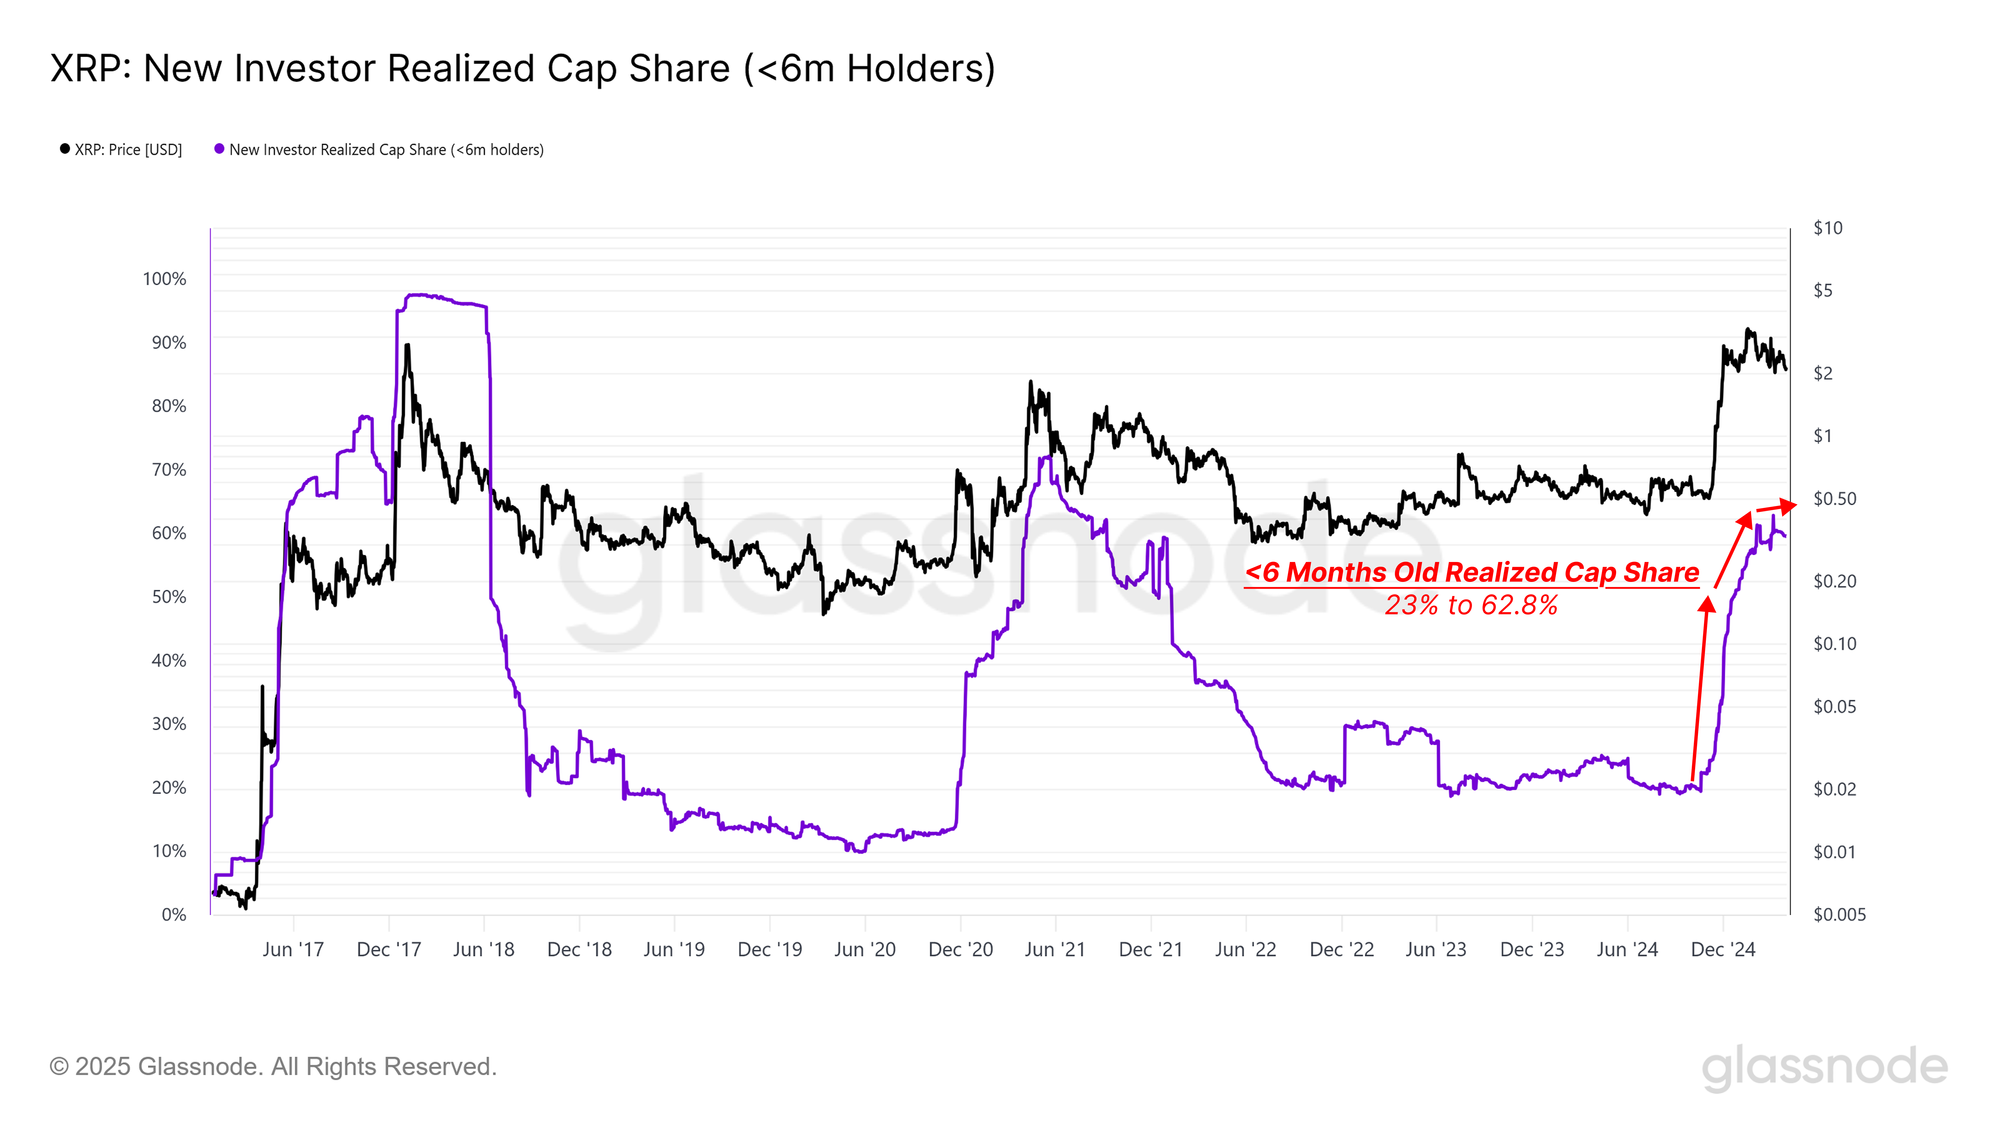
Alongside the short surge in capital flows, there’s been a rapid concentration of wealth in the hands of new investors, with the share of XRP’s realized cap, which is younger than 6 months, rising from 23% to 62.8% in just a short period of time.

When viewed together with the heavy retail participation, this sharp uplift in new holders raises caution signs, where many investors are likely to be vulnerable to downside volatility, given their now elevated cost basis.
Live Chart

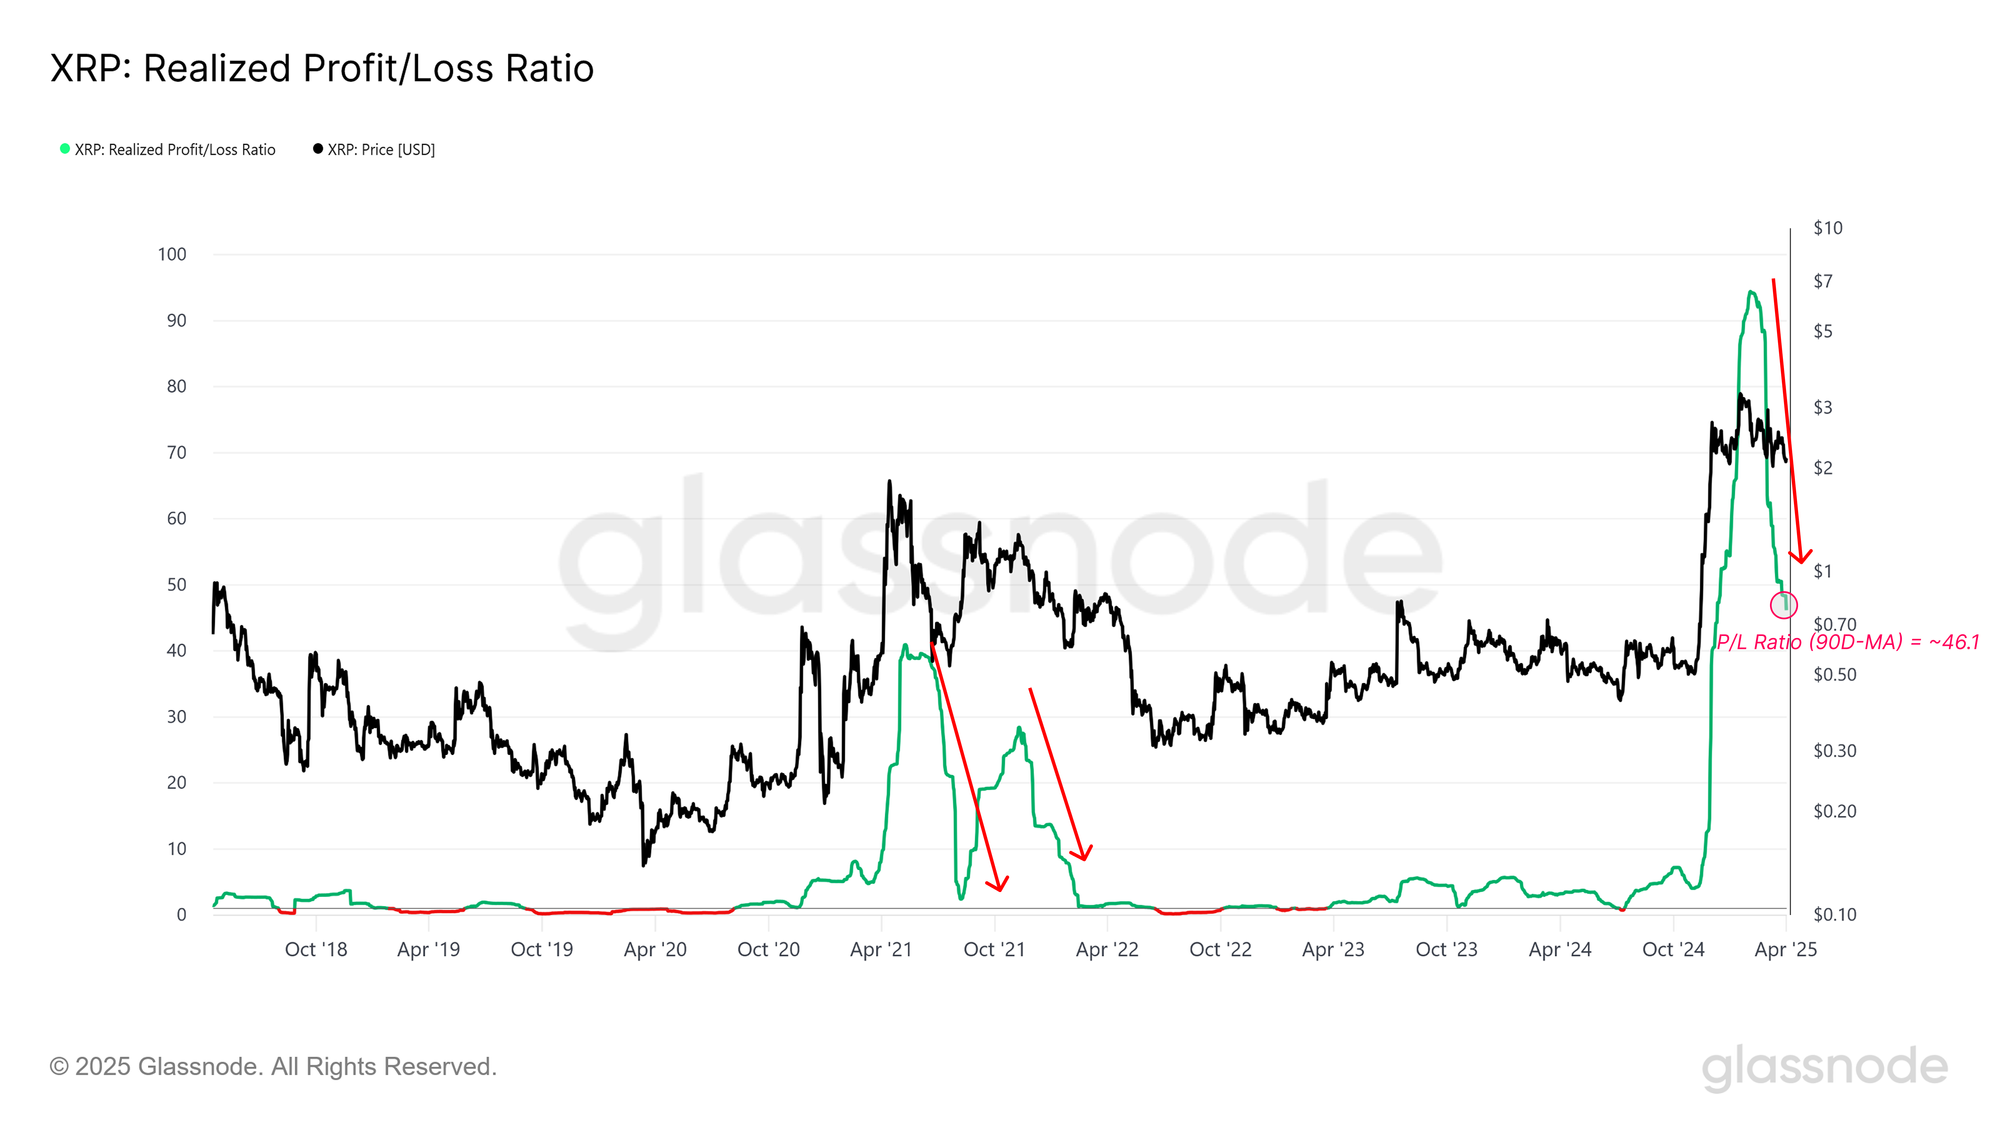
This resembles a top-heavy cost basis structure, which becomes even more concerning when we observe the Realized Loss/Profit Ratio for XRP. This metric has been in steady decline since January 2025, suggesting that investors are realizing fewer profits, and increasingly large losses.

These conditions are a common signal of waning confidence and a general move towards more fragile, higher-risk conditions. Given the retail-dominated inflows, and largely concentrated wealth in relatively new hands, this alludes to a condition where retail investor confidence may be slipping, both in XRP, but may also be extended across the broader market.
Live Chart

Summary and Conclusions

The Bitcoin market continues to digest the correction after the $109k ATH, with signs of increasing losses held, and locked in by investors. Although the price has stabilized above an area of demand around $76k–$80k, several on-chain momentum indicators suggest these may be relief rallies within a broader downtrend rather than the beginning of a sustainable reversal.

Analysis of XRP network trends also offers a proxy view for the magnitude of the risk appetite of retail investors. The asset has seen a dramatic uptick in address activity, capital inflows, and realized cap growth over the last 6-months. However, this enthusiasm appears to have reached a saturation point as profit-taking wanes, and losses have started to accelerate. The XRP market is showing signs of a top-heavy structure, with many investors caught on a relatively high-cost basis.

Altogether, this data reinforces a case where Bitcoin's correction is meaningful in scale but has not yet reached the severity of previous bear markets. For more speculative assets like XRP, demand may have already peaked, suggesting caution may be warranted until signs of a robust recovery start to emerge.


Disclaimer: This report does not provide any investment advice. All data is provided for information and educational purposes only. No investment decision shall be based on the information provided here and you are solely responsible for your own investment decisions.

Exchange balances presented are derived from Glassnode’s comprehensive database of address labels, which are amassed through both officially published exchange information and proprietary clustering algorithms. While we strive to ensure the utmost accuracy in representing exchange balances, it is important to note that these figures might not always encapsulate the entirety of an exchange’s reserves, particularly when exchanges refrain from disclosing their official addresses. We urge users to exercise caution and discretion when utilizing these metrics. Glassnode shall not be held responsible for any discrepancies or potential inaccuracies. Please read our Transparency Notice when using exchange data.


Leituras Relacionadas

Retail Investors' 'Lead Brother' Serenity vs. Newly Minted Stock God Leopold: How Are the Two Top Hunters Mining AI's 'Physical Limits'?

The article profiles two prominent figures, Serenity and Leopold Aschenbrenner, who are gaining attention for their unconventional investment strategies focused on the physical constraints of the AI boom, moving beyond mainstream software narratives. Serenity, an anonymous online trader, advocates a "shiso leaf" theory. He targets small-cap companies with monopolies on critical, overlooked components in the AI hardware supply chain, such as specific semiconductor materials. His deep, technical analysis of bottlenecks in areas like co-packaged optics (CPO) has reportedly yielded massive returns, though his anonymity and focus on illiquid micro-cap stocks pose significant risks for followers. Leopold Aschenbrenner, a former OpenAI researcher, founded a multi-billion dollar hedge fund. His macro thesis argues that physical infrastructure—power grids, land, data centers—is the true bottleneck for AI growth, lagging far behind chip production. Consequently, his fund employs an infrastructure arbitrage strategy: heavily investing in storage and compute infrastructure companies while placing massive bearish bets (put options) against major semiconductor stocks, betting their valuations will correct as physical constraints become apparent. While their methods differ—Serenity drills into microscopic supply chain details, while Leopold takes a macroscopic, infrastructure-focused view—both share a core belief: the real power and investment alpha in the AI era lie in controlling scarce physical resources, not just software. The article concludes by noting the inherent risks in both approaches, such as liquidity issues for micro-caps and timing risks for macro bets, but suggests they signal a broader market re-evaluation of AI's foundational assets.

marsbitHá 1h

Retail Investors' 'Lead Brother' Serenity vs. Newly Minted Stock God Leopold: How Are the Two Top Hunters Mining AI's 'Physical Limits'?

marsbitHá 1h

Who Will Make Money in the Age of Agents?

In the Agents era of blockchain, traditional value capture theories face challenges. The "Fat Protocol" theory, dominant since 2016, suggested protocols capture most value as their tokens are essential for network use. However, the proliferation of interchangeable L1s, L2s, and modular layers has eroded protocol scarcity and pricing power. Conversely, the "Fat App" theory posits that applications capturing user relationships (like wallets and exchanges) become the primary value layer by controlling distribution and transaction flows. This aligns with the current "Great Repricing" cycle. Agents disrupt this logic. As software users, they lack brand loyalty, prioritize cost and efficiency, and switch between platforms seamlessly. This undermines the front-end UX moats that "Fat Apps" rely on. The article explores several potential futures: 1. **Headless Applications:** Current leading apps could strip their front-ends and become backend API infrastructure for Agents, preserving their role. 2. **Protocol Resurgence:** If integration becomes trivial, Agents might bypass aggregators and interact directly with protocols, reviving "Fat Protocol" dynamics. 3. **Pricing Power Collapse:** Agents' rational, frictionless routing could commoditize the entire stack, compressing margins toward cost and leaving little profit for intermediaries. 4. **Unprecedented Activity:** Agents may enable new, high-frequency, machine-to-machine economic activities, expanding the total value pie even if margins are thin. 5. **A New, Unnamed Model:** Historically, major tech shifts (like the internet's attention economy) create unforeseen business models. The Agents era may spawn entirely new ways to capture value. The most likely outcome is a coexistence where "Fat Apps" continue to serve human users valuing UX, while a separate, Agent-driven economy emerges governed by different rules—where loyalty is based on factors like liquidity, latency, and settlement guarantees rather than brand.

marsbitHá 2h

Who Will Make Money in the Age of Agents?

marsbitHá 2h

Trading

Spot
Futuros

Artigos em Destaque

O que é BITCOIN

Compreender o HarryPotterObamaSonic10Inu (ERC-20) e a Sua Posição no Espaço Cripto Nos últimos anos, o mercado de criptomoedas assistiu a um aumento na popularidade das moedas meme, cativando não apenas os traders, mas também aqueles que procuram envolvimento comunitário e valor de entretenimento. Entre estes tokens únicos está o HarryPotterObamaSonic10Inu (ERC-20), um projeto intrigante que mistura referências culturais no tecido das criptomoedas. Este artigo explora os principais aspetos do HarryPotterObamaSonic10Inu, examinando os seus mecanismos, a sua ética orientada pela comunidade e o seu envolvimento com o vasto panorama cripto. O que é o HarryPotterObamaSonic10Inu (ERC-20)? Como o nome sugere, o HarryPotterObamaSonic10Inu é uma moeda meme construída na blockchain Ethereum, classificada sob o padrão ERC-20. Ao contrário das criptomoedas tradicionais, que podem enfatizar a utilidade prática ou o potencial de investimento, este token prospera no valor de entretenimento e na força da sua comunidade. O projeto visa promover um ambiente onde utilizadores envolvidos possam reunir-se, partilhar ideias e participar em atividades inspiradas por diversos fenómenos culturais. Uma característica notável do HarryPotterObamaSonic10Inu é a zero taxa sobre transações. Este elemento atraente visa encorajar a negociação e o envolvimento da comunidade, isento de encargos adicionais que podem desencorajar os traders de pequena escala. A oferta total da moeda está fixada em mil milhões de tokens, uma cifra que marca a sua intenção de manter uma circulação substancial dentro da comunidade. Criador do HarryPotterObamaSonic10Inu (ERC-20) As origens do HarryPotterObamaSonic10Inu estão um pouco envoltas em mistério; os detalhes sobre o criador permanecem desconhecidos. O desenvolvimento deste token carece de uma equipa identificável ou de um plano explícito, o que não é raro no setor das moedas meme. Em vez disso, o projeto surgiu de forma orgânica, com o seu progresso a depender fortemente do entusiasmo e da participação da sua comunidade. Investidores do HarryPotterObamaSonic10Inu (ERC-20) No que diz respeito a investimentos externos e apoios, o HarryPotterObamaSonic10Inu também permanece ambíguo. O token não lista quaisquer fundações de investimento conhecidas ou apoio organizacional significativo. Em vez disso, o “sangue vital” do projeto é a sua comunidade de base, que informa o seu crescimento e sustentabilidade através da ação coletiva e do envolvimento no espaço cripto. Como Funciona o HarryPotterObamaSonic10Inu (ERC-20)? Como uma moeda meme, o HarryPotterObamaSonic10Inu opera principalmente fora dos quadros tradicionais que muitas vezes governam o valor dos ativos. Existem vários aspetos distintivos que definem como o projeto funciona: Transações Sem Taxas: Sem taxas sobre transações, os utilizadores podem comprar e vender o token livremente, sem a preocupação de custos ocultos. Envolvimento da Comunidade: O projeto prospera na interação da comunidade, aproveitando plataformas de redes sociais para criar entusiasmo e facilitar a participação. Discussões, partilha de conteúdo e envolvimento são elementos cruciais que ajudam a expandir o seu alcance e a fomentar a lealdade entre os apoiantes. Sem Utilidade Prática: Deve ser notado que o HarryPotterObamaSonic10Inu não oferece utilidade concreta dentro do ecossistema financeiro. Em vez disso, é classificado como um token principalmente para entretenimento e atividades comunitárias. Referência Cultural: O token incorpora de forma inteligente elementos da cultura popular para atrair interesse, conectando-se tanto com entusiastas de memes como com seguidores de criptomoedas. HarryPotterObamaSonic10Inu exemplifica como as moedas meme operam de forma diferente de projetos de criptomoedas mais tradicionais, entrando no mercado como construções sociais inovadoras em vez de ativos utilitários. Linha do Tempo do HarryPotterObamaSonic10Inu (ERC-20) A história do HarryPotterObamaSonic10Inu é marcada por vários marcos notáveis: Criação: O token surgiu de um meme viral, capturando a imaginação de muitos entusiastas de criptomoedas. Datas específicas de criação não estão disponíveis, sublinhando a sua ascensão orgânica. Listagem em Exchanges: O HarryPotterObamaSonic10Inu conseguiu entrar em várias exchanges, permitindo um acesso e negociação mais fáceis pela comunidade. Iniciativas de Envolvimento da Comunidade: Atividades contínuas direcionadas a melhorar a interação comunitária, incluindo concursos, campanhas em redes sociais e geração de conteúdo por fãs e defensores. Planos de Expansão Futura: O roteiro do projeto inclui o lançamento de uma coleção de NFTs, mercadorias e um site de eCommerce relacionado aos seus temas culturais, envolvendo ainda mais a comunidade e tentando adicionar mais dimensões ao seu ecossistema. Pontos-Chave sobre o HarryPotterObamaSonic10Inu (ERC-20) Natureza Orientada pela Comunidade: O projeto prioriza a contribuição coletiva e a criatividade, assegurando que o envolvimento dos utilizadores está na vanguarda do seu desenvolvimento. Classificação como Moeda Meme: Representa o epítome da criptomoeda baseada em entretenimento, destacando-se dos veículos de investimento tradicionais. Sem Afiliação Direta com o Bitcoin: Apesar da semelhança no nome do ticker, o HarryPotterObamaSonic10Inu é distinto e não tem qualquer relação com o Bitcoin ou outras criptomoedas estabelecidas. Foco na Colaboração: O HarryPotterObamaSonic10Inu é projetado para criar um espaço de colaboração e partilha de histórias entre os seus detentores, proporcionando uma via para a criatividade e o fortalecimento da comunidade. Perspectivas Futuras: A ambição de expandir além da sua premissa inicial para NFTs e mercadorias delineia um caminho para o projeto potencialmente entrar em avenidas mais mainstream dentro da cultura digital. À medida que as moedas meme continuam a capturar a imaginação da comunidade cripto, HarryPotterObamaSonic10Inu (ERC-20) destaca-se devido aos seus laços culturais e abordagem centrada na comunidade. Embora possa não se encaixar no molde típico de um token orientado para utilidade, a sua essência reside na alegria e camaradagem fomentadas entre os seus apoiantes, destacando a natureza em evolução das criptomoedas em uma era cada vez mais digital. À medida que o projeto continua a desenvolver-se, será importante observar como as dinâmicas comunitárias influenciam a sua trajetória no panorama em constante mudança da tecnologia blockchain.

1.5k Visualizações TotaisPublicado em {updateTime}Atualizado em 2024.12.03

O que é BITCOIN

Como comprar BTC

Bem-vindo à HTX.com!Tornámos a compra de Bitcoin (BTC) simples e conveniente.Segue o nosso guia passo a passo para iniciar a tua jornada no mundo das criptos.Passo 1: cria a tua conta HTXUtiliza o teu e-mail ou número de telefone para te inscreveres numa conta gratuita na HTX.Desfruta de um processo de inscrição sem complicações e desbloqueia todas as funcionalidades.Obter a minha contaPasso 2: vai para Comprar Cripto e escolhe o teu método de pagamentoCartão de crédito/débito: usa o teu visa ou mastercard para comprar Bitcoin (BTC) instantaneamente.Saldo: usa os fundos da tua conta HTX para transacionar sem problemas.Terceiros: adicionamos métodos de pagamento populares, como Google Pay e Apple Pay, para aumentar a conveniência.P2P: transaciona diretamente com outros utilizadores na HTX.Mercado de balcão (OTC): oferecemos serviços personalizados e taxas de câmbio competitivas para os traders.Passo 3: armazena teu Bitcoin (BTC)Depois de comprar o teu Bitcoin (BTC), armazena-o na tua conta HTX.Alternativamente, podes enviá-lo para outro lugar através de transferência blockchain ou usá-lo para transacionar outras criptomoedas.Passo 4: transaciona Bitcoin (BTC)Transaciona facilmente Bitcoin (BTC) no mercado à vista da HTX.Acede simplesmente à tua conta, seleciona o teu par de trading, executa as tuas transações e monitoriza em tempo real.Oferecemos uma experiência de fácil utilização tanto para principiantes como para traders experientes.

4.0k Visualizações TotaisPublicado em {updateTime}Atualizado em 2025.03.21

Como comprar BTC

O que é $BITCOIN

OURO DIGITAL ($BITCOIN): Uma Análise Abrangente Introdução ao OURO DIGITAL ($BITCOIN) OURO DIGITAL ($BITCOIN) é um projeto baseado em blockchain que opera na rede Solana, com o objetivo de combinar as características dos metais preciosos tradicionais com a inovação das tecnologias descentralizadas. Embora partilhe um nome com o Bitcoin, frequentemente referido como “ouro digital” devido à sua percepção como uma reserva de valor, o OURO DIGITAL é um token separado projetado para criar um ecossistema único dentro da paisagem Web3. O seu objetivo é posicionar-se como um ativo digital alternativo viável, embora os detalhes sobre as suas aplicações e funcionalidades ainda estejam em desenvolvimento. O que é o OURO DIGITAL ($BITCOIN)? OURO DIGITAL ($BITCOIN) é um token de criptomoeda explicitamente projetado para uso na blockchain Solana. Em contraste com o Bitcoin, que fornece um papel amplamente reconhecido como armazenamento de valor, este token parece focar em aplicações e características mais amplas. Aspectos notáveis incluem: Infraestrutura Blockchain: O token é construído na blockchain Solana, conhecida pela sua capacidade de lidar com transações de alta velocidade e baixo custo. Dinâmicas de Oferta: O OURO DIGITAL tem um fornecimento máximo limitado a 100 quatrilhões de tokens (100P $BITCOIN), embora os detalhes sobre o seu fornecimento circulante ainda não tenham sido divulgados. Utilidade: Embora as funcionalidades precisas não estejam explicitamente delineadas, existem indicações de que o token poderia ser utilizado para várias aplicações, potencialmente envolvendo aplicações descentralizadas (dApps) ou estratégias de tokenização de ativos. Quem é o Criador do OURO DIGITAL ($BITCOIN)? Neste momento, a identidade dos criadores e da equipa de desenvolvimento por trás do OURO DIGITAL ($BITCOIN) permanece desconhecida. Esta situação é típica entre muitos projetos inovadores no espaço da blockchain, particularmente aqueles alinhados com finanças descentralizadas e fenómenos de moedas meme. Embora tal anonimato possa fomentar uma cultura orientada pela comunidade, intensifica as preocupações sobre governança e responsabilidade. Quem são os Investidores do OURO DIGITAL ($BITCOIN)? As informações disponíveis indicam que o OURO DIGITAL ($BITCOIN) não tem apoiantes institucionais conhecidos ou investimentos proeminentes de capital de risco. O projeto parece operar num modelo peer-to-peer focado no apoio e adoção da comunidade, em vez de rotas de financiamento tradicionais. A sua atividade e liquidez estão principalmente situadas em exchanges descentralizadas (DEXs), como a PumpSwap, em vez de plataformas de negociação centralizadas estabelecidas, destacando ainda mais a sua abordagem de base. Como Funciona o OURO DIGITAL ($BITCOIN) A mecânica operacional do OURO DIGITAL ($BITCOIN) pode ser elaborada com base no seu design de blockchain e nas características da rede: Mecanismo de Consenso: Ao aproveitar o exclusivo proof-of-history (PoH) da Solana combinado com um modelo de proof-of-stake (PoS), o projeto assegura uma validação eficiente das transações, contribuindo para o alto desempenho da rede. Tokenomics: Embora mecanismos deflacionários específicos não tenham sido extensivamente detalhados, o vasto fornecimento máximo de tokens implica que pode atender a microtransações ou casos de uso de nicho que ainda estão por definir. Interoperabilidade: Existe o potencial para integração com o ecossistema mais amplo da Solana, incluindo várias plataformas de finanças descentralizadas (DeFi). No entanto, os detalhes sobre integrações específicas permanecem não especificados. Cronologia de Eventos Chave Aqui está uma cronologia que destaca marcos significativos relacionados ao OURO DIGITAL ($BITCOIN): 2023: O lançamento inicial do token ocorre na blockchain Solana, marcado pelo seu endereço de contrato. 2024: O OURO DIGITAL ganha visibilidade ao tornar-se disponível para negociação em exchanges descentralizadas como a PumpSwap, permitindo que os utilizadores o negociem contra SOL. 2025: O projeto testemunha atividade de negociação esporádica e potencial interesse em envolvimentos liderados pela comunidade, embora não tenham sido documentadas parcerias ou avanços técnicos notáveis até ao momento. Análise Crítica Forças Escalabilidade: A infraestrutura subjacente da Solana suporta altos volumes de transações, o que pode aumentar a utilidade do $BITCOIN em vários cenários de transação. Acessibilidade: O potencial preço de negociação baixo por token pode atrair investidores de retalho, facilitando uma participação mais ampla devido a oportunidades de propriedade fracionada. Riscos Falta de Transparência: A ausência de apoiantes, desenvolvedores ou um processo de auditoria publicamente conhecidos pode gerar ceticismo em relação à sustentabilidade e confiabilidade do projeto. Volatilidade do Mercado: A atividade de negociação depende fortemente do comportamento especulativo, o que pode resultar em volatilidade significativa dos preços e incerteza para os investidores. Conclusão O OURO DIGITAL ($BITCOIN) surge como um projeto intrigante, mas ambíguo, dentro do ecossistema em rápida evolução da Solana. Embora tente aproveitar a narrativa do “ouro digital”, a sua divergência do papel estabelecido do Bitcoin como reserva de valor sublinha a necessidade de uma diferenciação mais clara da sua utilidade pretendida e estrutura de governança. A aceitação e adoção futuras dependerão provavelmente da abordagem da atual opacidade e da definição mais explícita das suas estratégias operacionais e económicas. Nota: Este relatório abrange informações sintetizadas disponíveis até outubro de 2023, e desenvolvimentos podem ter ocorrido além do período de pesquisa.

92 Visualizações TotaisPublicado em {updateTime}Atualizado em 2025.05.13

O que é $BITCOIN

Discussões

Bem-vindo à Comunidade HTX. Aqui, pode manter-se informado sobre os mais recentes desenvolvimentos da plataforma e obter acesso a análises profissionais de mercado. As opiniões dos utilizadores sobre o preço de BTC (BTC) são apresentadas abaixo.

活动图片