Executive Summary
- After several months of relatively heavy distribution pressures, the behavior of Bitcoin holders appears to be rotating back towards HODLing and accumulation.
- Activity in spot markets shows that there has been a net bias towards sell-side pressure of late, and this has not yet completely subsided.
- Compared to ATH breaks in past cycles, there is currently a relatively large percentage of network wealth held by the Long-Term Holder cohort.
- Overall, on-chain conditions speak to an undertone of high conviction amongst the Bitcoin holder-base.
A Return to HODLing
As the market begins to slowly recover from the sell-off last week, there is a discernible level of uncertainty, and indecision amongst digital asset investors. Nevertheless, when analyzing the onchain response of investors to these choppy market conditions, a trend of a preference for HODLing is beginning to emerge.
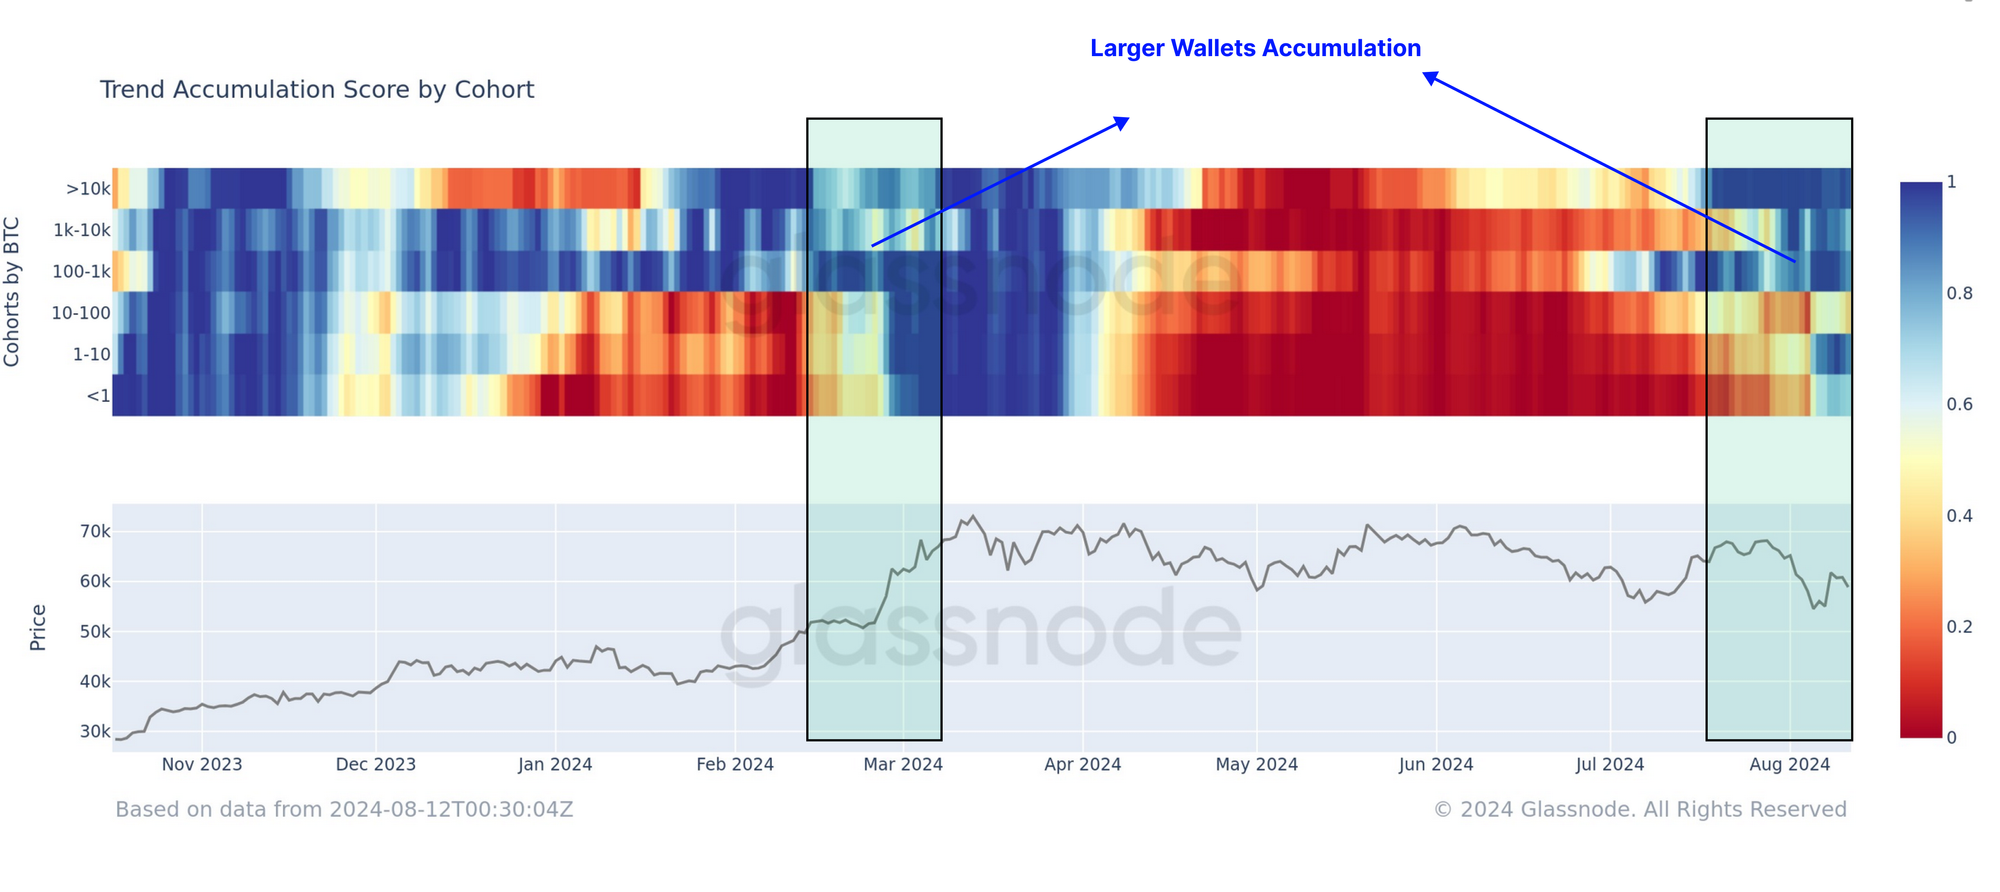
Since the Bitcoin price ATH was established in March, the market faced an extensive period of supply distribution, with participation by wallets of all sizes. Over the last few weeks, this trend is showing early signs of reversing, particularly for the largest wallet sizes which are often associated with ETFs. These large wallets appear to be returning to a regime of accumulation.
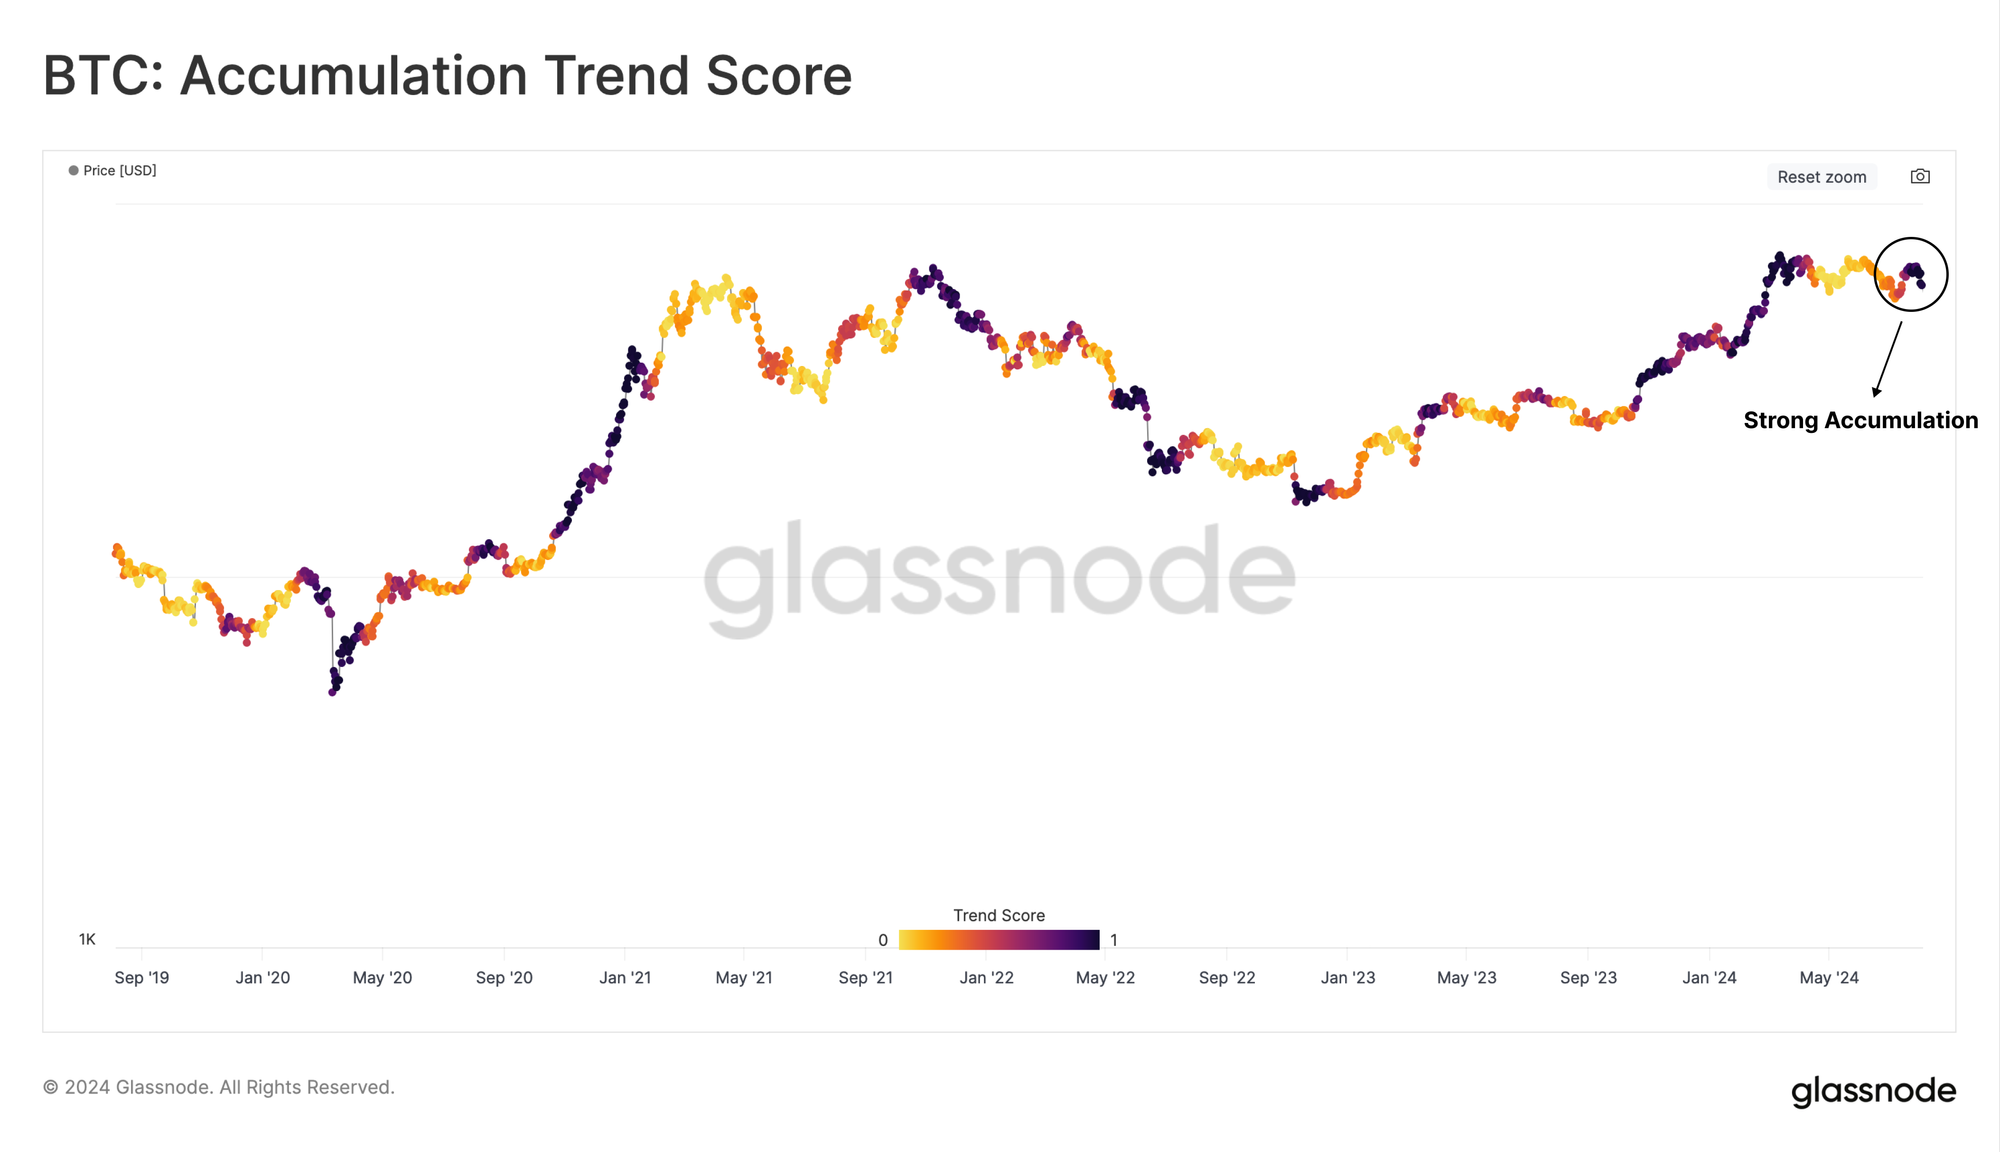
The Accumulation Trend Score (ATS) metric assesses a weighted balance change across the market. This metric also suggests there is a shift back towards accumulation dominant behavior.
The aforementioned shift towards accumulation has contributed to the ATS recording its highest possible value of 1.0, suggesting significant accumulation throughout the last month.
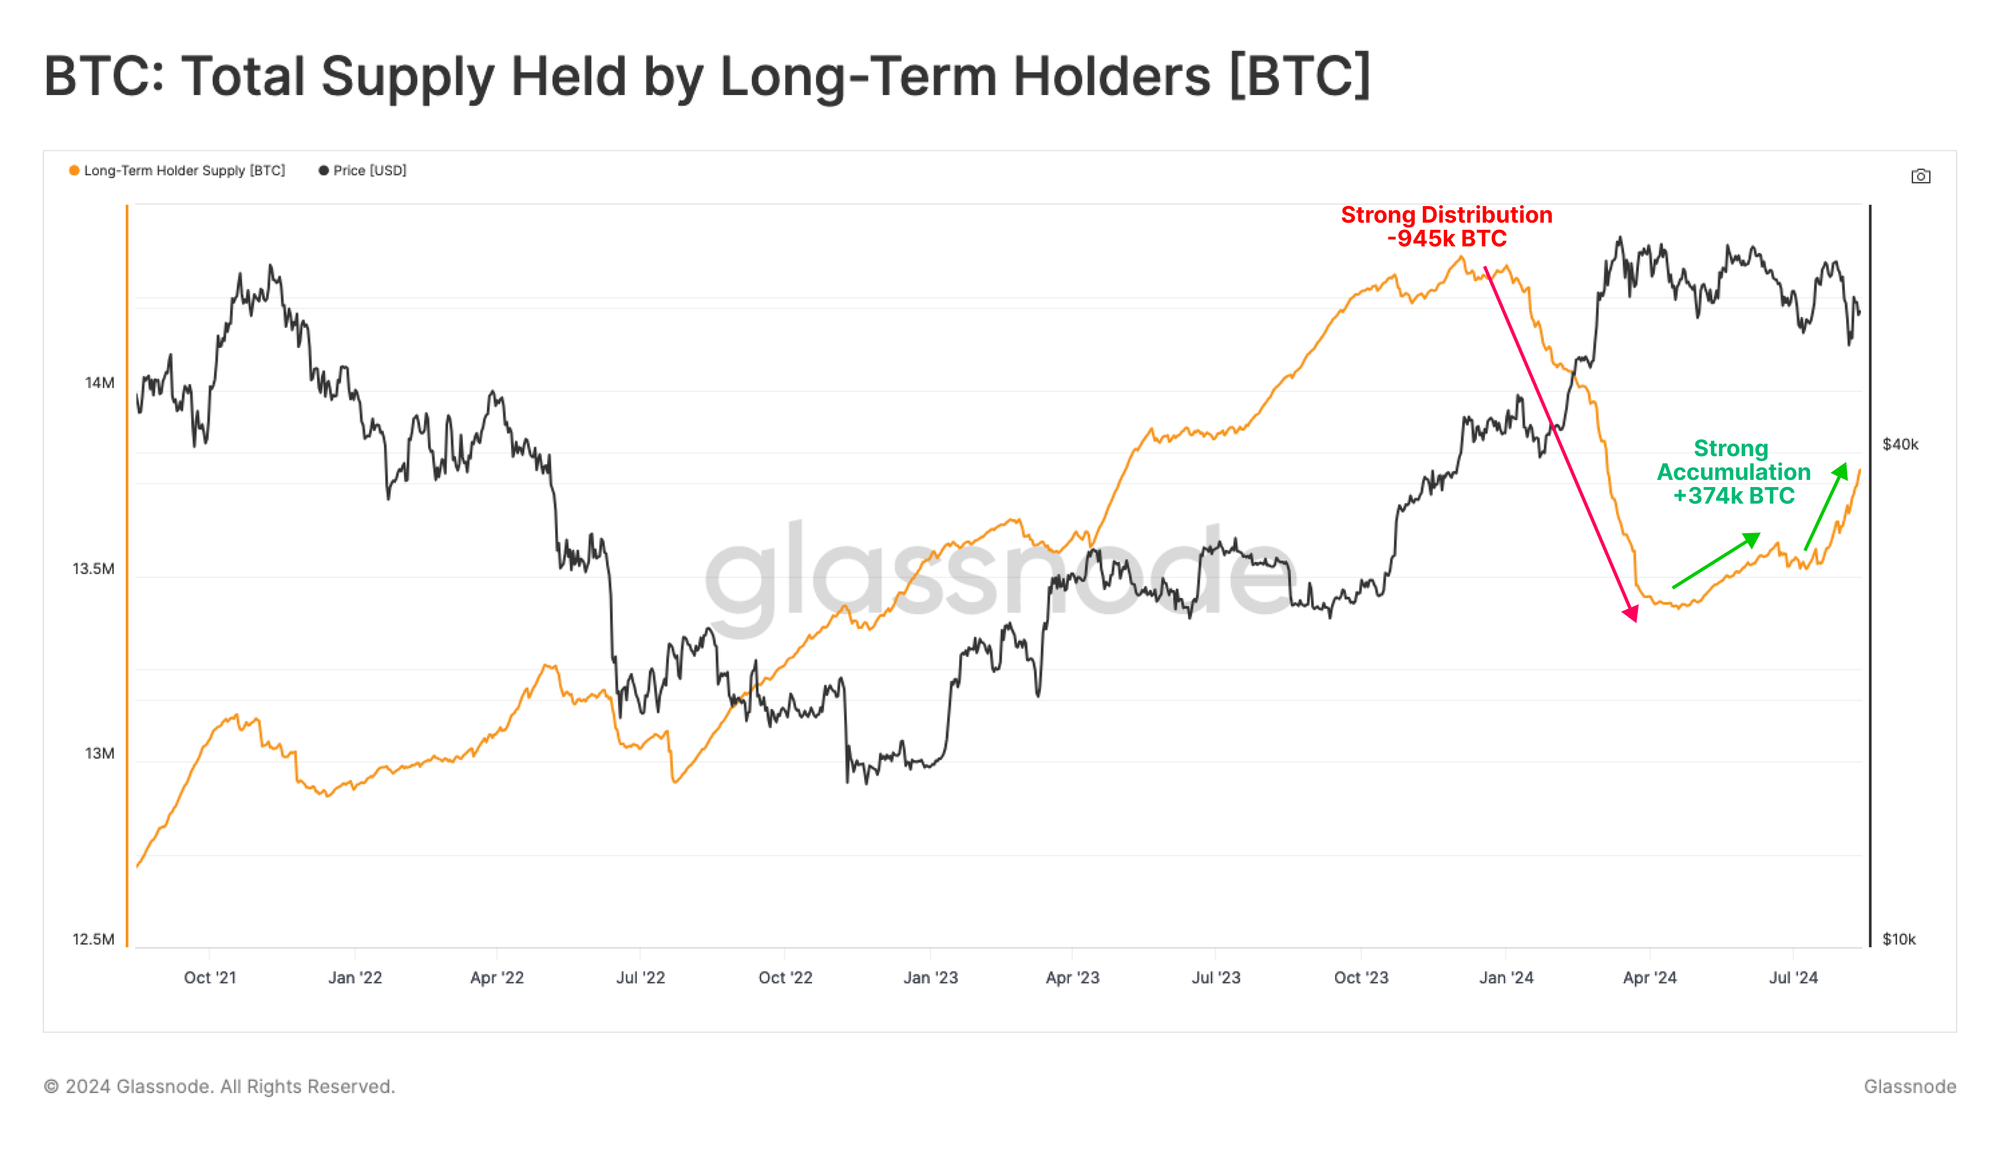
This observation is echoed across Long-Term Holders (LTH), who heavily divested during the run up to the ATH. This cohort have now returned to a preference for HODLing, with a total volume of +374k BTC migrating into LTH status over the last 3-months.
From this, we can infer that the propensity for investors to hold onto their coins is now a larger force relative to their spending pressures.
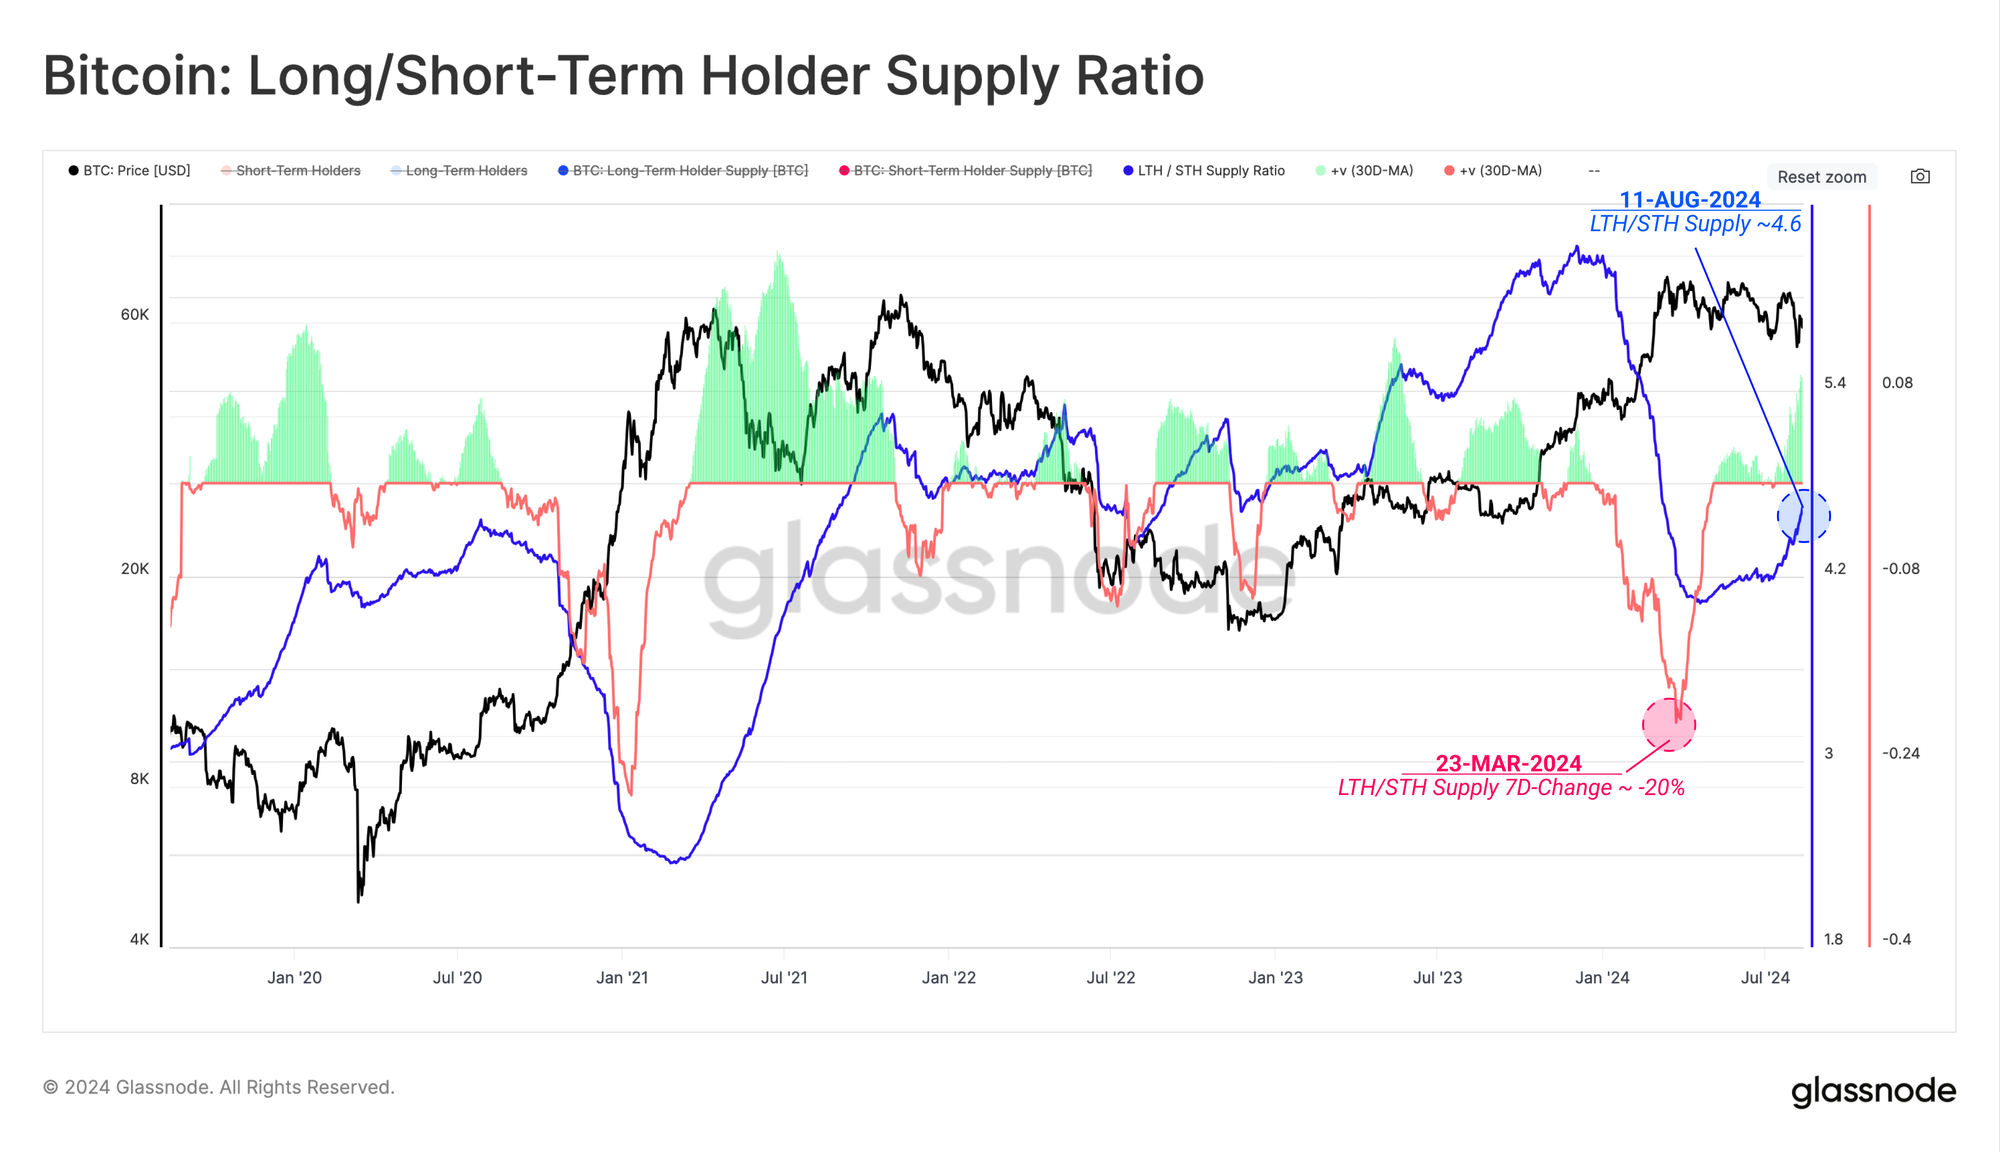
We can also assess the 7-day change in LTH supply as a tool to assess rates of change in their aggregate balance.
We can see substantial LTH distribution, typical of macro topping formations, into the March ATH. Fewer than 1.7% of trading days have ever recording a larger distribution pressure. More recently, this metric has returned to positive territory, indicating that the LTH cohort are expressing a preference for holding onto their coins.
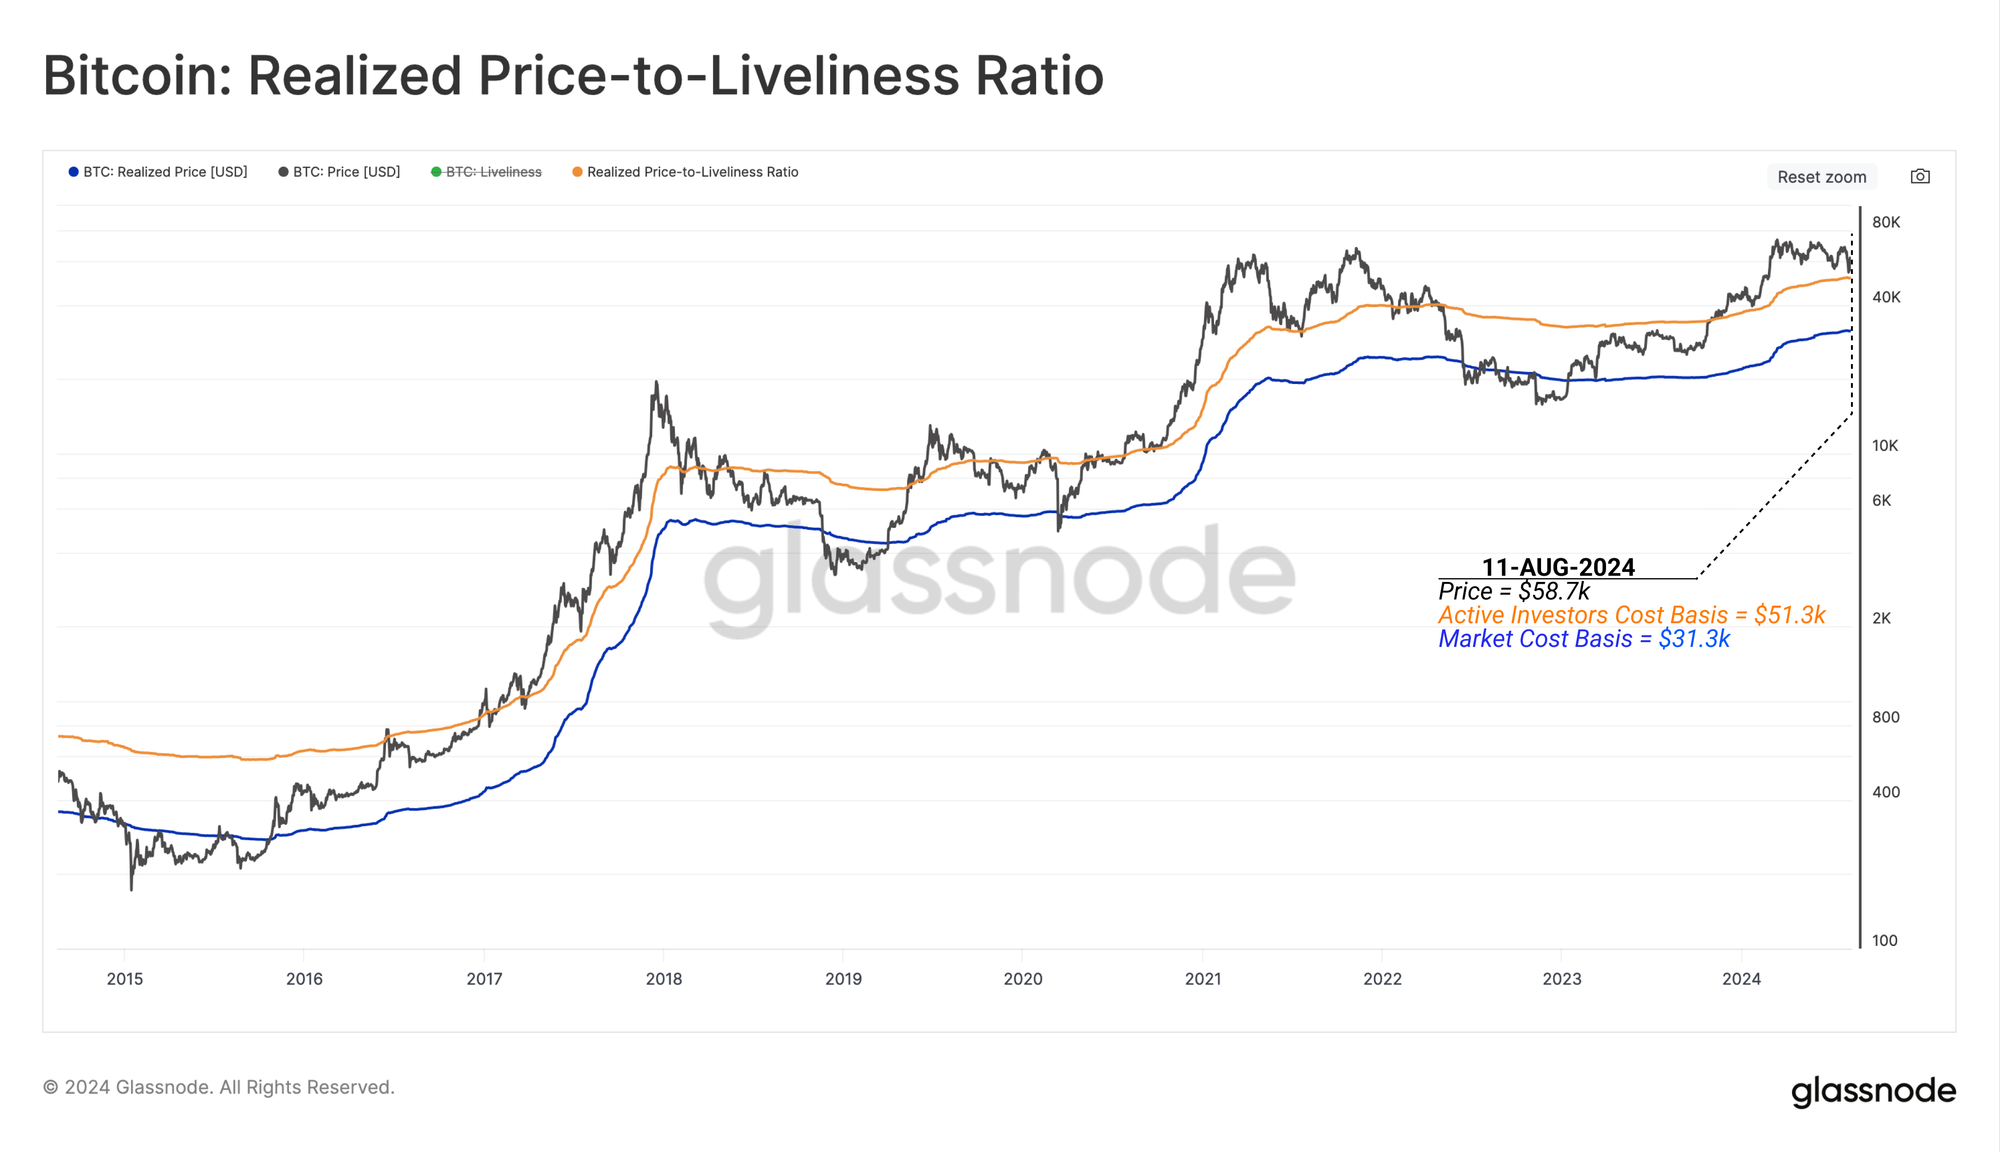
Despite the aggressive distribution from April to July, the spot price has continued to trade above the Active Investor Cost Basis, which represents the average acquisition price of active coins in the market.
The Active Investor’s Cost-Basis can be considered as a key threshold delineating bullish and bearish investor sentiment. Since the market managed to find support near this level speaks to a degree of underlying strength, suggesting investors are generally still anticipating positive market momentum in the short-to-medium-term.
Evaluating Bias in Spot Markets
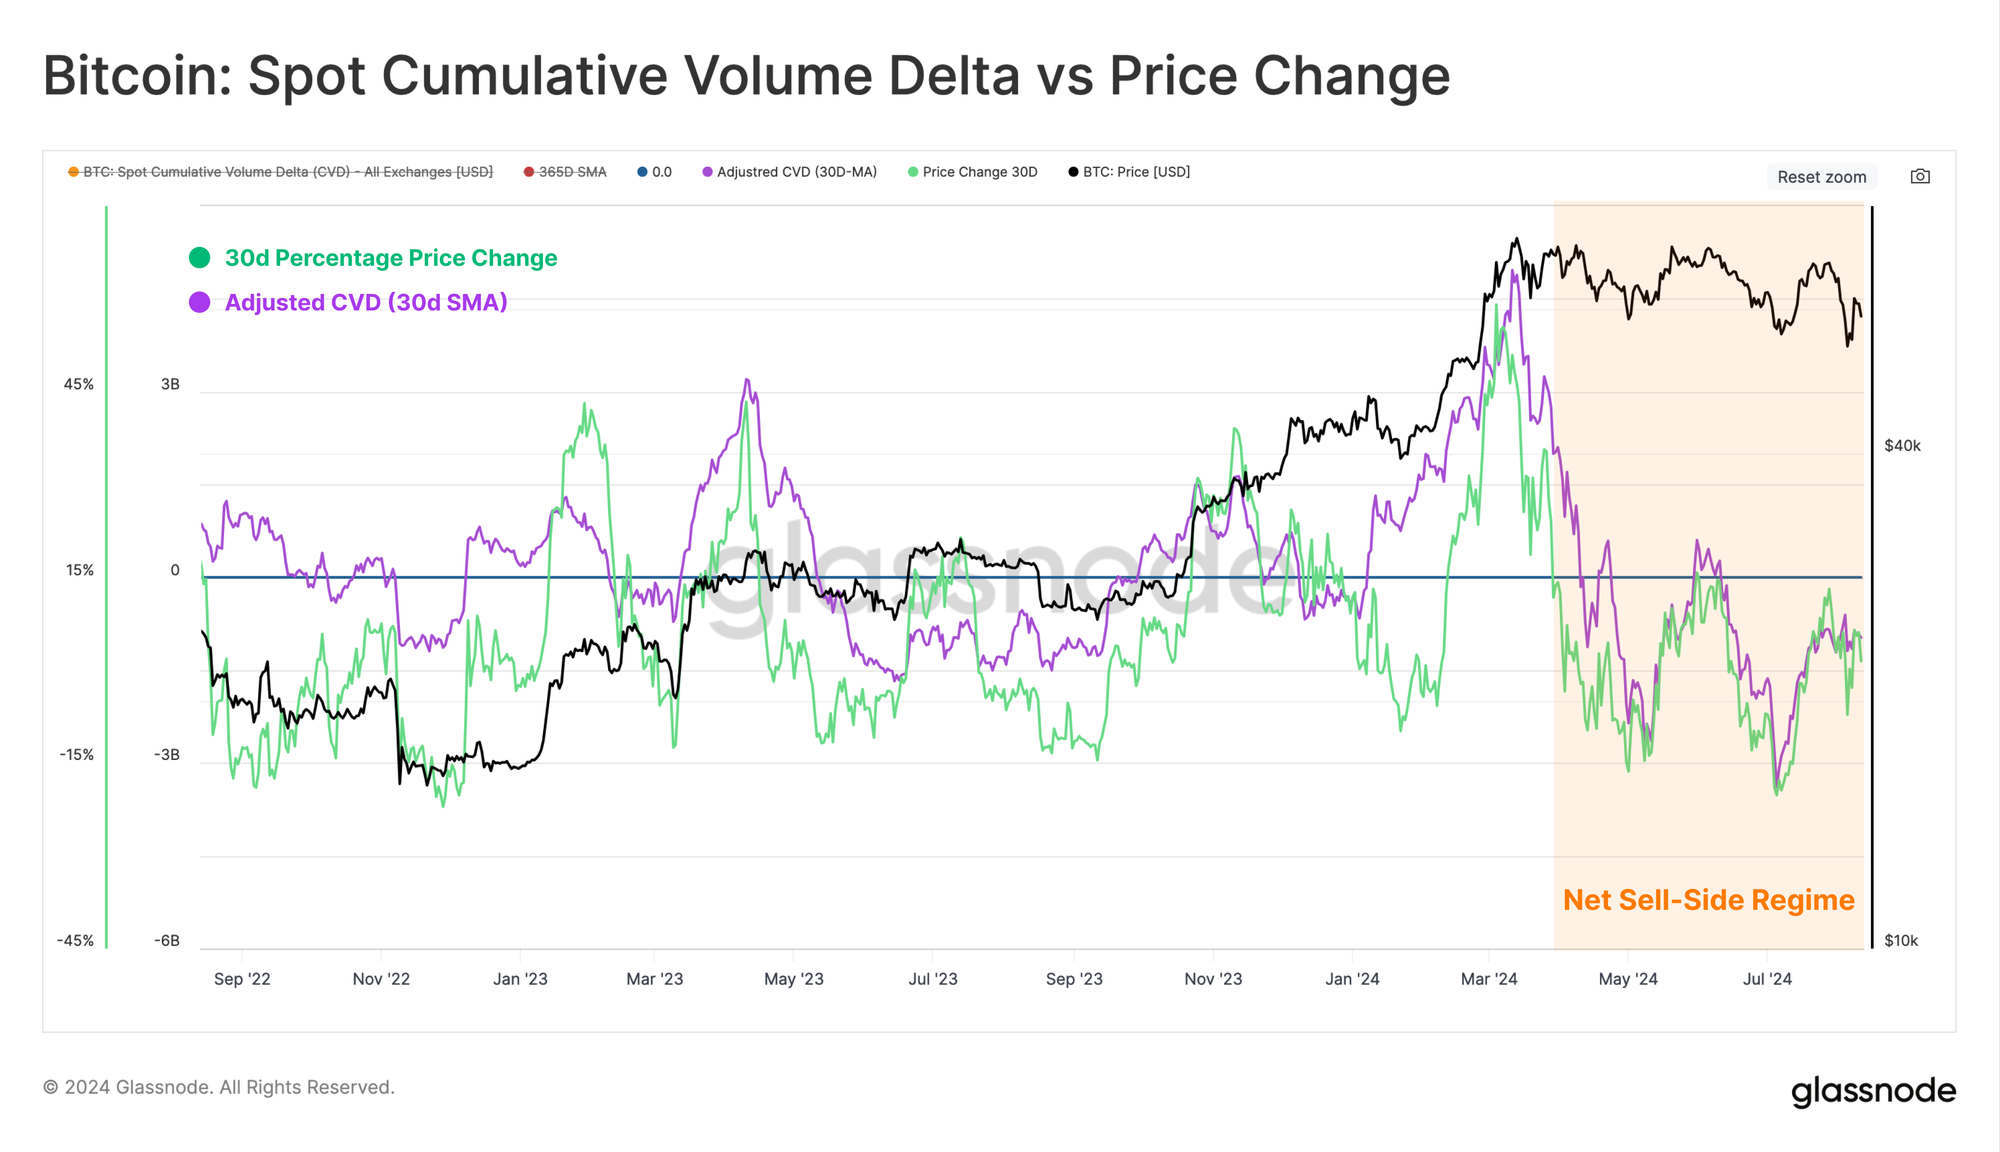
With the market within a technical downtrend, we can employ the CVD metric to estimate the present net balance between market buying and selling pressure in spot markets.
This metric can in turn be used to assess mid-term market momentum, as well as any headwinds or tailwinds for price. Since the formation of a new ATH, we note there has been a consistent regime of net sell-side pressure.
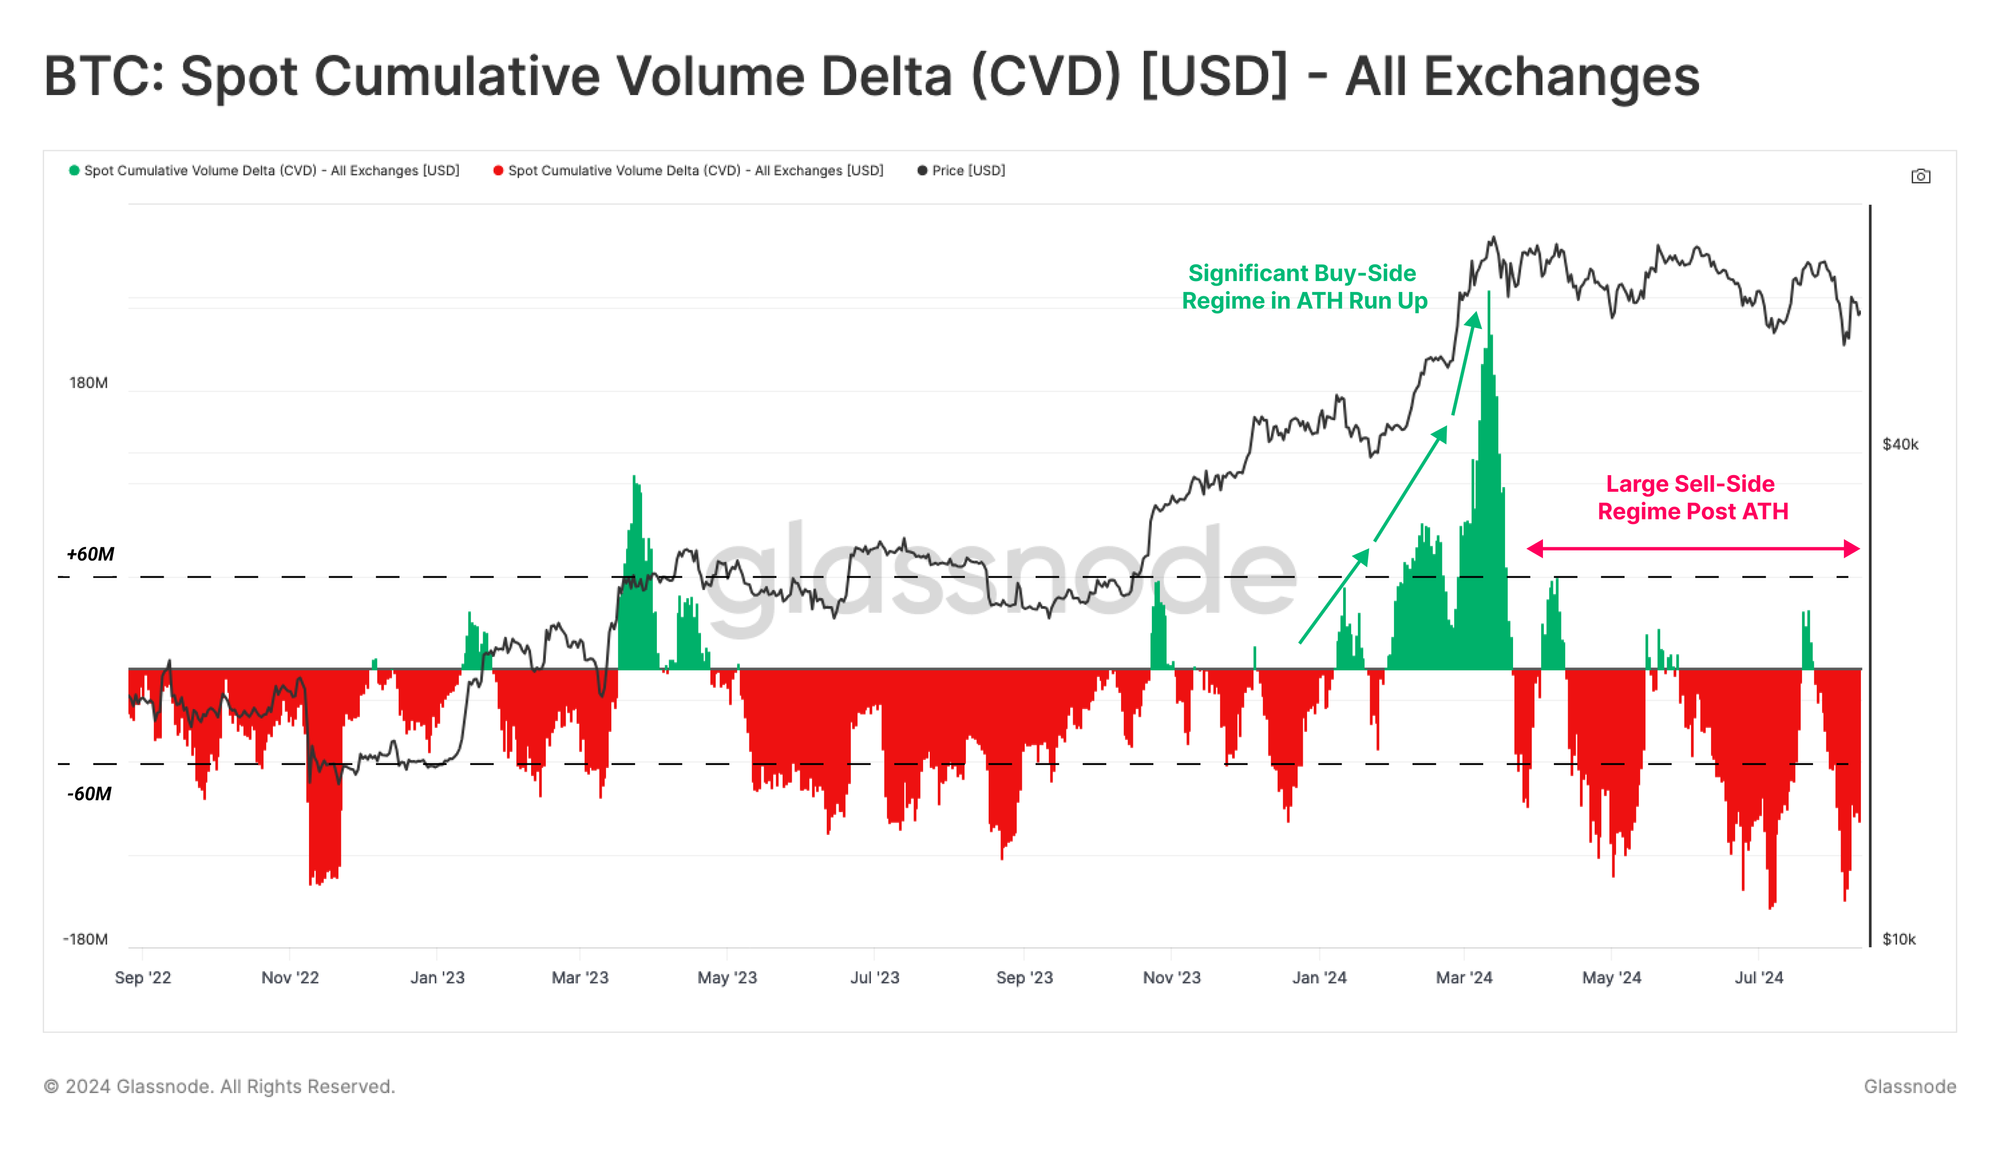
Positive CVD values suggest a net buy-side pressure, where as negative values infer a net sell-side pressure.
When we analyze the yearly median value of Spot CVD, we can see that the median value has fluctuated between -$22m and -$50m over the last 2 years, suggesting the presence of a net-sell side bias.
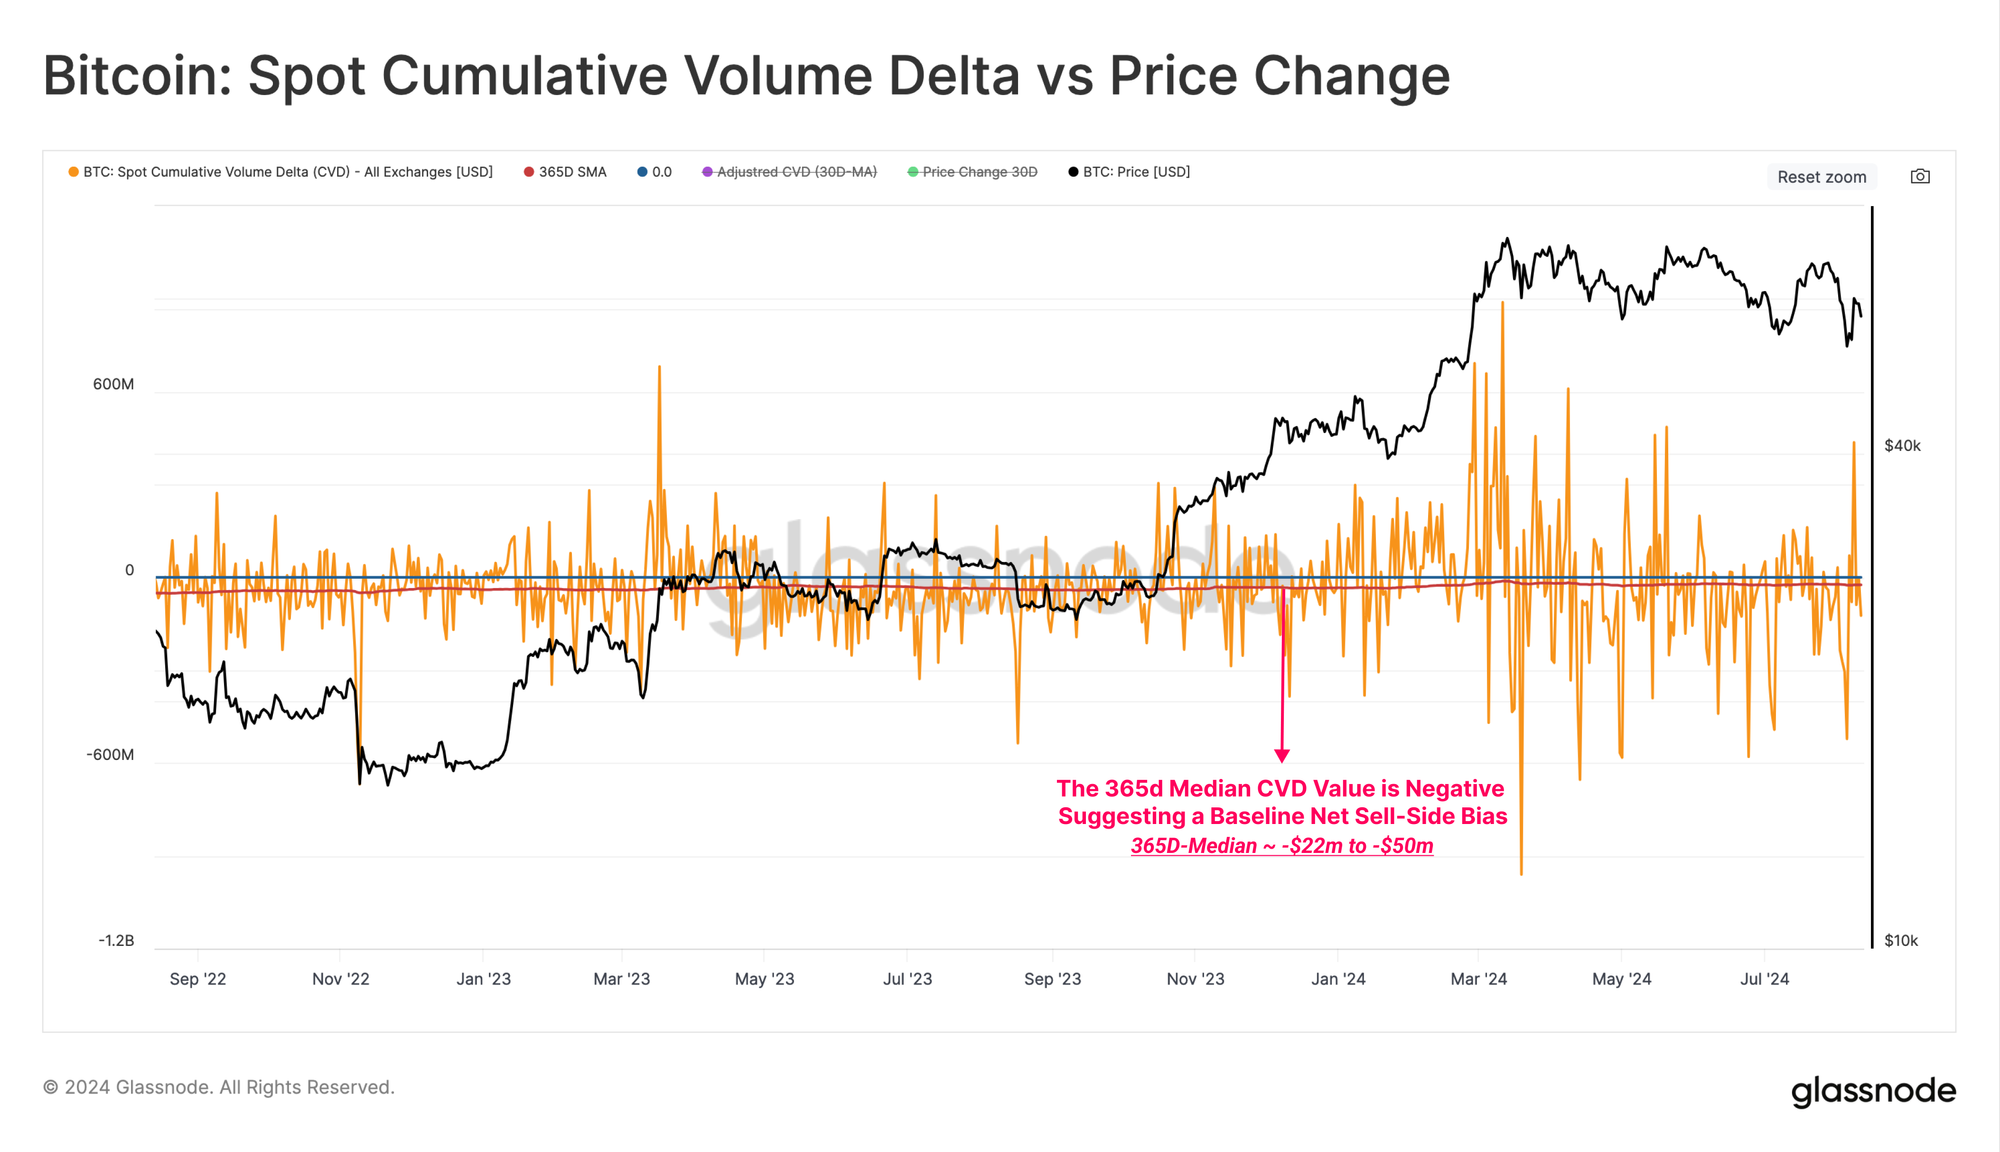
If we consider this long-standing median as a baseline for CVD equilibrium, we can produce an adjusted variant of the metric, accounting and correcting for this implicit sell-side bias.
When comparing the Adjusted Spot CVD (30d SMA) against the Monthly Percentage Price Change, an intriguing confluence can be found.
Under this framework, the recent failure to break above the $70k zone can be partially explained by weakness in spot demand (negative adj-CVD). Alternatively, a potential recovery of demand in the spot market can be confirmed when the Adj-CVD metric returns to positive values.
Cycle Navigation
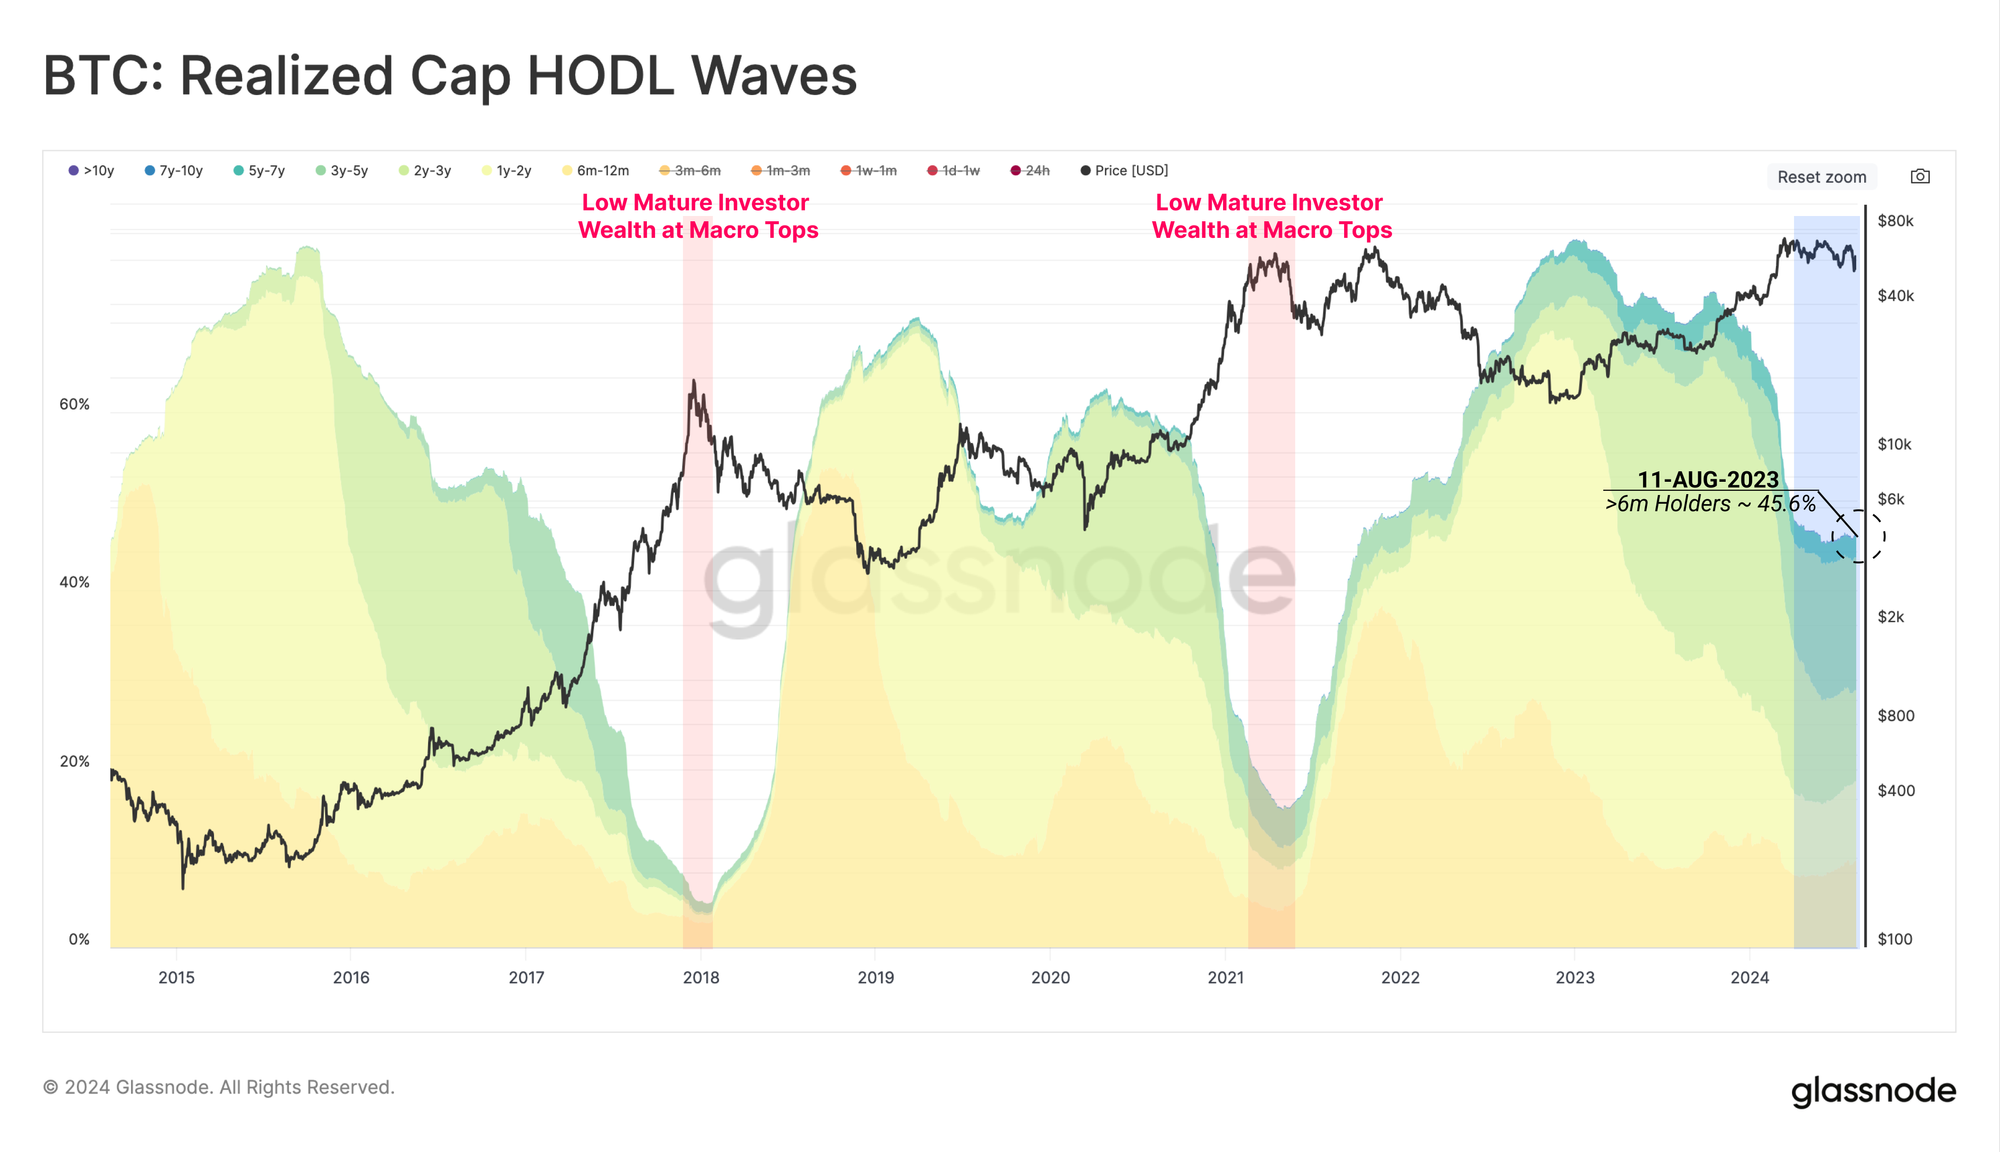
Choppy sideways price action in recent months has motivated a notable slow-down in the distribution pressure by LTHs. This has led to the percentage of network wealth held by this cohort to firstly stabilize, and then recommence growing.
Despite the substantial sell-side pressure by LTHs into the market ATH, wealth held by longer-term investors remains historically elevated when compared to previous all time high breakouts.
This indicates that there is a potential for further divestment pressure by LTHs should the BTC price appreciate in the future. It also suggests that even though prices have traded sideways, to downwards of late, these investors are increasingly unwilling to part ways with their coins at lower prices.
Both of these observations speak to a more patient and resilient holder-base, despite choppy market conditions.
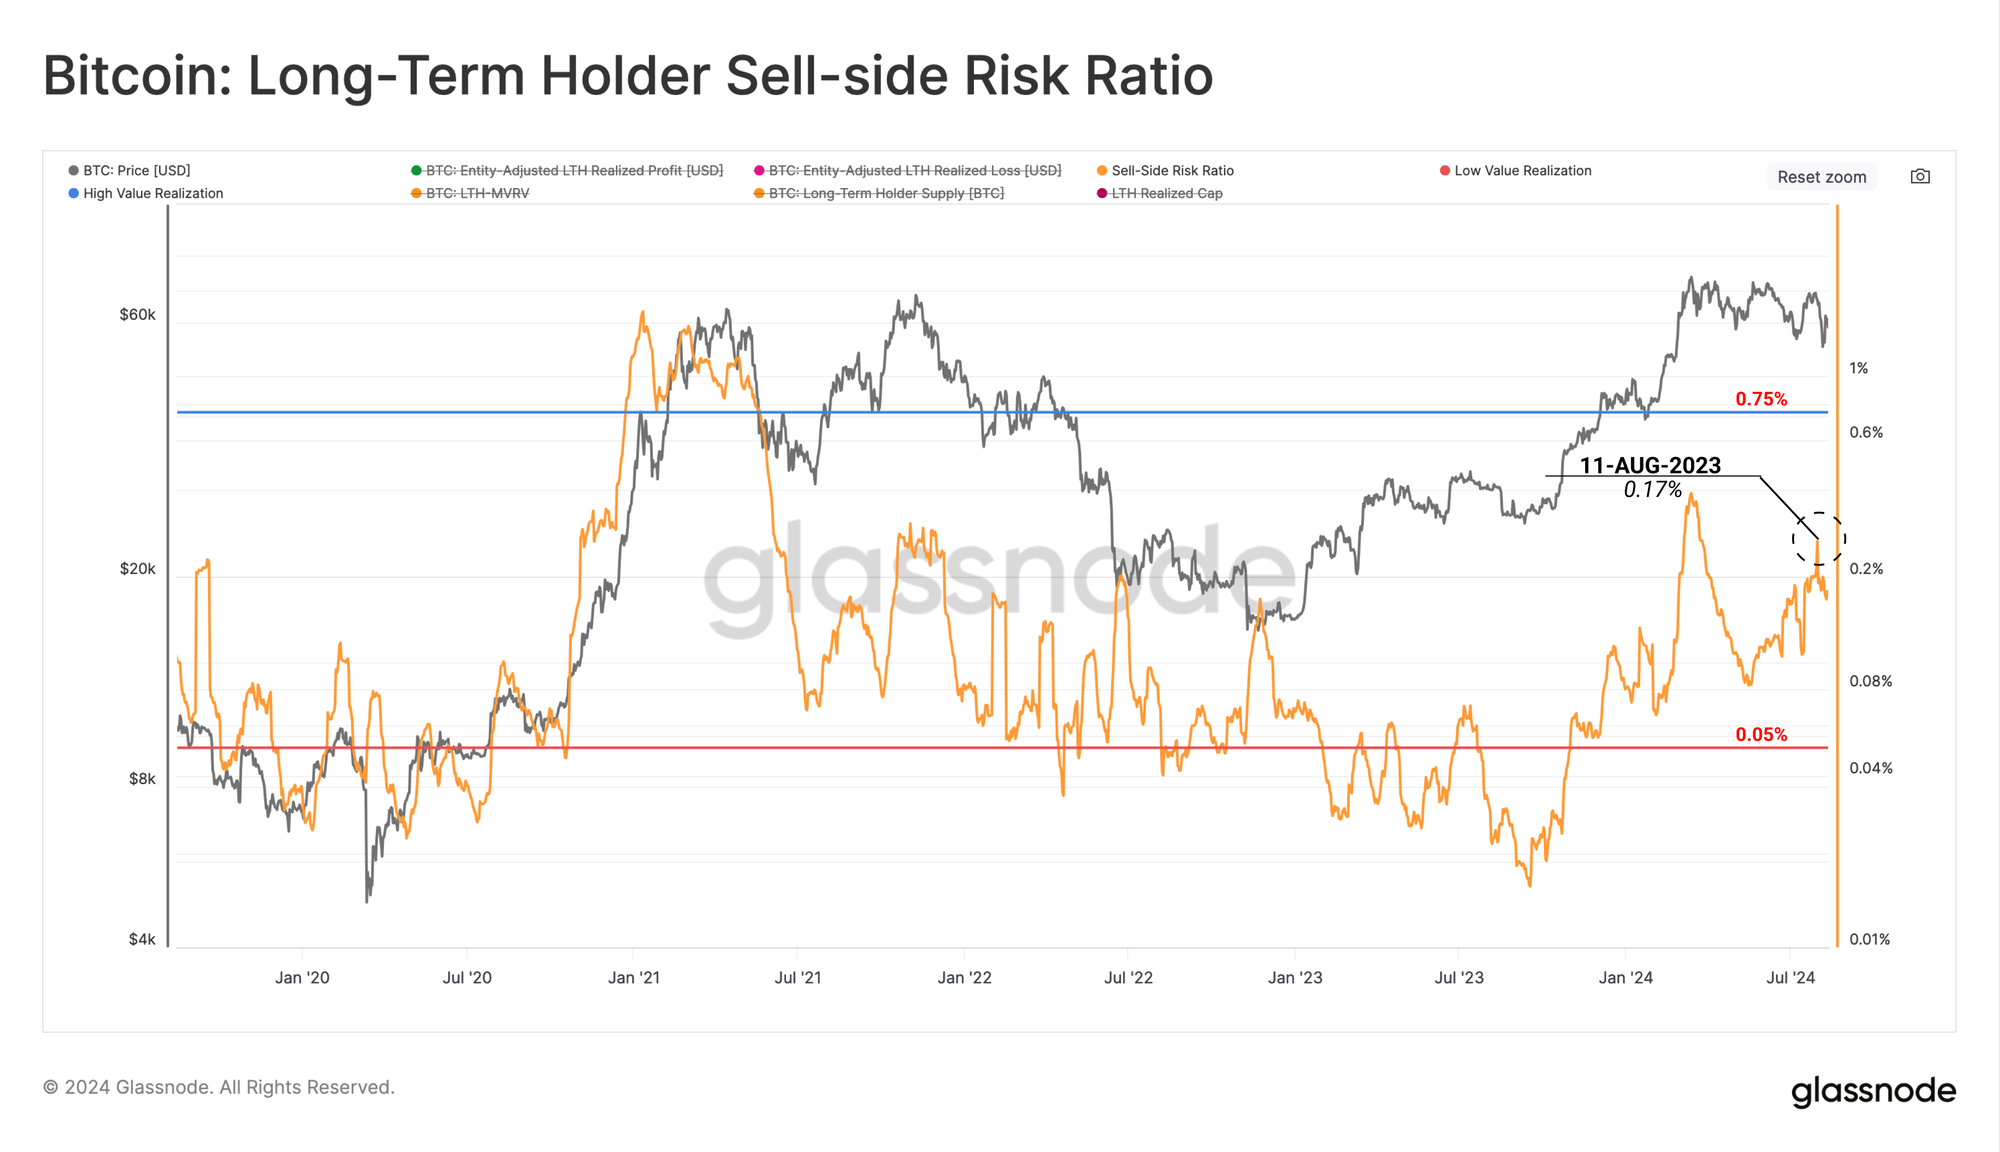
Finally, we can bolster this assessment using the LTH Sell-Side Risk Ratio. This tool gauges the absolute sum of realised profit and loss locked in by investors, relative to the size of the asset (the Realized Cap). We can consider this metric under the following framework:
- High values indicate that investors are spending coins at a large profit or loss relative to their cost basis. This condition indicates that the market likely needs to re-find equilibrium, and usually follows a high volatility price move.
- Low values indicate that the majority of coins are being spent relatively close to their break even cost basis, suggesting a degree of equilibrium has been reached. This condition often signifies an exhaustion of ‘profit and loss’ within the current price range, and usually describes a low volatility environment.
The LTH Sell-Side Risk ratio remains at a lower level compared to prior ATH breaks. This implies that the magnitude of profit taken by the LTH cohort is comparatively small relative to previous market cycles. This also infers that this cohort is waiting for higher prices before ramping up their distribution pressure.
Summary and Conclusions
Despite challenging and choppy market conditions, Long-Term Bitcoin Holders remain remarkably steadfast in their conviction, with evidence they are ramping up accumulation behaviour.
An elevated percentage of Bitcoin network wealth is held by this investor cohort relative to previous cycle ATH breaks, which suggests there is a degree of investor patience on display, and waiting for higher prices. Additionally, the lack of panic selling amongst this cohort in lieu of the largest price contraction of the cycle highlights a resilience of their aggregate conviction.
Disclaimer: This report does not provide any investment advice. All data is provided for information and educational purposes only. No investment decision shall be based on the information provided here and you are solely responsible for your own investment decisions.
Exchange balances presented are derived from Glassnode’s comprehensive database of address labels, which are amassed through both officially published exchange information and proprietary clustering algorithms. While we strive to ensure the utmost accuracy in representing exchange balances, it is important to note that these figures might not always encapsulate the entirety of an exchange’s reserves, particularly when exchanges refrain from disclosing their official addresses. We urge users to exercise caution and discretion when utilizing these metrics. Glassnode shall not be held responsible for any discrepancies or potential inaccuracies. Please read our Transparency Notice when using exchange data.
- Join our Telegram channel
- For on-chain metrics, dashboards, and alerts, visit Glassnode Studio
- For automated alerts on core on-chain metrics and activity on exchanges, visit our Glassnode Alerts Twitter