Bitcoin Bearish Chart Pattern Looms, Legendary Trader Sounds Warning

newsbtcPublicado em 2023-05-12Última atualização em 2023-05-12

Resumo

Bitcoin, the largest cryptocurrency by market capitalization, has shown significant weakness in today's trading session after failing to continue on its instant price rally following yesterday's release of the April...

Bitcoin, the largest cryptocurrency by market capitalization, has shown significant weakness in today’s trading session after failing to continue on its instant price rally following yesterday’s release of the April CPI report at 4.9%.
So far, the trading week has been negative for the alpha cryptocurrency as it is seen to decline further on its sixth consecutive bearish candle on the daily timeframe.
In addition, the legendary crypto trader, Peter Brandt, has raised concerns and a sound warning about a potential bearish chart pattern formation which the alpha cryptocurrency is seen to complete on the daily timeframe.

Will Bitcoin Bulls Yield To This Potential Bearish Chart Pattern Formation
Earlier today, the legendary prop trader, Peter Brandt, identified a potential head and shoulders chart pattern forming for Bitcoin on the daily time frame.
Peter Brandt had sounded a warning in a tweet on Thursday morning urging BTC traders and investors to pay serious heed and attention to this bearish chart pattern if it forms successfully.

A head and shoulders should be taken seriously if it is completed $BTC pic.twitter.com/n5ZiLasmUC
— Peter Brandt (@PeterLBrandt) May 11, 2023

A head and shoulders pattern in technical analysis is a chart pattern formation of a digital asset that predicts a potential price reversal in market trends. A typical head and shoulders pattern could be seen on a price chart as a baseline with three peaks, where the highest peak (Head) is in the middle of two shoulders with lower peaks of almost the same heights.

On establishing this definition, the head and shoulder pattern which is potentially forming for Bitcoin on the daily time frame indicates a bearish reversal of the asset as the second shoulder is seen to potentially form on the daily timeframe. If and when it forms successfully could mean a massive and continued decline in the price of the alpha cryptocurrency.
The key areas surrounding the second shoulder formation are decisive levels for bulls and bears to gear into action. So unless Bitcoin bulls swing into action and save price, a successful formation of the second shoulder could occur, sending sell signal opportunities to crypto traders.
BTC Price Analysis On The Daily Timeframe
At the time of writing, data reports from Coinmarketcap show BTC trading at $27,381, which is a 3% drop in price in the last 24 hours. The market capitalization of the alpha cryptocurrency is also experiencing a 2.91% decline.
However, the April Consumer Price Index (CPI) report, released yesterday, brought renewed hopes and positive sentiments back to the crypto markets as it stood at 4.9% lower than the expected 5.0%.
Bitcoin rallied on the news, reaching a peak of $28,305 before it retraced in price. Although, positive market sentiments stemming from BTC’s reaction to the CPI report were shortlived as the alpha cryptocurrency dumped massively in price due to market liquidity concerns.
On the daily timeframe, BTC price is seen to trade slightly above the $27,100 crucial support which must hold for the price to move to the upside. If and when Bitcoin picks up momentum, bulls will be faced with an immediate resistance at $27,800.

Bitcoin


Bitcoin price forms a potential head and shoulder pattern on the daily timeframe | Source: BTCUSD on TradingView.com
Featured image from Istock, chart from TradingView.com

Leituras Relacionadas

Solana Proposals Could Lead to Reduction in Staking Yields to 2.25% and Cut Emissions by $1.5 Billion

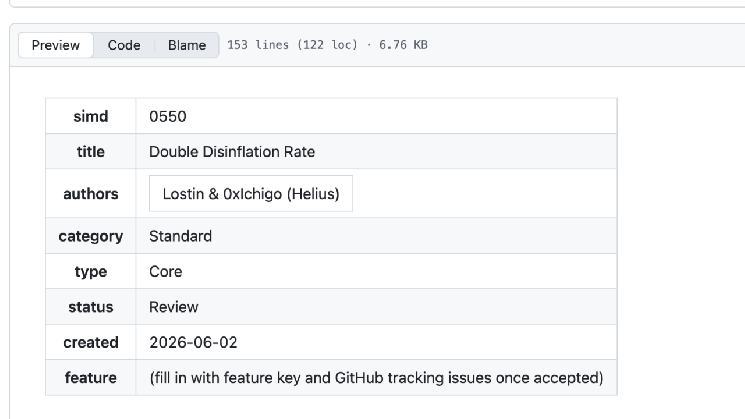
Solana is moving towards a stricter monetary model that could lead to a SOL deficit and significantly reduce staking rewards for holders. Two governance proposals drive these changes. SIMD-550, currently under vote, would double Solana's annual disinflation rate from 15% to 30%, accelerating the timeline to reach a final inflation rate of ~1.5% to the first half of 2029. The second, SIMD-553 (already approved), introduces additional token burning tied to computational units used on the network. Together, these measures could reduce SOL emission by an estimated $1.4-$1.5 billion over six years. The immediate impact would be lower staking yields, potentially falling from the current ~5.25% to approximately 4.34% in year one, 3% in year two, and 2.25% by year three. Analyst Matt Mena from 21Shares suggests inflation should be tied to economic metrics to help offset this decline. The changes also raise concerns for validator economics, with some potentially becoming unprofitable as inflation rewards decrease and voting costs may rise. However, the lower passive yield might push a significant portion of the 67.9% staked SOL into Solana's DeFi ecosystem for activities like lending and trading. This shift could boost network fee revenue to compensate for lower inflation rewards. The proposals aim to trade lower yield today for less dilution tomorrow, betting that network growth and usage will make this a worthwhile trade-off for SOL holders.

cryptonews.ruHá 30m

Solana Proposals Could Lead to Reduction in Staking Yields to 2.25% and Cut Emissions by $1.5 Billion

cryptonews.ruHá 30m

Bitcoin 'Basically Hopped' to $80K. What Will Happen to the Price in Autumn?

Bitcoin surged close to $80,000 in August, marking its fastest growth since 2024. Experts anticipate continued volatility for the autumn season, with price forecasts heavily dependent on macroeconomic conditions and regulatory developments in the US. Key drivers for the recent rise include a weakening US dollar, renewed capital inflows into spot Bitcoin ETFs, and liquidations of trading positions. The US Treasury's decision to increase long-term bond purchases has helped stabilize debt markets but pressured the dollar, leading investors to seek assets like Bitcoin as a hedge. Looking ahead, experts outline two primary scenarios for Bitcoin's price. A positive outcome, supported by favorable macroeconomics and the potential passage of the CLARITY Act regulating crypto in the US, could push Bitcoin toward $85,000-$100,000. Conversely, a negative scenario involving hawkish signals from the US Federal Reserve or regulatory setbacks could trigger a correction, potentially driving the price back down to the $62,000-$75,000 range. Institutional demand, reflected in consistent ETF inflows, is seen as a crucial stabilizing factor, gradually outweighing the influence of Bitcoin's traditional four-year cycles. Meanwhile, a broad rally in altcoins is not widely expected, as capital is likely to flow selectively into the most liquid projects. The central question for autumn is whether institutional buying can transform August's rapid surge into a sustainable upward trend.

cryptonews.ruHá 34m

Bitcoin 'Basically Hopped' to $80K. What Will Happen to the Price in Autumn?

cryptonews.ruHá 34m

Trading

Spot
活动图片