[strong data] short positions broke us $588 million, BTC bulls still accounted for a large proportion

Huobi ResearchPublicado em 2022-03-29Última atualização em 2022-03-30

Resumo

The stock of BTCs in the exchange fell to 2.315 million BTCs on March 28.

This column combs the trading status of the spot market and futures market within the day, and analyzes the trading performance of BTC and the overall market. Help investors tap effective trading signals.

Market view

During the continuous rebound of mainstream currencies such as BTC and eth, they have touched the cost price of investors in the past year. At present, the majority of investors trading in the past year have made profits, which has enhanced the driving force of the market to further rise. The current trend is favorable for bulls, and the contract position has reached a recent high, indicating that the willingness to do long has increased.

goods in stock

1. Stock exchange BTC

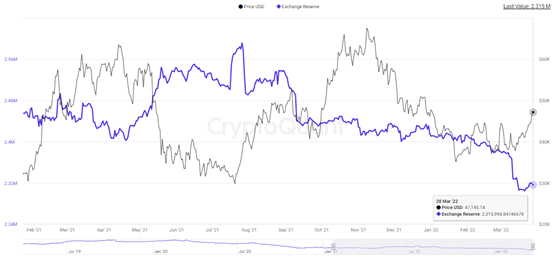
The stock of BTCs in the exchange fell to 2.315 million BTCs on March 28. From the change of BTC stock in the exchange, the outflow increased from February to March, indicating that the selling pressure of BTC continues to reduce. Although there are signs of rebound in BTC stock recently, there is little room for rebound. The BTC stock of the exchange retreated after reaching 231.98, indicating that the BTC selling pressure decreased after a slight increase, and the short-term trend is more BTC.

2. Market value and trading volume of the whole network

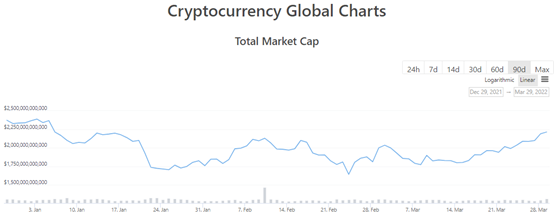
In the past 24 hours, the overall market trading volume was US $125.43 billion, and the overall market value increased by 1.5% to US $224.06 billion. Focus on the trading volume and market value performance of the overall market in the past three months. The market value fluctuation space of the whole network is between us $16423.3 billion and US $2387.7 billion, and the current market value is almost the highest in three months. In the form of continuous changes in market value, it is shown as double bottom reversal, which improves the bullish signal.

contract

Contract transactions in mainstream currencies such as BTC can find spot prices and improve the direction of price operation. At the same time, it can also provide hedging methods for spot investors. Analyzing the long and short position direction, position change and leverage performance of the contract can help us confirm the trading signal.

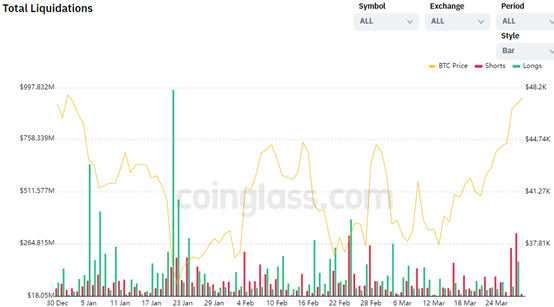
1. Statistics of warehouse explosion in the whole network

The number of open positions indicates the effect of the release of market resistance during the price operation. The larger the number of open positions, the greater the reverse capital strength. After a short period of time, the excessively high position explosion amount can also prompt the price reversal signal. Because the fund increases the number of positions in the opposite direction in a short time, promoting the reverse operation of the market in a short time.

Network wide contract explosion

On March 29, the empty single explosion warehouse of the whole network contract reached US $62 million, and the multi single explosion warehouse of the whole network reached US $11 million. In the three trading days since March 27, the scale of empty single position explosion reached US $244 million, US $313 million and US $31 million. In the same period, the scale of multiple single position explosion was US $62 million, US $179 million and US $11 million. The accumulated position explosion of empty orders is US $588 million, which means that the strength of bulls is strong, and the market has shown a unilateral trend in the near future.

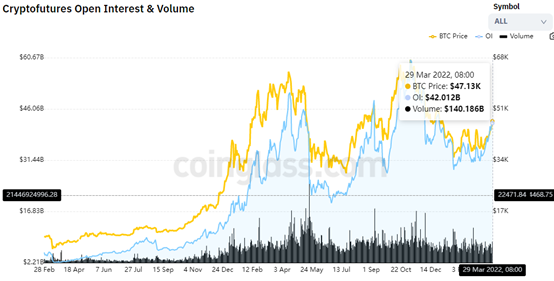
2. Statistics of positions and turnover of the whole network

The contract trading volume of the whole network was stable. The position rebounded to US $42 billion on March 29, up 46.5% from the lowest US $28.67 billion on January 23; The turnover was 140 billion US dollars. It is worth noting that the contract position is the highest level in one year, indicating that the overall market heat is growing continuously.

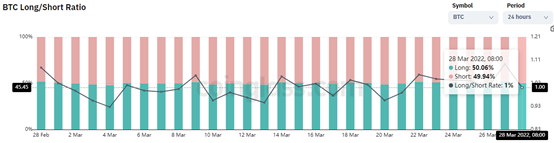
3. Statistics of long and short positions of the exchange

The proportion of long and short positions in the exchange intuitively reflects the strength of long and short positions, and the dynamic proportion of long and short positions better verifies the trading signal. When multiple positions account for a large proportion, it indicates that the buyer has strong strength, and the BTC price is easy to rise but difficult to fall. On the contrary, the short strength is strong, suggesting a short signal.

On March 29, the proportion of multiple empty orders in BTC was 1%, the proportion of multiple orders was 50.06%, and the proportion of empty orders was 49.94%. The multi-party dominance has continuously dominated since March 22, driving the BTC price to continue to rise. At present, there is a slight decline in the proportion of BTC bulls, and attention can be paid to low absorption opportunities in the short term.

4. Contract capital rate

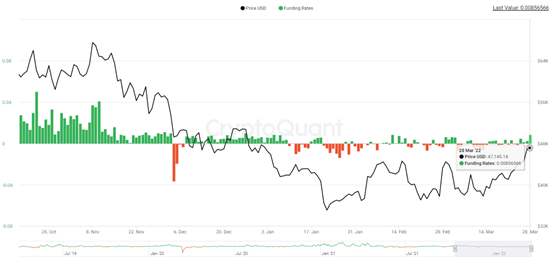
The higher the contract capital rate, the more information the bulls have about the price rise. The latest capital rate value of BTC shows that the fluctuation space of capital rate since 2022 is small, and the financing cost on more trading days is lower than 0, which means that the cost of financing for investors to buy BTC is very low.

Driven by low purchase costs, BTC price shocks stabilized. At the same time, financing costs also showed signs of a slight recovery. The latest financing cost on the 29th of March reached 0.0085. In absolute terms, the value is much lower than the level before November 4, 2021. This shows that the main capital has a low enough cost advantage to buy BTC and push up the price increase.

Leituras Relacionadas

How Far Are We from the End of the Crypto Bear Market?

How Much Longer Until the Crypto Bear Market Ends? A persistent negative Coinbase Bitcoin Premium Index, reaching a record 46 consecutive days of negative values, underscores the ongoing crypto bear market. The downturn accelerated in late May/early June when MicroStrategy (referred to as "Strategy" in the text), a major BTC holder, sold a small amount of Bitcoin (32 BTC), shattering market confidence and triggering sharp declines in BTC, ETH, and SOL. This was compounded by sustained net outflows from US spot Bitcoin ETFs. June saw Bitcoin briefly fall below $60,000, its worst weekly performance since 2022, breaking below the critical 200-week moving average—a signal some analysts consider confirmation of a bear market. While some institutional analyses in mid-June suggested the bottom might be near (e.g., around $53,600 based on realized price, or a potential end during the 2026 World Cup summer), further price drops quickly disproved these optimistic forecasts. Key bear market indicators include: the severe de-pegging of MicroStrategy's preferred shares (STRC) from their $100 NAV, which later recovered partly due to company stabilization plans; a record number of BTC (over 10.83 million) and a significant portion of long-term ETH holders now in unrealized loss; and Bitcoin's price trading below its 200-week moving average. Predictions for the bear market's end vary. Some, like investor Yilihua, suggest July-August 2026 could present a final buying opportunity. Others, like miner Jiang Zhu'o'er, predict a bottom between $42,000-$44,000 in October-December 2026, based on the historical lag between MicroStrategy's mNAV ratio bottom and Bitcoin's price bottom. Technical indicators like the BTC 4-year average price index dipped briefly below 1, and the Coinbase Premium Index remains negative, suggesting a need for a price rebound to around $77,000 for a return to positive territory. In the absence of major external catalysts, the consensus leans toward the bear market persisting for another 2-3 months, with late September to early October 2026 being a potential turning point window.

Odaily星球日报Há 40m

How Far Are We from the End of the Crypto Bear Market?

Odaily星球日报Há 40m

Solana Ecosystem Shows Signs of Recovery: On-Chain Governance Upgrade, Tokenized Stocks and Meme Coins Heat Up

Solana Ecosystem Shows Signs of Revival: Governance Upgrades, Tokenized Stocks, and Memecoins Heat Up While the broader crypto market faces a downturn, Solana has shown relative strength with its price rising nearly 15% recently. This resilience is attributed to warming ecosystem activity, particularly in tokenized stocks and memecoins, coupled with a major upgrade to its on-chain governance. In the Real World Assets (RWA) sector, Solana now leads all public chains in both the number of unique holder wallets and the quantity of RWA assets. Its tokenized stock weekly trading volume has surged to a record $1.42 billion, capturing about 96% of the market share, largely driven by the Backpack exchange. Simultaneously, the Solana memecoin sector has reignited, fueled by the rapid ascent of the ANSEM token following endorsements from a prominent crypto influencer. This has boosted activity across platforms like Pump.fun and increased fee revenue for several Solana-based exchanges. A key development is the launch of Solana Governance Proposals (SGP), a new on-chain mechanism. It allows validators with at least 100,000 SOL delegated to submit proposals for community vote, enhancing decentralized decision-making. SGP will operate alongside the existing technical proposal process (SIMD), focusing on broader ecosystem governance. Despite these positive signals in specific areas, overall on-chain activity and transaction volumes still lag behind previous bull market peaks, indicating the recovery remains partial rather than ecosystem-wide.

marsbitHá 1h

Solana Ecosystem Shows Signs of Recovery: On-Chain Governance Upgrade, Tokenized Stocks and Meme Coins Heat Up

marsbitHá 1h

While Semiconductor Stocks Plunge, Anthropic Plans to Develop a 2nm Chip

Anthropic, the AI company behind Claude, is exploring the development of its own custom AI chip, according to a report from The Information. The company is in early discussions with Samsung Electronics to manufacture the chip using Samsung's most advanced 2-nanometer process and packaging technology. While the project is still in preliminary stages, including defining chip specifications, and could be abandoned, it marks a strategic step for Anthropic. The move comes as the company seeks greater control over its computing costs and hardware optimization, particularly for inference tasks to run its models more efficiently and cheaply. Samsung's potential involvement follows its participation as a strategic investor in Anthropic's recent $65 billion funding round. For Samsung, partnering with a major AI lab represents a significant opportunity for its foundry business to compete with market leader TSMC in advanced semiconductor manufacturing. Anthropic's CEO, Dario Amodei, has previously highlighted the immense financial challenge of securing enough computing power for anticipated growth, making cost-effective inference a critical focus. The company would join other tech giants like Google, Amazon, Microsoft, Meta, and OpenAI in pursuing custom AI silicon. However, analysts note this trend creates deeper interdependencies rather than independence, as US AI labs become more tightly woven into Asian semiconductor supply chains. Despite this move, Anthropic remains heavily reliant on a multi-cloud, multi-vendor strategy for its immediate computing needs. It has secured massive, long-term commitments for capacity from Amazon Web Services (Trainium chips), Google (TPUs), and even leased a large GPU cluster from xAI. For now, Nvidia continues to dominate the AI chip market, with its share reportedly growing to 74%.

链捕手Há 1h

While Semiconductor Stocks Plunge, Anthropic Plans to Develop a 2nm Chip

链捕手Há 1h

Korean Companies Following Strategy in Accumulating Cryptocurrency: From Bull Market to Delisting?

Title: Korean DAT Companies Following "Strategy" Bitcoin Hoarding Model Face Delisting Amid Bear Market Summary: Several Korean KOSDAQ-listed companies, known as Digital Asset Trusts (DATs), are at risk of being delisted due to a combination of stricter regulatory thresholds and a downturn in crypto markets. These firms, inspired by models like Strategy and Japan's Metaplanet, raised capital to buy Bitcoin, relying on a cycle of rising crypto prices to boost their stock value. However, recent reforms in Korea have raised the minimum market capitalization required to stay listed from 150 billion won to 200 billion won (approx. $1.3M), with a further increase to 300 billion won set for next January. The new rules also close loopholes like reverse stock splits used to artificially inflate share prices. The situation is exacerbated by a significant drop in Bitcoin's price from its 2025 peak and a weak KOSDAQ market. While the main KOSPI index has surged nearly 95% year-to-date, KOSDAQ has fallen about 10%, draining liquidity from smaller companies. Many DATs now hover near or below the new market cap thresholds and must also book substantial valuation losses on their Bitcoin holdings. Analysts suggest that without a sustained recovery in both crypto prices and broader market interest in KOSDAQ stocks, these companies have limited options to avoid delisting, marking a precarious moment for Korea's crypto-linked public companies.

marsbitHá 1h

Korean Companies Following Strategy in Accumulating Cryptocurrency: From Bull Market to Delisting?

marsbitHá 1h

Trading

Spot
活动图片