

Zoye
Há 10h
Will Bitcoin See Key Resistance Break? Notably, B
Will Bitcoin See Key Resistance Break?
Notably, Bitcoin’s daily chart shows price recovering from the recent lows near $80,559, with the rebound now testing the 0.382 Fibonacci level at $94,243, which acts as the first significant resistance in this recovery phase.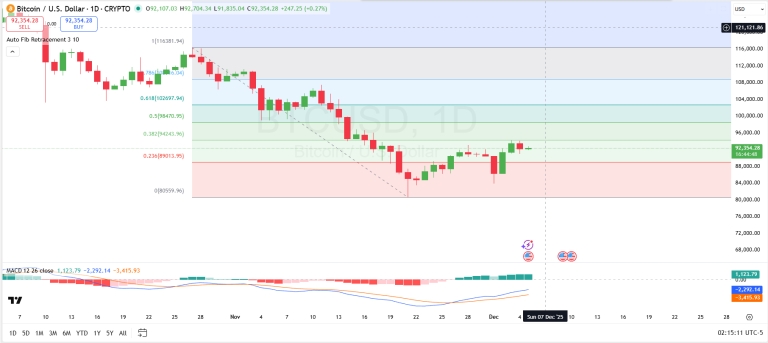
The 0.236 Fib level at $89,013 has established itself as a reliable support zone, as BTC continues to print higher lows above this region. A daily close above $94,243 would strengthen bullish momentum and open the path toward the 0.5 Fib level at $98,470, while stronger resistance lies at the 0.618 level at $102,697, a key area where sellers may attempt to regain control.
The MACD indicator reinforces the improving sentiment, showing a bullish crossover already formed as the MACD line climbs back towards positive territory. Increasing green histogram bars indicate fading bearish momentum and strengthening buyer interest after weeks of downward pressure. This shift suggests that traders are gradually rotating back into long exposure, especially as price stabilizes above short-term support.
If Bitcoin maintains support above $89,000, the next targets become $94,200, $98,400, and $102,700, aligned with the Fibonacci ladder. However, if bulls fail to hold the 0.236 level, BTC risks slipping back toward $85,000, with deeper support near $80,500, the origin of the recent bounce.
Todos os comentários0Mais recentePopular
Sem registos