Middle East Conflict Rekindles Rate Hike Expectations, Gold Suffers Worst Sell-off in 43 Years

marsbitPublished on 2026-03-23Last updated on 2026-03-23

Abstract

Gold suffered its worst weekly decline in 43 years, with spot prices falling for eight consecutive sessions—the longest losing streak since October 2023. Silver also plunged over 15%, while platinum and palladium followed lower. The sell-off was triggered by escalating Middle East conflicts, which drove up oil prices and reinforced expectations of Federal Reserve rate hikes rather than cuts. Market bets on a Fed hike by October rose to 50%, reducing the appeal of non-yielding gold amid higher real rate prospects. Technical indicators worsened, with RSI falling below 30, triggering stop-losses and self-reinforcing selling. Gold ETFs saw outflows for three straight weeks, losing over 60 tons. The situation echoes the 1983 crash when OPEC nations sold gold reserves to raise cash amid an oil price collapse. Despite a 4% year-to-date gain, macro conditions have deteriorated. Rising energy prices may reduce global GDP by 0.3% and lift inflation by 0.5-0.6%, increasing stagflation risks. Gold’s future trajectory hinges on real rates and geopolitical developments—further rate hike expectations could sustain pressure, while any de-escalation may revive safe-haven demand.

Gold recorded its worst weekly decline in 43 years this week, with historical echoes sending chills through the market.

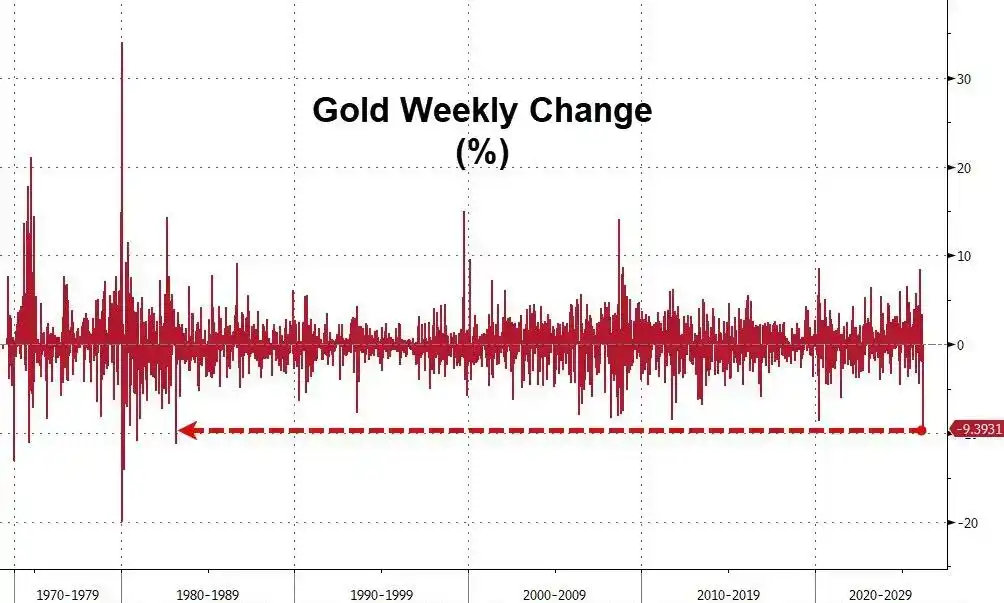
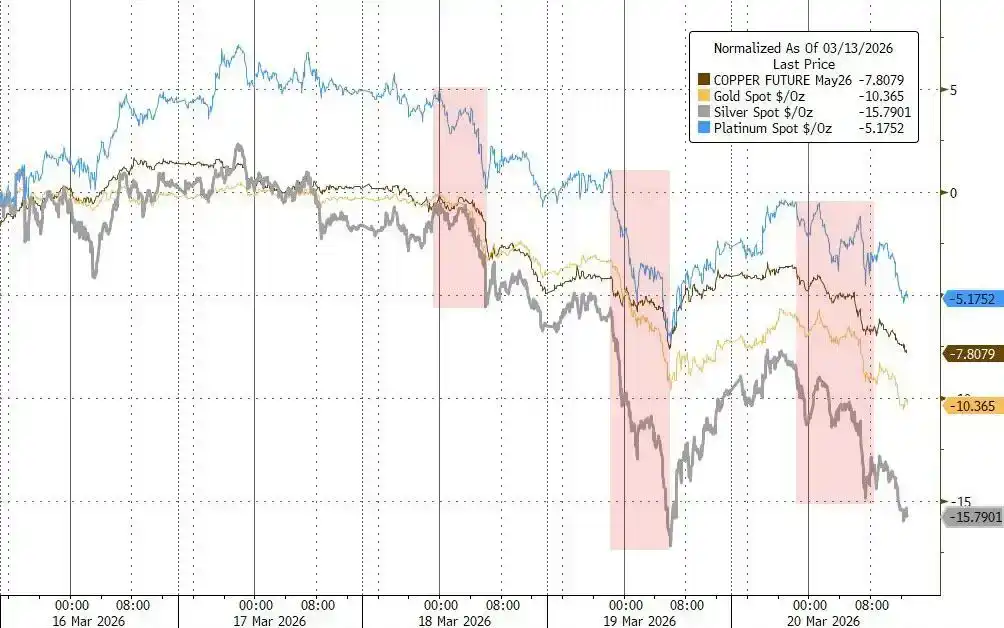
This week, gold posted its largest weekly drop since March 1983, with the spot price falling for eight consecutive days, marking the longest losing streak since October 2023. Meanwhile, silver fell more than 15% this week, with palladium and platinum also moving lower.
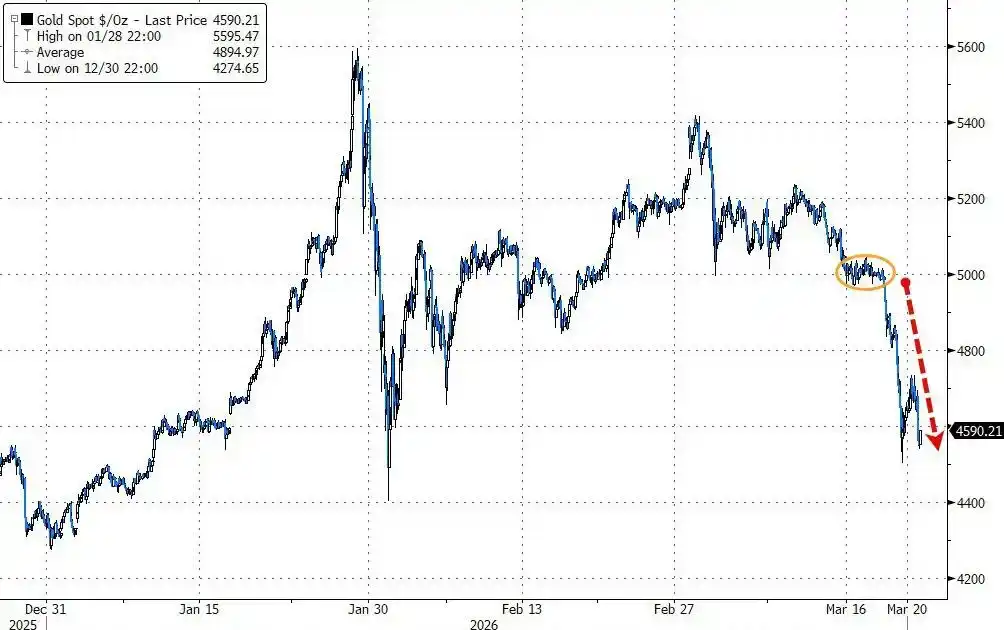
The trigger for this sharp decline was the escalating Middle East conflict, which pushed up energy prices and, in turn, suppressed expectations for interest rate cuts. Market bets on a Federal Reserve rate hike have risen to 50%, fueling this wave of selling in precious metals.

More alarmingly for the market, the current situation bears a striking resemblance to the historic crash in March 1983, which was triggered by massive gold sales by Middle Eastern oil producers—back then, OPEC members, facing plummeting oil revenues, were forced to sell their gold reserves for cash, causing the gold price to plunge over a hundred dollars in a matter of days.

It is worth noting that, according to historical data, this week's decline in gold is the most severe since that "sell-gold-for-cash" storm 43 years ago.
Rate Cut Expectations Unravel, Gold's Safe-Haven Logic Fails

Since the US and Israel launched attacks on Iran last month, gold has been declining for several weeks, a stark contrast to its traditional role as a "safe-haven asset."

The reason is that the war brings not expectations of easing but inflationary pressures. Currently, the market's prediction of the Fed's policy path has undergone a fundamental reversal.

Traders are now pricing in a 50% probability of a Fed rate hike by October. Soaring energy prices are boosting inflation expectations, and gold, as a non-yielding asset, becomes significantly less attractive in an environment of rising real interest rates.

At the same time, there are signs of tightening US dollar liquidity. Cross-currency basis swaps began to widen noticeably this week, indicating a degree of dollar funding pressure.

This phenomenon may explain the deeper logic behind the gold sell-off—when dollar liquidity tightens, gold is often one of the first assets investors liquidate.

It is noteworthy that the most severe declines in the metals market this week were concentrated during Asian and European trading hours, consistent with the pattern of dollar shortage pressures first appearing in offshore markets.
Technical Stop-Losses Triggered, Selling Becomes Self-Reinforcing

Amid the sustained decline, gold's technical indicators have deteriorated significantly, with the 14-day Relative Strength Index (RSI) falling below 30, entering a zone some traders consider oversold.

Rhona O'Connell, an analyst at StoneX Financial, pointed out that this gold correction is the result of profit-taking and liquidity liquidation. She stated that the price above $5,200 had attracted substantial buying, making the market积累相当的回调脆弱性 (accumulated considerable vulnerability to a correction).

Once prices started to fall, a large number of investors' stop-loss orders were automatically triggered, rapidly forming a self-reinforcing spiral of selling. Technical signals like moving averages further exacerbated the downward pressure.

Meanwhile, passive selling triggered by falling stock markets also spilled over into gold.

O'Connell noted that forced liquidations related to equity assets may have dragged down gold prices, while slowing central bank gold purchases and continued outflows from gold ETFs further dampened market sentiment. According to Bloomberg data, gold ETFs have seen net outflows for three consecutive weeks, with combined holdings dropping by more than 60 tonnes over those three weeks.

The Ghost of the 1983 Middle East "Sell-Gold-for-Cash"

The current situation reminds market participants of the oil crisis-induced gold crash 43 years ago.

Historical data shows that around February 21, 1983, British and Norwegian oil producers led price cuts, putting pressure on OPEC to follow suit, abruptly intensifying the global oil market's oversupply. Facing a sharp contraction in oil revenues, Middle Eastern oil producers (mainly OPEC members) were forced to sell their gold reserves on a large scale to raise cash, triggering a gold price crash.

Reporting from The New York Times at the time corroborates this. According to a March 1, 1983, New York Times report, traders explicitly stated that sales by Middle Eastern oil producers were the direct trigger for the gold price plunge and warned that if oil revenues fell further, these Arab countries might sell more gold. At that time, the gold price plunged more than $105 from its high in less than a week, with the largest single-day drop reaching $42.50, the worst in nearly three years.
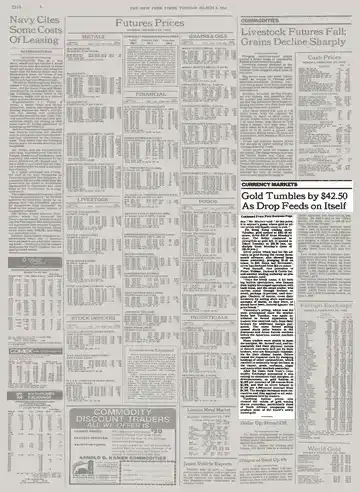
According to the New York Times report at the time, the proceeds from the Middle Eastern sales immediately flowed into Eurodollars and other short-term investment vehicles, causing short-term interest rates to soften, which in turn sent a warning signal to the global gold market. Since February 21 coincided with the US Presidents' Day holiday, with New York markets closed, the full impact wasn't felt until the following week, subsequently triggering chain-reaction forced liquidations that also affected commodity markets like copper, grains, soybeans, and sugar.

ZeroHedge pointed out that the 1983 gold crash marked the entry of the oil market into a bear market cycle that lasted for years—OPEC discipline frayed, market share was continuously lost, and oil prices remained under pressure throughout the 1980s.

Stagflation Clouds Loom, Can Gold Prices Stabilize?

Despite this week's heavy losses, gold is still up about 4% year-to-date. The price hit a record high of nearly $5,600 per ounce in late January, supported then by investor enthusiasm, central bank buying sprees, and market concerns about Trump interfering with Fed independence.

However, the current macroeconomic environment has significantly deteriorated. According to a Bloomberg report, Goldman Sachs economist Joseph Briggs expects that rising energy prices will drag global GDP down by 0.3 percentage points over the next year and push overall inflation up by 0.5 to 0.6 percentage points. Rising stagflation risks are severely compressing central banks' policy space.

Goldman Sachs analyst Chris Hussey noted that the blockade of the Strait of Hormuz has entered its fourth week, and hopes for a quick resolution of the conflict are fading. If the conflict continues, the longer oil prices remain high, the harder it becomes for the "look-through the short-term pain" narrative in stock and bond markets to hold, and the vulnerability of global assets will be further exposed.

For gold, the path of real interest rates will be a key variable. If the conflict drags on, inflation expectations continue to heat up, and the Fed's rate hike path becomes clearer, pressure on gold may persist; whereas, once signals of a easing in geopolitical tensions emerge, whether suppressed safe-haven demand can be released again remains the market's biggest悬念 (suspense).

Related Questions

QWhat was the sharpest weekly decline in gold prices since 1983 triggered by?

AThe sharpest weekly decline in gold prices since 1983 was triggered by escalating Middle East conflicts, which raised energy prices and suppressed expectations for interest rate cuts, leading to increased bets on Federal Reserve rate hikes.

QHow does the current gold market situation parallel the historical event of 1983?

AThe current situation parallels the 1983 event where OPEC members, facing a sharp drop in oil revenue, were forced to sell off their gold reserves to raise cash, causing a historic crash in gold prices.

QWhy did the traditional 'safe-haven' logic for gold fail during the recent Middle East tensions?

AThe traditional safe-haven logic failed because the war brought inflationary pressure instead of expectations for monetary easing. Rising energy prices increased inflation expectations, making gold, a non-yielding asset, less attractive as real rates rose.

QWhat technical indicator signaled that gold had entered oversold territory during the sell-off?

AThe 14-day Relative Strength Index (RSI) fell below 30, which is a level some traders consider to indicate an oversold market.

QAccording to Goldman Sachs analysis, what is the expected economic impact of rising energy prices?

AGoldman Sachs economists estimated that rising energy prices would reduce global GDP by 0.3 percentage points over the next year and raise overall inflation by 0.5 to 0.6 percentage points, increasing stagflation risks.

Related Reads

Weekly Editor's Picks (0725-0731)

Weekly Editor's Picks (0725-0731) provides a curated selection of deep analysis, filtering out market noise. Key themes from this week include: **Macro & Policy:** The Federal Reserve's upcoming meeting is marked by high uncertainty, balancing cooling inflation data against persistent price pressures. Meanwhile, the U.S. crypto regulatory Clarity Act faces critical political hurdles, with its 2026 passage probability seen as low. **Investing & Crypto:** Analysis suggests long-term crypto success depends on conviction through volatile cycles, focusing on assets like Bitcoin and core smart contract platforms. A trend noted is the increasing similarity between global equity markets (especially tech) and crypto, driven by narrative and leverage. Several major crypto protocols show strong revenue growth, but this isn't always translating to token price appreciation due to sell pressure and structural factors. **AI & Semiconductors:** Nvidia's rising credit default swap rates signal market concern over AI infrastructure financing risks. The storage sector experienced volatility as markets began pricing in potential 2027 oversupply. Despite a record profitable quarter, SK Hynix's results were deemed "below expectations," reflecting heightened investor demands for future growth visibility. **Markets & DeFi:** TradeXYZ demonstrated remarkable accuracy in pre-market pricing for a major A股 listing. The token ONDO saw gains, linked to its growing role in the on-chain tokenized stock ecosystem. **Ethereum:** Post-Pectra upgrade, a major structural shift is underway as Lido begins migrating millions of ETH to new validator architectures designed for capital efficiency. **Also Highlighted:** Butian's bullish stock market move; OpenAI's Altman promising major advances; Samsung and SK Hynix securing large AI chip deals; Apple reaching a $5T market cap; and ongoing discussions around exchange security following Poolin's bankruptcy case.

marsbit27m ago

Weekly Editor's Picks (0725-0731)

marsbit27m ago

Low Investment Isn't Apple's Immunity Pass

While Meta and Google face investor scrutiny over ballooning AI capital expenditures, Apple's minimal AI investment has paradoxically become a strength. Its market cap recently reclaimed the global top spot, surpassing $5 trillion. The irony is deep: Apple's own AI efforts have lagged, with "Apple Intelligence" delayed and core talent lost, forcing reliance on partners like Google Gemini and Alibaba's Qianwen. Its Q3 FY2026 (Q2 CY) earnings initially seemed stellar. Revenue hit $109.4B (up 16% YoY), with iPhone and Mac sales, growing 22% and 29% respectively, driving most of the growth. However, the stock fell over 8% post-earnings. The primary concern was a weaker Q4 revenue growth forecast of 9-11%, below expectations, due to looming supply chain constraints. Apple is feeling the indirect cost of the AI boom. Soaring memory and chip prices, fueled by massive data center investments from Microsoft, Amazon, and others, are forcing Apple to raise Mac and iPad prices significantly. The upcoming iPhone launch is also expected to see substantial price hikes. Despite avoiding heavy AI infrastructure spending—its capital expenditures are actually down 28%—Apple cannot escape the industry-wide supply and cost pressures. While Apple's operating cash flow remains robust, its substantial R&D spending (up 32% YoY) has yet to yield major AI breakthroughs. As Tim Cook prepares to step down as CEO, Apple faces a challenging transition: balancing its premium hardware success against the strategic and cost pressures of the AI era it has so far cautiously navigated.

marsbit1h ago

Low Investment Isn't Apple's Immunity Pass

marsbit1h ago

PA Graphics Explanation | One Chart to Understand the Major Web3 Events in August 2026

**PANews Crypto Calendar: Key Web3 Events in August 2026** PANews introduces its revamped crypto calendar, featuring comprehensive coverage, flexible filtering, and easy export options. The market in August will be shaped by multiple key events across macroeconomics, regulation, tokenomics, and project developments: * **Macro & Policy:** Key US economic data releases (July Non-Farm Payrolls, CPI), the Federal Reserve meeting minutes, and the Jackson Hole Economic Symposium will be in focus. On the regulatory front, the US Senate plans to release a new draft of the *CLARITY Act*, while the EU's expanded crypto ban against Belarus comes into effect. * **Token Unlocks:** Significant token unlocks are scheduled for assets including ENA, AVAX, CONX, ZRO, and KAITO, which may influence market volatility. * **Project Updates & Shutdowns:** Several services, including Exchange Art, Ctrl Wallet, Zapper, NFTfi, and Summer.fi, are set to cease operations or undergo major adjustments. Users are advised to manage their assets accordingly. * **Corporate Activity:** Q2 earnings reports from companies like SpaceX, Circle, and Nvidia are due. Unitree Robotics will initiate its IPO subscription on the STAR Market, and Moonshot AI plans to begin a Pre-IPO financing round. * **Industry Events:** Major conferences such as Bitcoin Asia 2026 and the 2026 Digital Expo will take place. The overarching market narrative for August will revolve around macroeconomic expectations, regulatory developments, token unlock schedules, and ongoing industry consolidation.

marsbit1h ago

PA Graphics Explanation | One Chart to Understand the Major Web3 Events in August 2026

marsbit1h ago

Wall Street's Most Famous 'Cassandra' Now Has His Sights Set on Nvidia

Michael Burry, the famed "Big Short" investor, has once again captured Wall Street's attention with a series of short positions against major tech and semiconductor stocks, most notably Nvidia. In late June and July, through his "Cassandra Unchained" newsletter, Burry disclosed short bets against Nvidia, Tesla, Applied Materials, Caterpillar, the SOXX semiconductor ETF, and later, Micron Technology. His core thesis revolves around potential distortions in the AI infrastructure boom, specifically questioning whether extended depreciation schedules (e.g., 6 years vs. a realistic 2-3 years for AI chips) by cloud giants like Microsoft and Google artificially inflate profits. He also raises concerns about possible "off-balance-sheet circular financing," where chip demand might be propped up by vendor-backed funding to clients. Nvidia's stock experienced volatility following these disclosures, briefly dipping but largely holding near Burry's reported entry points, leaving his positions roughly flat or slightly underwater as of late July. This move is part of a pattern for Burry, whose track record since his legendary 2008 bet is mixed. He has faced notable losses, such as on Tesla in 2021, while scoring on broader market turns like the 2020 pandemic crash. His methodology focuses intensely on free cash flow and scrutinizing original financial documents to spot overvaluation and structural risks, but it often struggles with timing the market. The article contrasts Burry's stance with other prominent investors. Steve Eisman, another "Big Short" figure, is not shorting Nvidia, citing strong fundamentals but expressing nervousness about sustainability. Jim Chanos agrees with the broad "accounting mismatch" concern—comparing it to the dot-com bubble—but targets financial leverage in private equity firms rather than the chip stocks themselves. While Nvidia's short interest remains relatively low at 1.3-1.4% of float, the massive stock size means absolute short losses have been significant, exceeding $5 billion earlier this year. The piece concludes that for ordinary investors, the key takeaway is not replicating specific short bets but learning from the critical frameworks these investors use: questioning rosy accounting, identifying structural vulnerabilities, and maintaining skepticism during market euphoria, even if pinpointing the exact catalyst for a downturn remains elusive.

marsbit1h ago

Wall Street's Most Famous 'Cassandra' Now Has His Sights Set on Nvidia

marsbit1h ago

Trading

Spot
活动图片