Introducing: Taker-Flow-Based Gamma Exposure

insights.glassnodeОпубліковано о 2025-12-18Востаннє оновлено о 2025-12-18

Анотація

Introducing a flow-based approach to Gamma Exposure (GEX) tailored for crypto options markets. Unlike traditional equity markets, crypto options exhibit distinct participant behavior and trade motivations, making conventional GEX heuristics unreliable. By leveraging taker-level trade data from venues like Deribit, this methodology reconstructs dealer positioning by mirroring cumulative taker flows—strike by strike and maturity by maturity—rather than relying on static assumptions. The resulting GEX metric identifies zones where dealer hedging flows may either stabilize prices (positive gamma, causing "pinning") or amplify volatility (negative gamma, creating "slippery" zones). This framework provides a dynamic, realistic view of market structure, helping traders anticipate volatility regimes and key price levels in assets like BTC, ETH, and SOL.

In options markets, dealer hedging flows play a central role in shaping short-term price behavior. Gamma Exposure (GEX) is used to identify where those hedging flows are likely to stabilize price action and where they may amplify moves. While GEX is well established in equity and index options, applying it directly to crypto markets is problematic.

Crypto options differ materially in participant behavior, trade motivation, and data availability. To account for this, we reconstruct a flow-based GEX measure tailored to crypto options markets, designed to recover how dealer positioning evolves across strikes and maturities. We show how this framework can be used to interpret volatility regimes and identify price zones where dealer hedging may meaningfully influence market dynamics.

What is Gamma Exposure and Why it Matters

Gamma Exposure (GEX) measures how options market-makers’ hedging flows react to movements in the underlying asset.

Market makers, who typically maintain delta-neutral positions, must continuously hedge their gamma exposure by buying or selling futures or spot to offset the delta of the options they’ve sold or bought. When price moves, option deltas change (that is gamma), forcing dealers to rebalance. These rebalancing flows create structural feedback loops in the market and are a source of some of the most significant mechanically driven flows observed in the equity markets.

At the core of this dynamic, the taker is the end user — a trader or investor buying or selling options, while the dealer (or market-maker) is the counterparty providing liquidity. Their positions are mirror images of each other: when the taker buys a call, the dealer sells it.

Why is GEX useful?

  • At price levels with high positive gamma, dealers hedge in a way that tends to absorb price shocks. They typically buy on dips and sell on rallies, which dampens volatility and can keep price pinned near certain strikes: a phenomenon often described “gamma gravity” or “pinning”.
  • At price levels with high negative gamma, dealer hedging flows work in the opposite direction and amplify price moves. Dealers sell as prices fall and buy as prices rise, often increasing short-term volatility.

In short, GEX highlights where dealer hedging is likely to stabilize or destabilize the market, turning the options surface into a map of potential volatility regimes rather than a passive snapshot of positioning.

TradFi Origins: Gamma Exposure Calculation in Traditional Finance

Gamma exposure metrics originated in equity and index options markets (for example, SPX). The classic construction is:

Where:

  • OI is open interest at that strike
  • Γ is option gamma
  • S is the underlying spot price
  • sign_dealer is the assumed sign of the dealer position (long or short)

Because traditional equity datasets do not label who is the taker on a trade, this framework relies on a simple heuristic about who typically holds which side of the options market:

  • Call options are sold by investors and bought by dealers
  • Put options are bought by investors and sold by dealers

In the classic equity context, investors typically write calls for yield enhancement and use puts as downside insurance.

Why the Equity Heuristic Fails in Crypto

In crypto options, the equity-style assumptions break down. A large share of participants actively buy calls to speculate on upside, rather than systematically selling them for yield. Meanwhile, puts are frequently traded tactically rather than used purely as hedges for long-only portfolios. If we continue to assume “calls = investor short, dealer long” and “puts = investor long, dealer short,” we construct a dealer profile that does not reflect actual positioning.

There is a second, more subtle issue. The classical approach treats open interest at each strike as a single block position with one sign. In practice, a strike’s OI is built from both buying and selling flows. A simple case where 50% of OI came from takers buying (dealers short) and 50% from takers selling (dealers long), the net dealer exposure is close to zero — yet the heuristic would still report a large exposure. Instead, what we actually want is:

  • A realistic sign of dealer positioning (long vs short);
  • A realistic net size of that position after netting out opposing flows.

A Flow-First Approach to Gamma Exposure (GEX) in Crypto

Unlike traditional equity markets, crypto options venues expose who is the taker on each trade. For every transaction, we can observe whether the taker bought or sold a call or a put. We then make a clear modeling assumption: the maker on the other side of the trade is a dealer providing liquidity.

This allows us to treat the taker as the end user and infer dealer positioning as the mirror image of cumulative taker flow, strike by strike and maturity by maturity. Over time, this builds a realistic picture of how dealers are positioned across the volatility surface.

On this foundation, we build a methodology that tracks dealer inventory through time and translate that inventory into gamma exposure using option greeks and spot price. The result is a structural GEX measure anchored in actual trading flow, rather than static heuristics. A full description of this process is provided in the Appendix at the end.

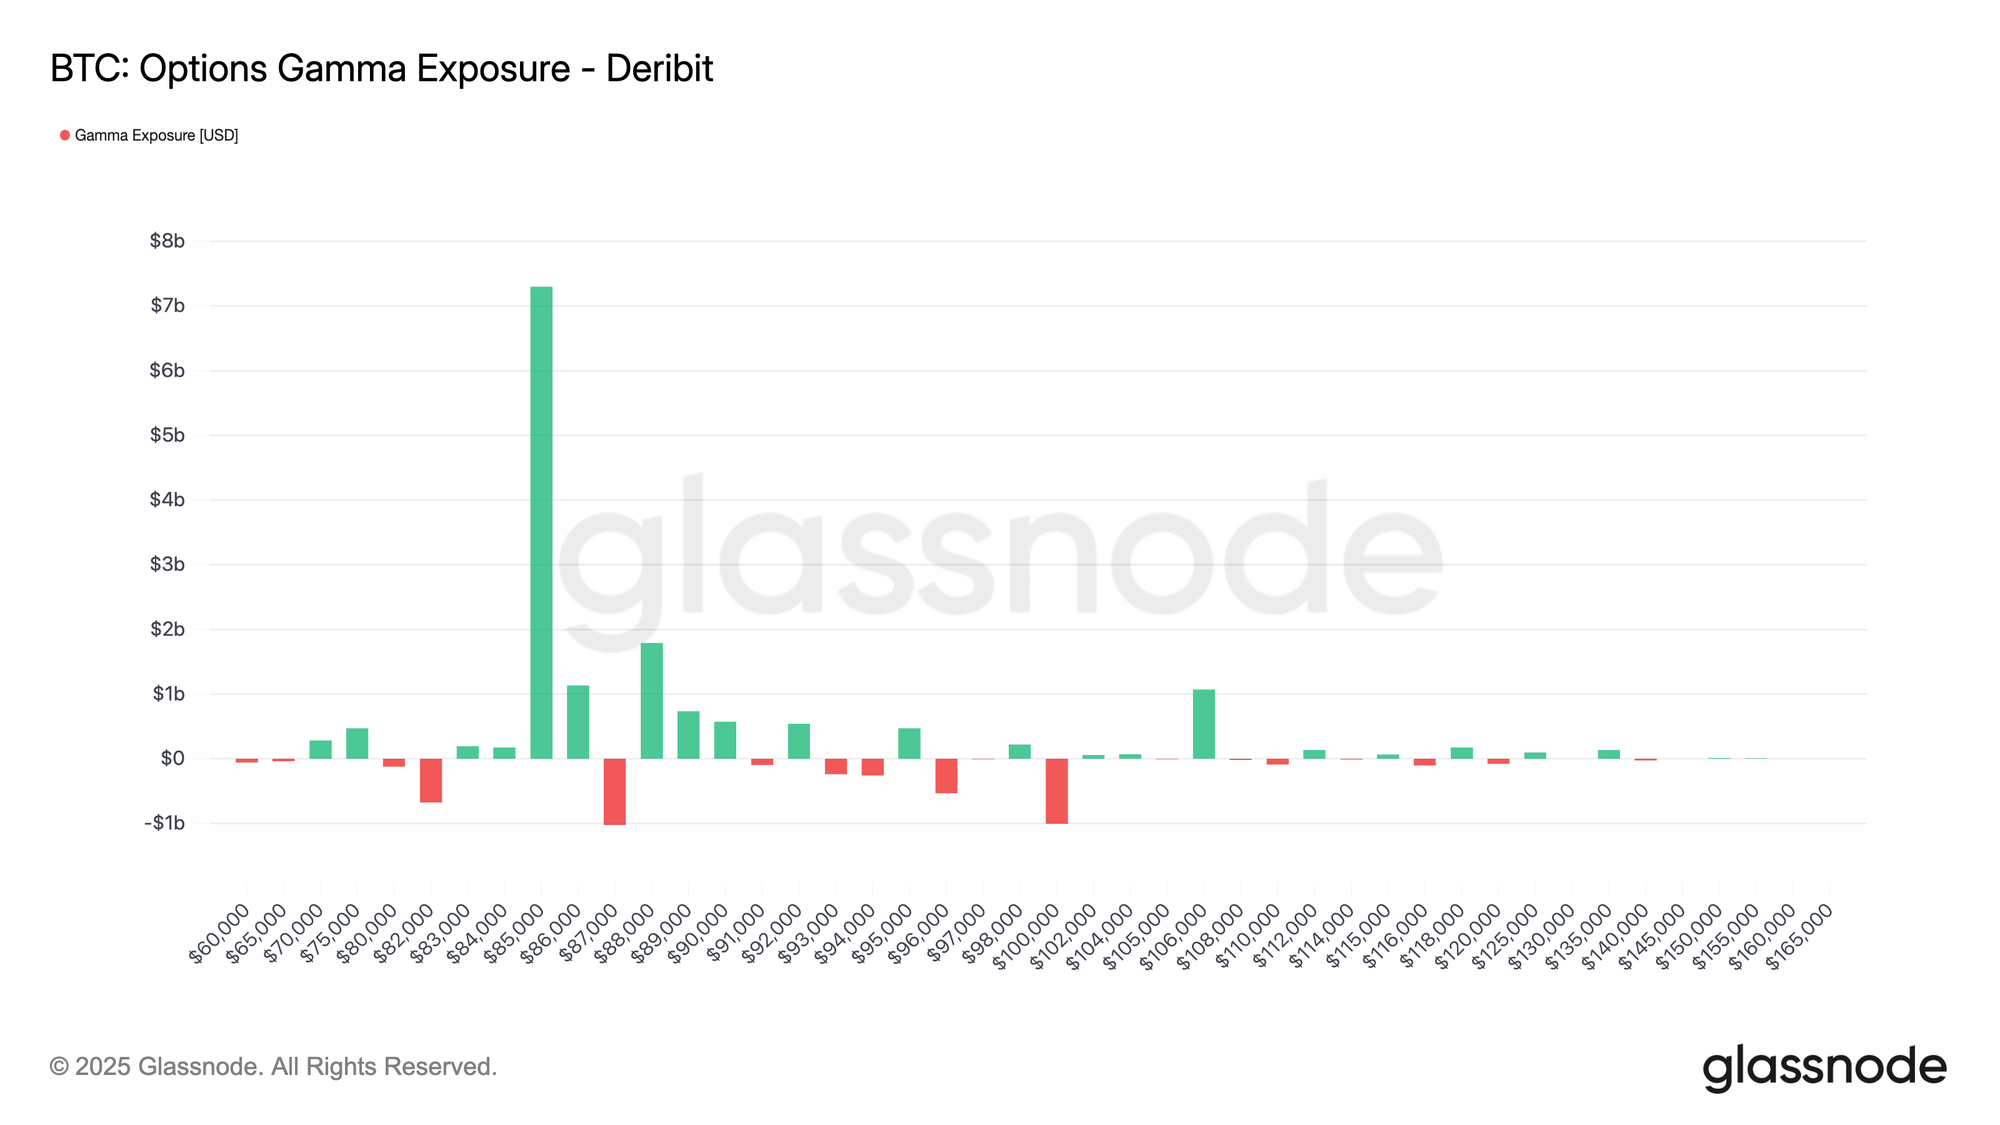
The chart below shows BTC options gamma exposure across strike prices on Deribit. Each bar represents the net gamma exposure (in USD) concentrated at that strike: green indicates positive exposure, red indicates negative exposure. The distribution shows a dominant positive gamma cluster around ~$86k–$87k, with smaller pockets of negative exposure around ~$83k and ~$101k.
View live chart

Metric Interpretation

Gamma exposure helps map where hedging flows may impact price action. Large positive GEX near ~$85k–$86k suggests a zone where dealer hedging is likely to be mean-reverting (buying dips and selling rallies), contributing to pinning or slower price movement around those strikes. By contrast, negative GEX pockets mark areas where hedging becomes momentum-reinforcing (selling into weakness / buying into strength), increasing the likelihood of faster, more directional moves if spot trades into them.

Available for:

  • Resolution: 10-minute
  • Assets: BTC, ETH, SOL, XRP, PAXG
  • Exchanges: Deribit

Trading Use-Cases: How to Use GEX in Practice

From a trading perspective, GEX turns the options surface into a map of where dealer flows are likely to amplify or dampen price moves.

Identifying “sticky” vs “slippery” price zones

  • High positive GEX near spot: When GEX is strongly positive around a band of strikes near spot, dealers are long gamma in that zone. As the market trades inside this band, their hedging flows tend to buy on dips and sell into rallies, which creates a pinning effect: moves fade, breakouts struggle, and realized volatility often comes in below implied. This is typically a mean-reverting, “sticky” regime, where short-gamma carry trades can work if volatility indeed remains contained.
  • High negative GEX near or below spot: When GEX is strongly negative around or just below spot, the opposite holds: dealers are short gamma, so as spot trades into that region, hedging flows sell into weakness and buy into strength. Instead of dampening moves, they amplify them. Price action becomes more “slippery”: intraday swings can expand, order books can feel thinner, and liquidations or squeezes become more likely. In that environment, traders often respond with lower leverage, wider stops, and more respect for momentum.

Watching for gamma flips

A particularly important dynamic is the gamma flip, when net GEX around spot changes sign. For example, if price exits a positive-gamma zone and moves into a pocket of negative gamma below, the market can transition from a pinned, mean-reverting regime to one where moves begin to reinforce themselves.


Appendix – Our Methodology: Taker-Flow-Based GEX

We construct Gamma Exposure on a 10-minute grid per asset, exchange, strike K, maturity M. The key idea is to reconstruct the dealer inventory over time from taker flows, and then translate that inventory into gamma exposure using option greeks.

We define the net taker flow in contracts over each 10-minute interval:

Under the assumption that dealers are primarily on the passive side, the dealer flow is simply the mirror image of taker flow:

We then cumulate these flows over time to obtain a dealer inventory in number of contracts. For calls, this is:

and analogously for puts:

Here Δt is the 10-minute step. Positive inventory values correspond to dealers being net long contracts at that strike and maturity; negative values correspond to net short.

To translate this inventory into gamma exposure, we combine it with option greeks and the underlying price. Let m denote the contract multiplier (e.g. BTC per contract), and S the spot price at time t. For each bucket we define the notional exposure:

Using the option gammas Γcall(K,M,t) and Γput(K,M,t) from our options chain, the gamma exposure of each leg is:


Γcall(K,M,t) is the gamma of the call option at that strike and maturity. This tells you how quickly the option’s delta changes when the underlying price moves.

And then total gamma exposure at that strike/maturity is just:

Трендові криптовалюти

Пов'язані питання

QWhat is Gamma Exposure (GEX) and why is it important in options markets?

AGamma Exposure (GEX) measures how options market-makers' hedging flows react to movements in the underlying asset. It is important because dealer hedging flows can either dampen or amplify price volatility. High positive GEX stabilizes prices (buying dips, selling rallies), while high negative GEX amplifies moves (selling into weakness, buying into strength), making it a key tool for understanding short-term market dynamics.

QWhy does the traditional equity-based GEX calculation fail in crypto options markets?

AThe equity heuristic fails in crypto because participant behavior differs significantly. In crypto, many traders actively buy calls for speculation (rather than selling for yield) and trade puts tactically (not just as portfolio hedges). Additionally, the classic method treats open interest as a single block, ignoring mixed flows that net to zero, whereas crypto data allows for precise flow-based positioning.

QHow does the taker-flow-based approach to GEX work in crypto options?

AThe taker-flow-based approach uses trade-level data from crypto exchanges to identify the taker (end user) in each transaction, assuming the maker is a dealer. By mirroring cumulative taker flows strike-by-strike and maturity-by-maturity, it builds an accurate dealer inventory. This inventory is then combined with option greeks and spot price to compute gamma exposure, resulting in a dynamic, flow-anchored measure rather than a static heuristic.

QWhat are the practical trading use-cases of Gamma Exposure (GEX)?

AGEX helps identify 'sticky' zones (high positive GEX) where dealer hedging dampens volatility and pins price, and 'slippery' zones (high negative GEX) where hedging amplifies moves and increases volatility. It also alerts traders to gamma flips—transitions between regimes—which can signal shifts from mean-reverting to momentum-driven price action, informing leverage, stops, and volatility strategies.

QWhat data and assets are available for the taker-flow-based GEX metric described?

AThe metric is available at a 10-minute resolution for assets including BTC, ETH, SOL, XRP, and PAXG on the Deribit exchange. It provides net gamma exposure per strike, with positive (green) and negative (red) values indicating zones where dealer flows may stabilize or destabilize price action.

Пов'язані матеріали

Early Investor of Unitree Bets on a Brain-Computer Interface Company

"Wabo Technologies, a brain-computer interface (BCI) startup, has secured new funding from Vertex Ventures (under Temasek), Hongtai Fund, Chengdu Future Industry Fund, and Huifengda Capital. Vertex Ventures is known for its early bet on Unitree Robotics. Inspired by the sci-fi film "Avatar," founder Zhang Xingzhi has pursued human-machine interaction for over a decade. He established Wabo in late 2025, coinciding with China's push for BCI as a future industry. Unlike companies focused solely on medical hardware, Wabo positions itself as a model company. Its core mission is to develop a "Human Neural Intent Model" that decodes EEG, EMG, and behavioral signals to understand a user's goals, confirmations, corrections, and stop intentions before physical action, translating them into standardized control signals for machines, robots, or smart devices. The young, full-stack team, backed by academic collaborators from Tianjin University and Fudan University, quickly attracted investors. The company had previously raised a seed round from Ceyuan Capital. Investors were impressed by Wabo's systematic capabilities in data collection, signal processing, and engineering, seeing potential beyond a single hardware product toward a reusable layer of human intent interpretation. Applications span medical rehabilitation, smart homes, embodied AI, and even space exploration, with Wabo partnering with Tianjin University on pioneering "space BCI" research. Wabo plans a dual-headquarters strategy, with Shanghai focusing on high-end R&D and model development, and Chengdu handling hardware, product development, and supply chain. The BCI sector in China is heating up, with over 30 financing deals in early 2026. Zhang believes future competition will center on who can build a sustainable data-model-scenario loop. He predicts industry consolidation within three years, with only companies that master this闭环 surviving. The vision from "Avatar" is inching closer to reality."

marsbit8 хв тому

Early Investor of Unitree Bets on a Brain-Computer Interface Company

marsbit8 хв тому

ChangXin Technology: A Cyclical Stock Standing Atop the Cycle Peak

Changxin Technology: A Cyclical Stock at the Peak On July 27, 2026, Changxin Technology topped the A-share market with a market capitalization of 3.28 trillion yuan, surging 465% on its first trading day. The company, which lost 16.3 billion yuan in 2023, reported an estimated net profit of 50-57 billion yuan for the first half of 2026. Its dramatic reversal mirrors the volatile DRAM (Dynamic Random Access Memory) cycle. The DRAM industry is inherently cyclical, with booms and busts every 3-4 years. This is due to product standardization and a significant time lag in supply adjustment. When prices rise, manufacturers expand capacity, but new production takes 2-3 years to come online, often leading to oversupply and price crashes when demand cools. Changxin's performance perfectly tracks this cycle. It recorded deep losses in 2023-2024 during the industry downturn, turned its first annual profit in 2025, and saw profits skyrocket in Q1 2026. This surge is primarily price-driven. The AI boom has led major players like Samsung and SK Hynix to shift 70-80% of new capacity to high-margin HBM (High Bandwidth Memory), creating a severe shortage and price explosion in general-purpose DRAM markets where Changxin competes. However, a massive global capacity expansion is underway. The top three manufacturers have announced nearly $70 billion in capital expenditure for 2026. Changxin itself plans to expand from three to seven 12-inch wafer fabs. This investment will translate into significant new supply in 2-3 years. While DRAM prices are expected to remain high through 2026-2027, price growth is already slowing, and a potential downturn is forecast for around 2028 as new capacity ramps up. A key challenge for Changxin is catching up in the critical HBM segment. While it has delivered HBM3 samples, leaders are already mass-producing more advanced HBM3E. Success in HBM is crucial for gaining true cyclical resilience. In conclusion, Changxin is a commendable company that has broken foreign monopolies in DRAM. Its long-term growth narrative—driven by import substitution and AI—is valid. Yet, its current valuation of 5-6x forward P/E, typical for a cyclical stock at its peak, suggests much future growth is already priced in. AI may extend the current cycle but cannot eliminate the industry's inherent volatility. For investors, the critical question is preparedness for the inevitable downturn when the cycle turns.

marsbit13 хв тому

ChangXin Technology: A Cyclical Stock Standing Atop the Cycle Peak

marsbit13 хв тому

What If the CLARITY Act Ultimately Fails to Pass?

This article examines the potential consequences if the CLARITY Act, a major US crypto market structure bill, fails to pass in the Senate. Having cleared the House in July 2025 and a key committee in May 2026, the bill's passage into law this year is now considered uncertain, with prediction markets showing its probability dropping from 82% in February to 35%. The article analyzes three main areas of impact should the bill fail. First, for the crypto market, analysts believe a negative reaction is limited and partially priced in already, with Bitcoin's recent weakness attributed more to macro factors. The specific details of the failed bill would matter more than its failure alone. Second, for US stocks, Coinbase (COIN) could see short-term pressure, with analysts citing a potential drop to the $140-$160 range, though its long-term thesis is not solely tied to the bill. For Circle, failure might be neutral or even positive long-term, as a passed bill could invite more stablecoin competition. Bitcoin-treasury firms like Strategy (MSTR) are seen as more directly tied to Bitcoin's price than the legislation. Third, in Washington, the failure is framed within a broader political struggle. Democratic resistance is partly linked to concerns over former President Trump's crypto holdings, making the bill a political tool. If it fails in 2026, the industry would likely rely on existing frameworks like the GENIUS Act and agency-level rules. Missing the August window likely pushes any significant progress to 2027, a period of political reshuffling after midterm elections, making consensus harder to achieve.

Odaily星球日报1 год тому

What If the CLARITY Act Ultimately Fails to Pass?

Odaily星球日报1 год тому

SK Hynix Q2 Profit Soars Sixfold, Still 'Misses Expectations'; Secures Long-Term Agreements with 10 Clients, HBM4 to Accelerate Volume Ramp in Second Half

SK Hynix reported record-breaking Q2 2026 financial results, with operating profit soaring 557% year-over-year to 60.5 trillion won and revenue increasing 257% to 79.3 trillion won, driven by strong demand for AI server memory, HBM, and enterprise SSDs. The operating profit margin reached 76.3%. However, both figures fell short of analyst expectations, leading to a drop in its share price. The company attributed the earnings miss to three factors: a high sales mix of HBM, which limited upside from surging prices of general-purpose DRAM; a deceleration in memory price increases compared to Q1; and long-term supply agreements (LTAs) with major customers that lock in prices, reducing sensitivity to spot market gains. SK Hynix has signed LTAs with about 10 clients, covering roughly half of its sales. Despite the miss, the company remains optimistic about AI-driven demand. Its net profit of 93.9 trillion won was significantly boosted by a one-time gain from the partial sale of its Kioxia stake. Financially, it strengthened its cash position, ending the quarter with a net cash position of 69.4 trillion won. Looking ahead, SK Hynix plans capital expenditures at the high end of its 40-50 trillion won range for 2026 to expand capacity for HBM and advanced NAND products, including accelerating the mass production of HBM4 in the second half of the year.

marsbit1 год тому

SK Hynix Q2 Profit Soars Sixfold, Still 'Misses Expectations'; Secures Long-Term Agreements with 10 Clients, HBM4 to Accelerate Volume Ramp in Second Half

marsbit1 год тому

Торгівля

Спот

Популярні статті

Як купити FLOW

Ласкаво просимо до HTX.com! Ми зробили покупку Flow (FLOW) простою та зручною. Дотримуйтесь нашої покрокової інструкції, щоб розпочати свою криптовалютну подорож.Крок 1: Створіть обліковий запис на HTXВикористовуйте свою електронну пошту або номер телефону, щоб зареєструвати обліковий запис на HTX безплатно. Пройдіть безпроблемну реєстрацію й отримайте доступ до всіх функцій.ЗареєструватисьКрок 2: Перейдіть до розділу Купити крипту і виберіть спосіб оплатиКредитна/дебетова картка: використовуйте вашу картку Visa або Mastercard, щоб миттєво купити Flow (FLOW).Баланс: використовуйте кошти з балансу вашого рахунку HTX для безперешкодної торгівлі.Треті особи: ми додали популярні способи оплати, такі як Google Pay та Apple Pay, щоб підвищити зручність.P2P: Торгуйте безпосередньо з іншими користувачами на HTX.Позабіржова торгівля (OTC): ми пропонуємо індивідуальні послуги та конкурентні обмінні курси для трейдерів.Крок 3: Зберігайте свої Flow (FLOW)Після придбання Flow (FLOW) збережіть його у своєму обліковому записі на HTX. Крім того, ви можете відправити його в інше місце за допомогою блокчейн-переказу або використовувати його для торгівлі іншими криптовалютами.Крок 4: Торгівля Flow (FLOW)Легко торгуйте Flow (FLOW) на спотовому ринку HTX. Просто увійдіть до свого облікового запису, виберіть торгову пару, укладайте угоди та спостерігайте за ними в режимі реального часу. Ми пропонуємо зручний досвід як для початківців, так і для досвідчених трейдерів.

299 переглядів усьогоОпубліковано 2024.12.10Оновлено 2026.06.02

Як купити FLOW

Обговорення

Ласкаво просимо до спільноти HTX. Тут ви можете бути в курсі останніх подій розвитку платформи та отримати доступ до професійної ринкової інформації. Нижче представлені думки користувачів щодо ціни FLOW (FLOW).

活动图片