State Street Investment Management maintained its year-end 2027 gold price target of $5000 per ounce in its July Monthly Gold Monitor, even as spot gold fell 11.7% in June and repeatedly tested support near $4000 per ounce.
This assessment does not imply gold is without downside risks. Silver fell 22.2% in June, Bitcoin dropped 20.4%, and US-listed gold ETFs saw net redemptions of approximately $5.3 billion for the month. The interest rate environment has also shifted unfavorably for gold; the US OIS curve is now pricing in about 1.5 rate hikes for 2026, whereas in February the market was betting on 2-3 rate cuts.
However, in the institution's view, the sharp decline has not altered the most important buying structure of recent years: central banks continue to increase purchases, fiscal and debt pressures continue to rise, and demand from China and the Asia-Pacific region continues to absorb some of the outflow from Western funds. Under the base case scenario, there remains a 70% probability that gold prices will rise to the $4750-$5500 range over the next 6-9 months. The probability of a more conservative consolidation scenario has been raised to 25%, corresponding to a $4000-$4750 range.
$4000 May Not Be the Bottom, Western Funds Continue to Retreat
$4000 is now more than just a psychological level. It is simultaneously being tested by technicals, ETF fund flows, and interest rate expectations.
Following June's steep drop in gold prices, US-listed gold ETFs experienced net redemptions of about $5.3 billion. After a record seasonal inflow of $11.5 billion in January-February, North American investors liquidated $18.7 billion over the past four months, indicating declining patience among Western capital with gold at elevated levels.
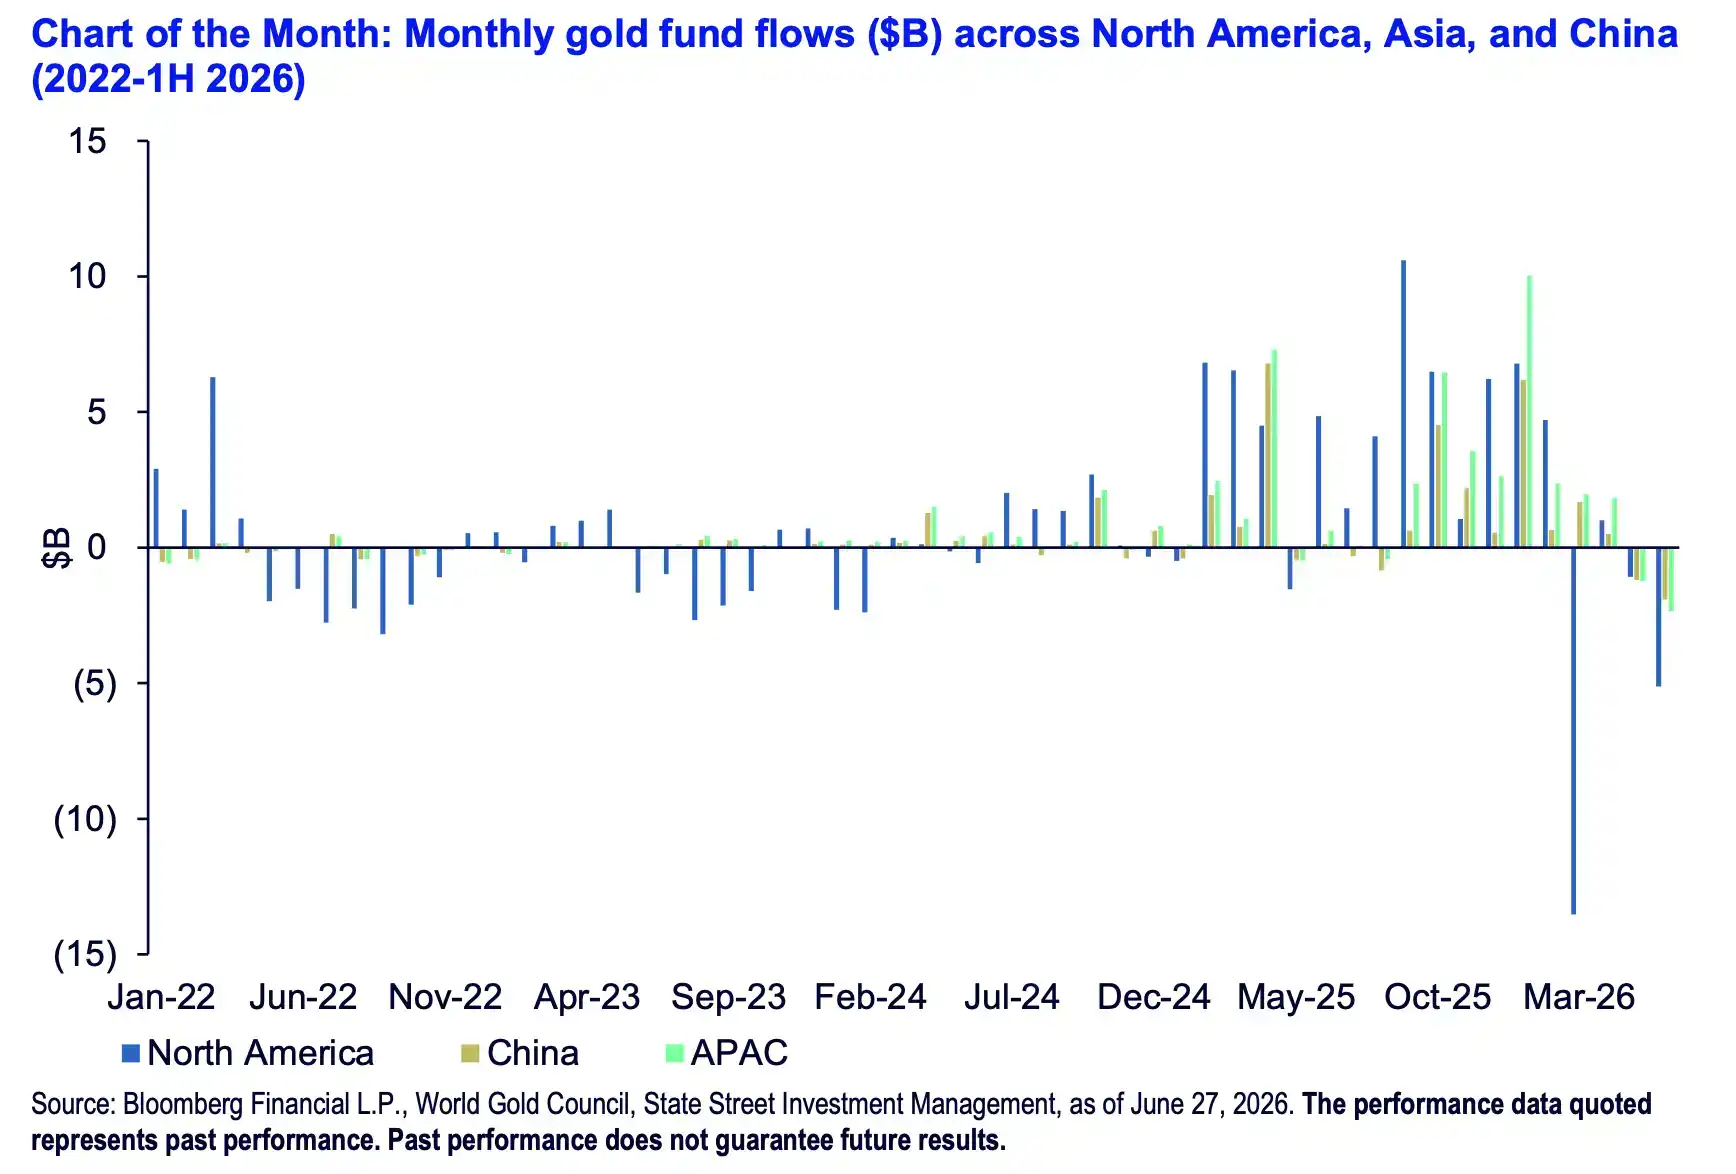
Monthly fund flows for North American, Asian, and Chinese gold funds; North America net outflow of $18.7bn over the past four months, China net inflow of $5.9bn year-to-date, Asia Pacific net purchases of approx. $12.6bn in the first half.
Interest rate pressure is more direct. Higher real yields and a stronger dollar increase the opportunity cost of holding gold. The report also notes that money market fund assets have risen to $7.9 trillion, making cash itself more attractive.
This is why State Street does not rule out near-term downside. It places strong support for gold prices in the $3750-$4000 range and raised the probability of a consolidation scenario between $4000-$4750 to 25%. US Bank technical analyst Paul Ciana recently also suggested that gold prices could still test support around $3600, but a pullback to lower levels may provide a window for phased buying by medium- to long-term investors.
Whether $5000 is Achievable Depends on Central Bank Purchases
The most stable buying support for gold bulls still comes from central banks.
World Gold Council data shows global central banks were net purchasers of 244 tonnes of gold in Q1 2026. State Street states that this scale represents a 17% increase quarter-on-quarter, a 3% increase year-on-year, and is 8% higher than the five-year quarterly average. It forecasts full-year 2026 central bank net purchases to be between 680-820 tonnes, with a baseline forecast of 765 tonnes. If realized, this would mark the 17th consecutive year of net purchases since the global financial crisis.
This type of demand may not push prices higher daily, but it provides more stable bottom-fishing support. Central bank gold buying is typically not short-term trading but reserve asset adjustment, aiming to reduce single reliance on the US dollar and US Treasuries and add an asset not dependent on issuer credit.
The World Gold Council's 2026 Central Bank Gold Reserves Survey reinforces this. Among surveyed central banks, 89% expect global gold reserves to increase over the next 12 months, 45% expect their own institution to increase holdings, 84% expect gold's share of total reserves to be higher in 5 years, and 74% expect the US dollar's reserve share to decline.
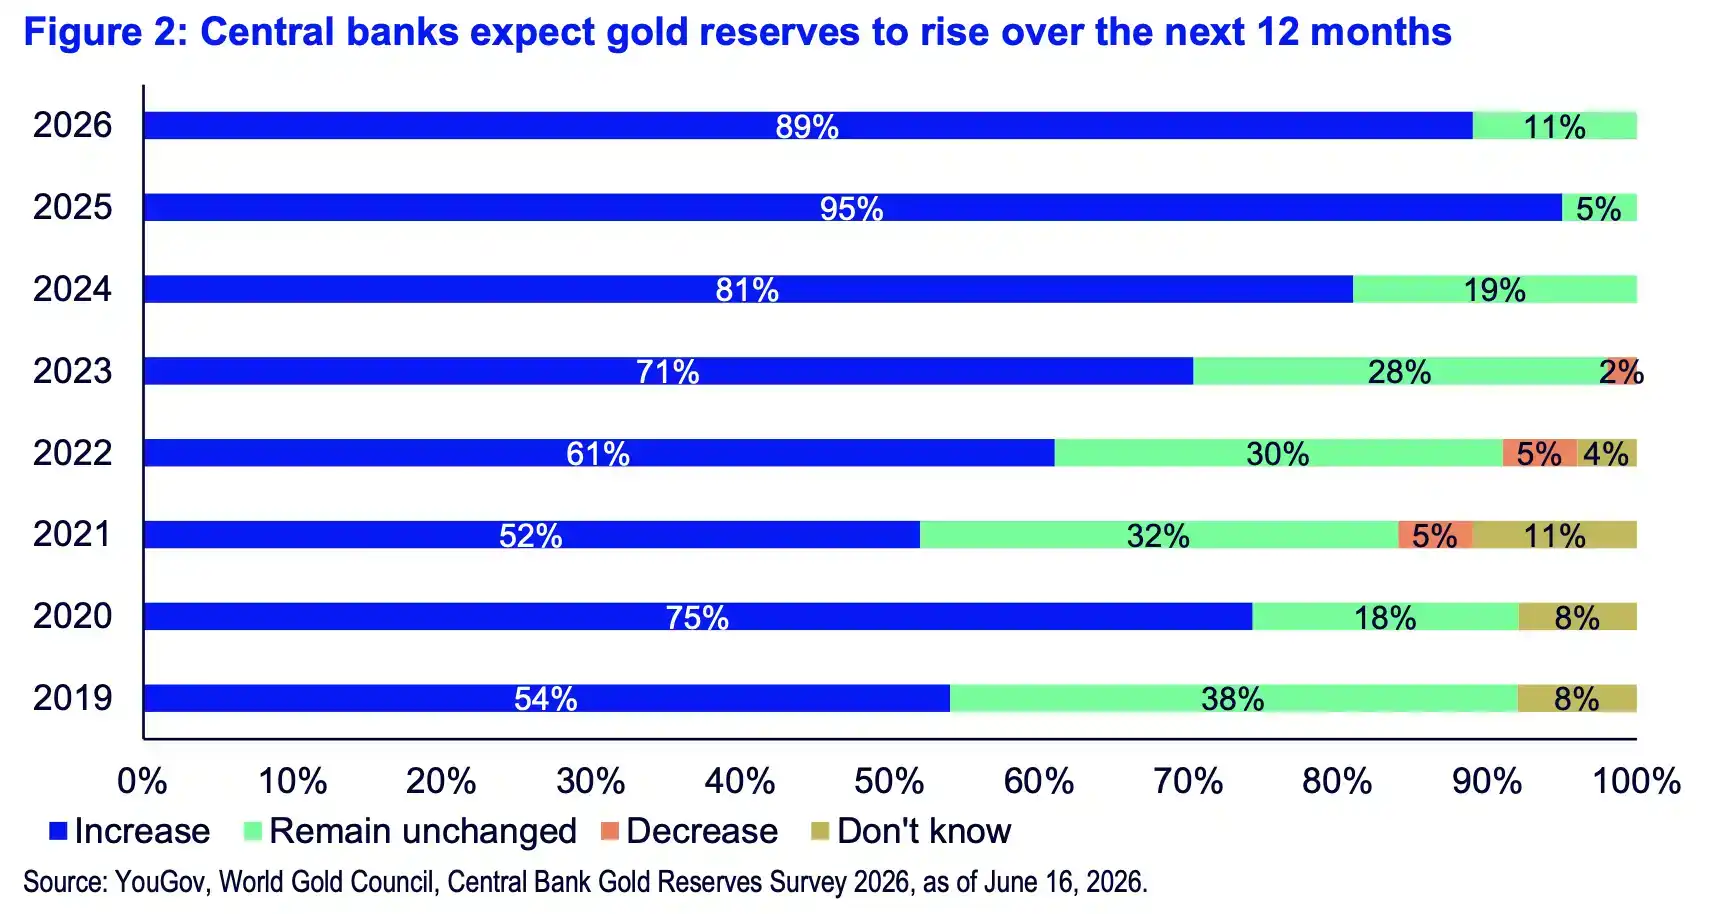
Central bank gold reserve expectations survey; 89% expect global gold reserves to increase, 45% expect own institution to increase holdings, 74% expect US dollar reserve share to decline.
Specific buyers are still active. The report states Poland purchased 14 tonnes in April, bringing its year-to-date total to 45 tonnes. The People's Bank of China increased holdings by 10 tonnes by May to 2332 tonnes, marking 19 consecutive months of purchases at that time.
The macro backdrop has not eased either. In the first half of 2026, global debt rose to $353 trillion, with government debt accounting for nearly one-third. As long as fiscal deficits, inflationary impulses, and reserve diversification needs coexist, demand for gold as a monetary hedge is unlikely to vanish due to a single correction.
Gold's Rise as a Reserve Core, US Treasuries' Status Eroding
The longer-term shift stems from the reshuffling within official reserve assets.
Citing European Central Bank estimates, State Street notes that by the end of 2025, gold's share of global official reserves rose to about 27%, surpassing the 22% share of US Treasuries for the first time. By 2026, this share further approached 28%, while the US dollar's reserve share fell to about 40%.
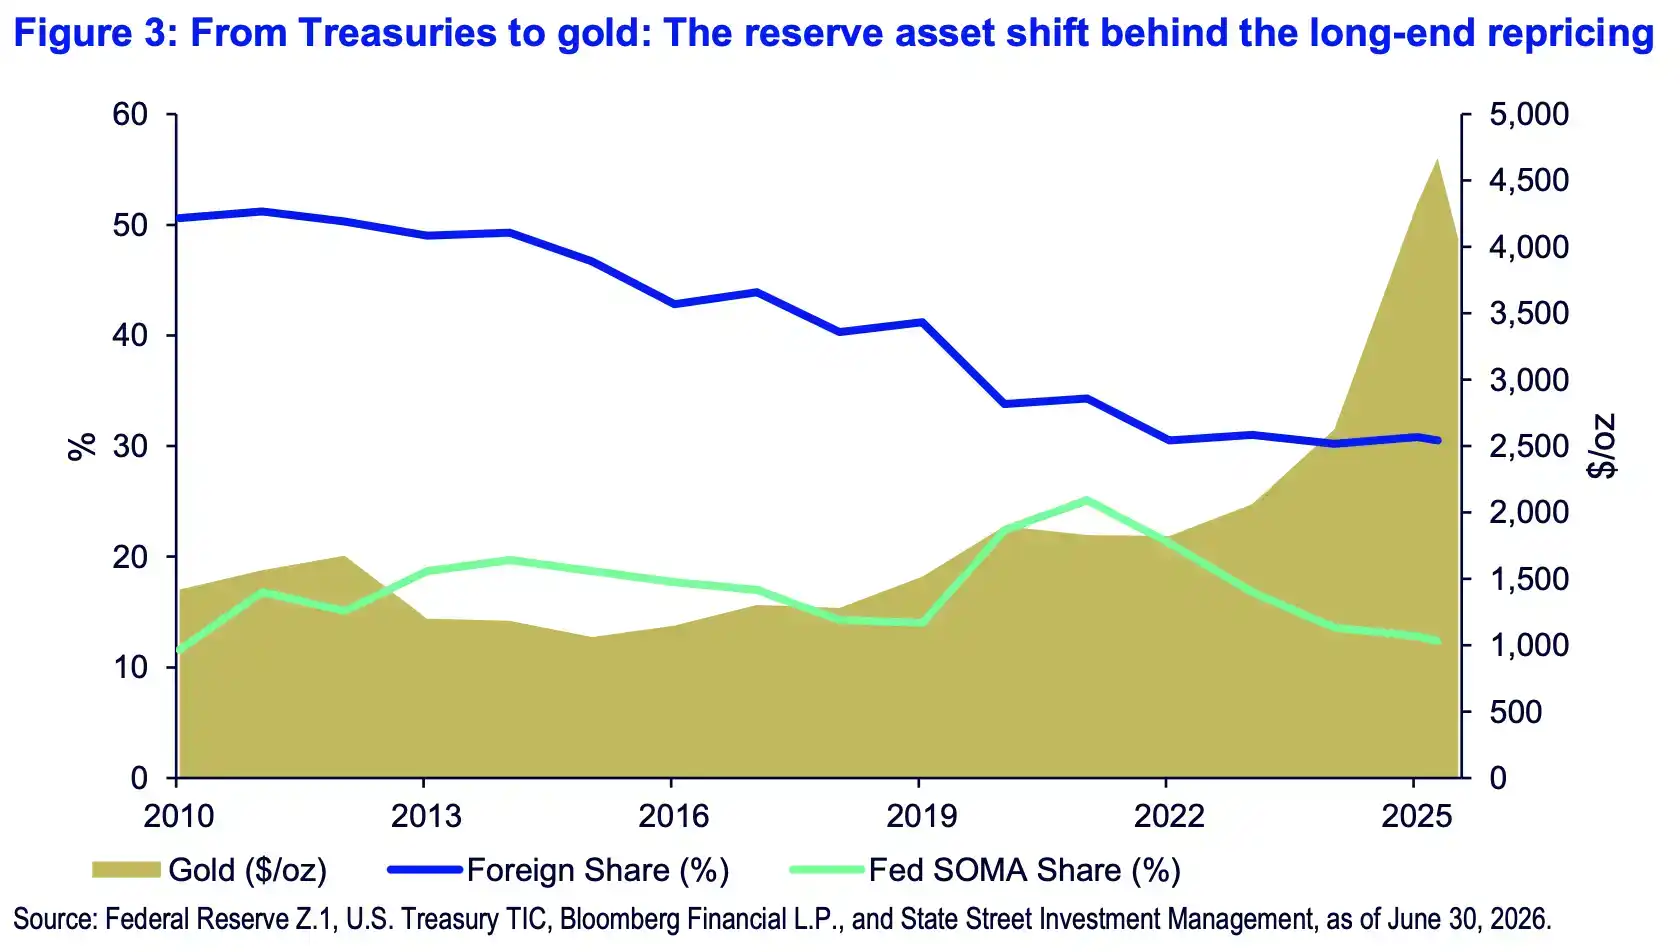
Shift in reserve assets from US Treasuries to gold; 2010-2025 gold reserve share rose to 27%, first exceeding US Treasury's 22%, foreign holdings of US Treasuries dropped from about 50% to 31%.
This change impacts gold prices in two ways.
First, central bank purchases mean gold demand no longer relies entirely on individual investors and ETF flows. When Western funds exit short-term, official buying and Asian physical demand can cushion the speed of the decline.
Second, the buyer structure for US Treasuries is changing. Foreign holdings of US Treasuries have dropped from about 50% to 31%, and the Fed's SOMA portfolio share has also shrunk from its 2021 peak of 25% to 13%. As US debt continues to expand while traditional external buyers relatively decrease, reserve managers have more incentive to shift a portion of assets into gold.
This is also the main logic behind the $5000 target. The rise in gold prices is not solely driven by safe-haven sentiment, but is supported by global reserve structure, debt pressures, and central bank allocation preferences.
Chinese Demand Only Provides a Floor, Rebound Awaits ETF Inflows
Besides central banks, Chinese physical demand and regional fund flows provide another pillar of support.
The report states China's non-monetary gold imports reached 160 tonnes in April, up 25% year-on-year. May imports reached 163 tonnes, up 63% year-on-year. In June, the average local gold price premium in China was 1.0%, the highest level since April 2025.
This indicates that even as the global gold price corrected, the local Chinese market did not weaken completely. Higher premiums typically correspond to stronger local buying appetite, suggesting import demand remains supported.
Fund flows also show a clear divergence. While North American capital exited gold funds, China saw a net inflow of $5.9 billion year-to-date, and the Asia-Pacific region net purchases amounted to about $12.6 billion in H1. Although Asia also saw about $3.6 billion in selling in May-June, the rising local premium leaves room for fund inflows in the second half.
There are limits here. Strong physical demand does not guarantee continuous ETF inflows. A higher local premium does not mean the international gold price will immediately rebound. For the $5000 target, the more critical factor is whether Chinese physical demand can translate into sustained fund purchases, and whether Western ETF redemptions cease to expand.
Long-term Bullish Thesis Intact, High Rates Initially Capping Upside Momentum
Gold currently faces a situation where long-term buying interest persists, but short-term holding costs are rising.
If Fed rate hike expectations continue to strengthen, real yields continue to rise, and the dollar remains strong, gold will struggle to immediately escape pressure around $4000. State Street raising the probability of the $4000-$4750 consolidation scenario to 25% acknowledges this resistance.
The base case scenario remains $4750-$5500, with a 70% probability. The extreme bull scenario is lowered to 5%, corresponding to $5500-$6250. The $5000 target remains, but the path higher is more likely to be a volatile recovery rather than a one-way rally.
The most immediate risk in this correction is further expansion of redemptions from Western gold ETFs, coupled with the dollar and real yields capping gold's valuation. If these pressures do not ease, even with support from central bank and Chinese buying, gold prices may first digest June's sharp drop within a wider range.