Escrito por: Tiger Research
Compilado por: AididiaoJP, Foresight News
Puntos clave
El entorno macro sigue siendo favorable, aunque el ritmo se ha ralentizado: El M2 global alcanzó un máximo histórico de 13,44 billones de dólares, y los flujos de los ETF de Bitcoin registraron entradas netas por primera vez en 14 meses. Sin embargo, el shock petrolero provocado por el conflicto en Irán elevó la CPI de marzo al 3,3%, reduciendo el camino de recortes de tasas de la Fed.
Los indicadores on-chain de Bitcoin pasan de infravalorados a un equilibrio temprano: Los indicadores clave on-chain han salido de la zona de pánico del primer trimestre. El precio actual de 70.500 dólares está aproximadamente un 13% por debajo del coste medio de entrada de los holders a largo plazo, que es de 78.000 dólares. Superar ese nivel sería una señal principal de una reversión de tendencia a corto plazo.
El precio objetivo de 143.000 dólares y el potencial de subida de 2x se mantienen: Basado en una referencia neutral de 132.500 dólares, ajustada por fundamentos -10% y macro +20. Aunque es inferior al objetivo de 185.500 dólares del primer trimestre, la fuerte corrección del precio al contado significa que el potencial de subida real desde los niveles actuales es en realidad mayor.
El viento de cola macro persiste, pero el impulso se ha ralentizado
Desde la publicación del informe del primer trimestre, Bitcoin ha caído aproximadamente un 27%, con un precio promedio a principios de abril rondando los 70.500 dólares. El conflicto con Irán introdujo una nueva variable, pero el panorama macro general sigue siendo favorable. Lo que ha cambiado no es la dirección, sino la velocidad.
La liquidez alcanza máximos históricos, pero no llega eficazmente a Bitcoin
Hasta febrero de 2026, el M2 global continuó expandiéndose hasta cerca de un máximo histórico de 13,44 billones de dólares. Sin embargo, Bitcoin cayó un 27% respecto al primer trimestre. La liquidez y el precio muestran un movimiento inverso.
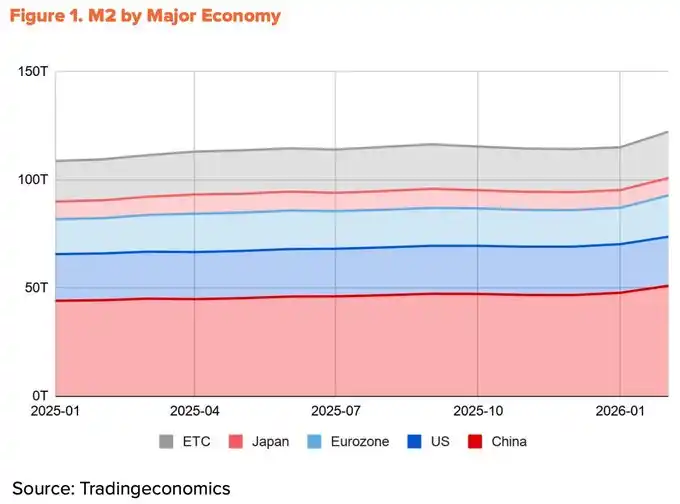
El origen de la liquidez explica esta divergencia. Del crecimiento del M2 en el último año de las cuatro mayores economías (China, EE.UU., zona euro, Japón), más del 60% provino de China, impulsado por el recorte del coeficiente de caja del Banco Popular de China y su giro hacia una postura acomodaticia en el primer trimestre.
La contribución de EE.UU. fue solo del 10%. El problema es que los canales para que la liquidez de origen chino llegue al mercado de Bitcoin son limitados. Las restricciones a las transacciones de cripto internas persisten, y los canales indirectos a través de Hong Kong y Singapur sirven principalmente a capital institucional. La liquidez global está en máximos históricos, pero la porción que realmente puede alcanzar el mercado de Bitcoin se está reduciendo.
El conflicto con Irán frena el ritmo de recortes de la Fed
Dado que la transmisión de la liquidez de origen chino está obstruida, la liquidez en dólares sigue siendo el principal motor de Bitcoin. Pero incluso esta parte se ha visto ralentizada por el conflicto con Irán.
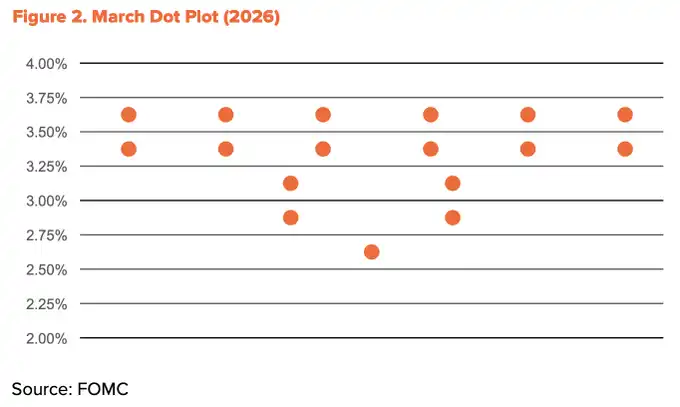
Tras el ataque de EE.UU. e Israel a Irán el 28 de febrero, el Estrecho de Ormuz fue bloqueado. El Brent se disparó hasta 118 dólares por barril a mediados de marzo, y el crudo de Dubái alcanzó un máximo histórico de 166 dólares por barril. Este shock elevó directamente la inflación. La CPI de EE.UU. en marzo subió del 2,4% en febrero al 3,3%, alcanzando un máximo de dos años. El espacio de la Fed para recortar tasas se redujo. Las proyecciones de puntos de la Fed de marzo redujeron las expectativas de recortes para 2026 a solo uno.
Aun así, la dirección acomodaticia no ha cambiado. A mediados de abril, el Estrecho de Ormuz se reabrió parcialmente y el precio del petróleo retrocedió significativamente hasta alrededor de 90 dólares. La CPI subyacente se estabilizó en el 2,6%, indicando que el shock aún no se ha extendido ampliamente a la economía general. El presidente Trump nominó formalmente a Kevin Warsh como próximo presidente de la Fed a finales de enero, y las audiencias de confirmación del Senado están en curso. El mandato de Powell finaliza el 15 de mayo, y es probable que continúe la tendencia acomodaticia. El número de recortes puede reducirse, pero la dirección se mantiene.
Los flujos de capital institucional comienzan a revertirse
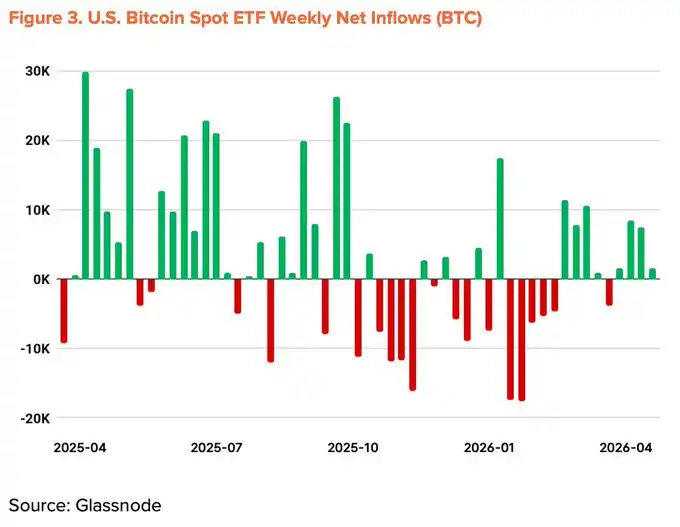
Las salidas institucionales que impulsaron la caída del primer trimestre han comenzado a revertirse. Los ETF spot de Bitcoin registraron su peor mes de salidas netas desde su lanzamiento en noviembre de 2025, con cinco meses consecutivos de salidas netas. Sin embargo, desde marzo, las entradas netas mensuales se han vuelto positivas. Hasta mediados de abril, el flujo acumulado del año se volvió positivo, y los activos totales bajo gestión se recuperaron a 96.500 millones de dólares.
La acumulación corporativa también se está acelerando. Strategy gastó 2.540 millones de dólares en una semana (13-19 de abril) para comprar 34.164 bitcoins, llevando sus tenencias totales a 815.061 BTC. Sin embargo, el número de empresas que participan en esta tendencia no ha aumentado significativamente.
Indicador macro ajustado a +20%
Los vientos de cola estructurales siguen intactos: expansión de la liquidez, tendencia de política acomodaticia, flujos institucionales de vuelta a positivo, y avances en la ley CLARITY de EE.UU. Los vientos en contra recientes - el shock petrolero por Irán y la desaceleración de los recortes de la Fed - han contrarrestado parcialmente estos factores positivos. El indicador macro del segundo trimestre se ajusta a la baja 5 puntos porcentuales respecto al primer trimestre, estableciéndose en +20%.
De infravalorado a equilibrio temprano
Los indicadores on-chain han salido de la zona de pánico extrema y están transitando hacia el límite entre infravaloración y equilibrio. Indicadores clave como MVRV-Z, NUPL y aSOPR han salido de la zona de pánico del primer trimestre y han entrado en una fase de recuperación temprana. Aunque es menos probable que se produzcan fuertes subidas como las de los rebotes desde la zona de pánico, los datos históricos muestran que el rendimiento promedio anual desde esta zona se mantiene consistentemente en dos dígitos. La relación riesgo-recompensa en este punto sigue estando en su posición más favorable.
Es notable que la base de coste promedio de los holders a corto plazo (STH) está disminuyendo gradualmente. Esto sugiere que el capital especulativo está saliendo, mientras que nuevos compradores están acumulando a precios más bajos. El momento coincide con el reinicio de las entradas netas en los ETF y las grandes compras de Strategy, apoyando la idea de que los inversores institucionales están acumulando consistentemente en el rango de descuento, bajando así el coste medio de entrada.
El nivel de riesgo clave son 54.000 dólares, la base de coste promedio de la red. Una caída por debajo de este nivel pondría a toda la red en pérdidas no realizadas, convirtiéndose en el suelo en un escenario extremo. La resistencia más fuerte está en 78.000 dólares, coincidiendo con el coste medio de entrada de los holders a largo plazo.
El precio actual de 70.500 dólares está aproximadamente un 13% por debajo de ese nivel de resistencia, y una gran cantidad de capital a corto plazo recientemente ingresado está en pérdidas no realizadas. Una ruptura decisiva por encima de 78.000 dólares a corto plazo merece una estrecha atención.
Crecimiento superficial, estancamiento subyacente
En la primera quincena de abril, el volumen diario promedio de transacciones de Bitcoin alcanzó las 564.000, un aumento interanual del 37,9%. Los datos superficiales son brillantes, pero los detalles cuentan otra historia.
El número de direcciones activas cayó a 428.000 en el mismo periodo, un descenso interanual del 13,2% y una caída trimestral del 4,2%. El tamaño medio de transacción por transferencia cayó a 1,19 BTC, un 34,1% menos que los 1,80 BTC del trimestre anterior. El número de transacciones sube, pero los participantes y el valor por transacción bajan. Este patrón refleja a unos pocos usuarios realizando repetidamente pequeñas transferencias, no una amplia adopción económica de la red. Una parte significativa del crecimiento del volumen probablemente proviene de flujos mecánicos como recargas en exchanges, no relacionados con un crecimiento real.
El informe del primer trimestre mantuvo el indicador de fundamentos en 0%, basado en la expectativa de expansión del ecosistema BTCFi. Al entrar en el segundo trimestre, esta tesis se ha debilitado notablemente. Según el 'Perspectiva de Activos Digitales 2026' de The Block, el TVL de L2 de Bitcoin ha caído un 74% en el año, el TVL total de BTCFi ha descendido un 10%, y representa solo el 0,46% del suministro total de Bitcoin (91.332 BTC). Aunque protocolos individuales como Babylon y Lombard han crecido, el ecosistema en su conjunto ha mostrado una contracción.
Indicador de fundamentos ajustado a -10%
El crecimiento superficial no se ha traducido en una expansión real de la red, y los datos subyacentes que sostenían la tesis BTCFi se han debilitado. El equilibrio de señales positivas y negativas que se cancelaban mutuamente en el primer trimestre se ha roto. El indicador de fundamentos del segundo trimestre se ajusta a la baja del 0% a un piso de -10%.
Precio objetivo de 143.000 dólares, aún con potencial de subida de 2x
Aplicando el método TVM, la referencia neutral calculada sobre el precio promedio de principios de abril de 2026 es de 132.500 dólares. Superponiendo los ajustes de fundamentos -10% y macro +20%, el precio objetivo a 12 meses se establece en 143.000 dólares.
Esta cifra es aproximadamente un 23% inferior al objetivo de 185.500 dólares del primer trimestre. Sin embargo, el potencial de subida real es en realidad mayor. Calculado sobre el precio promedio, el espacio alcista se amplió del +93% en el primer trimestre al +103% en el segundo.
La reducción del precio objetivo no representa pesimismo. La dirección macro y la estructura on-chain siguen apoyando la lógica alcista a medio y largo plazo.
Tres puntos de observación a corto plazo:
- Una ruptura decisiva por encima del nivel de equilibrio a medio plazo de la red de 78.000 dólares;
- Entradas netas continuas en los ETF;
- Un giro en la política de la Fed tras la mitigación de los riesgos geopolíticos.
Si estas tres condiciones se materializan simultáneamente, el objetivo de 143.000 dólares sigue siendo alcanzable.