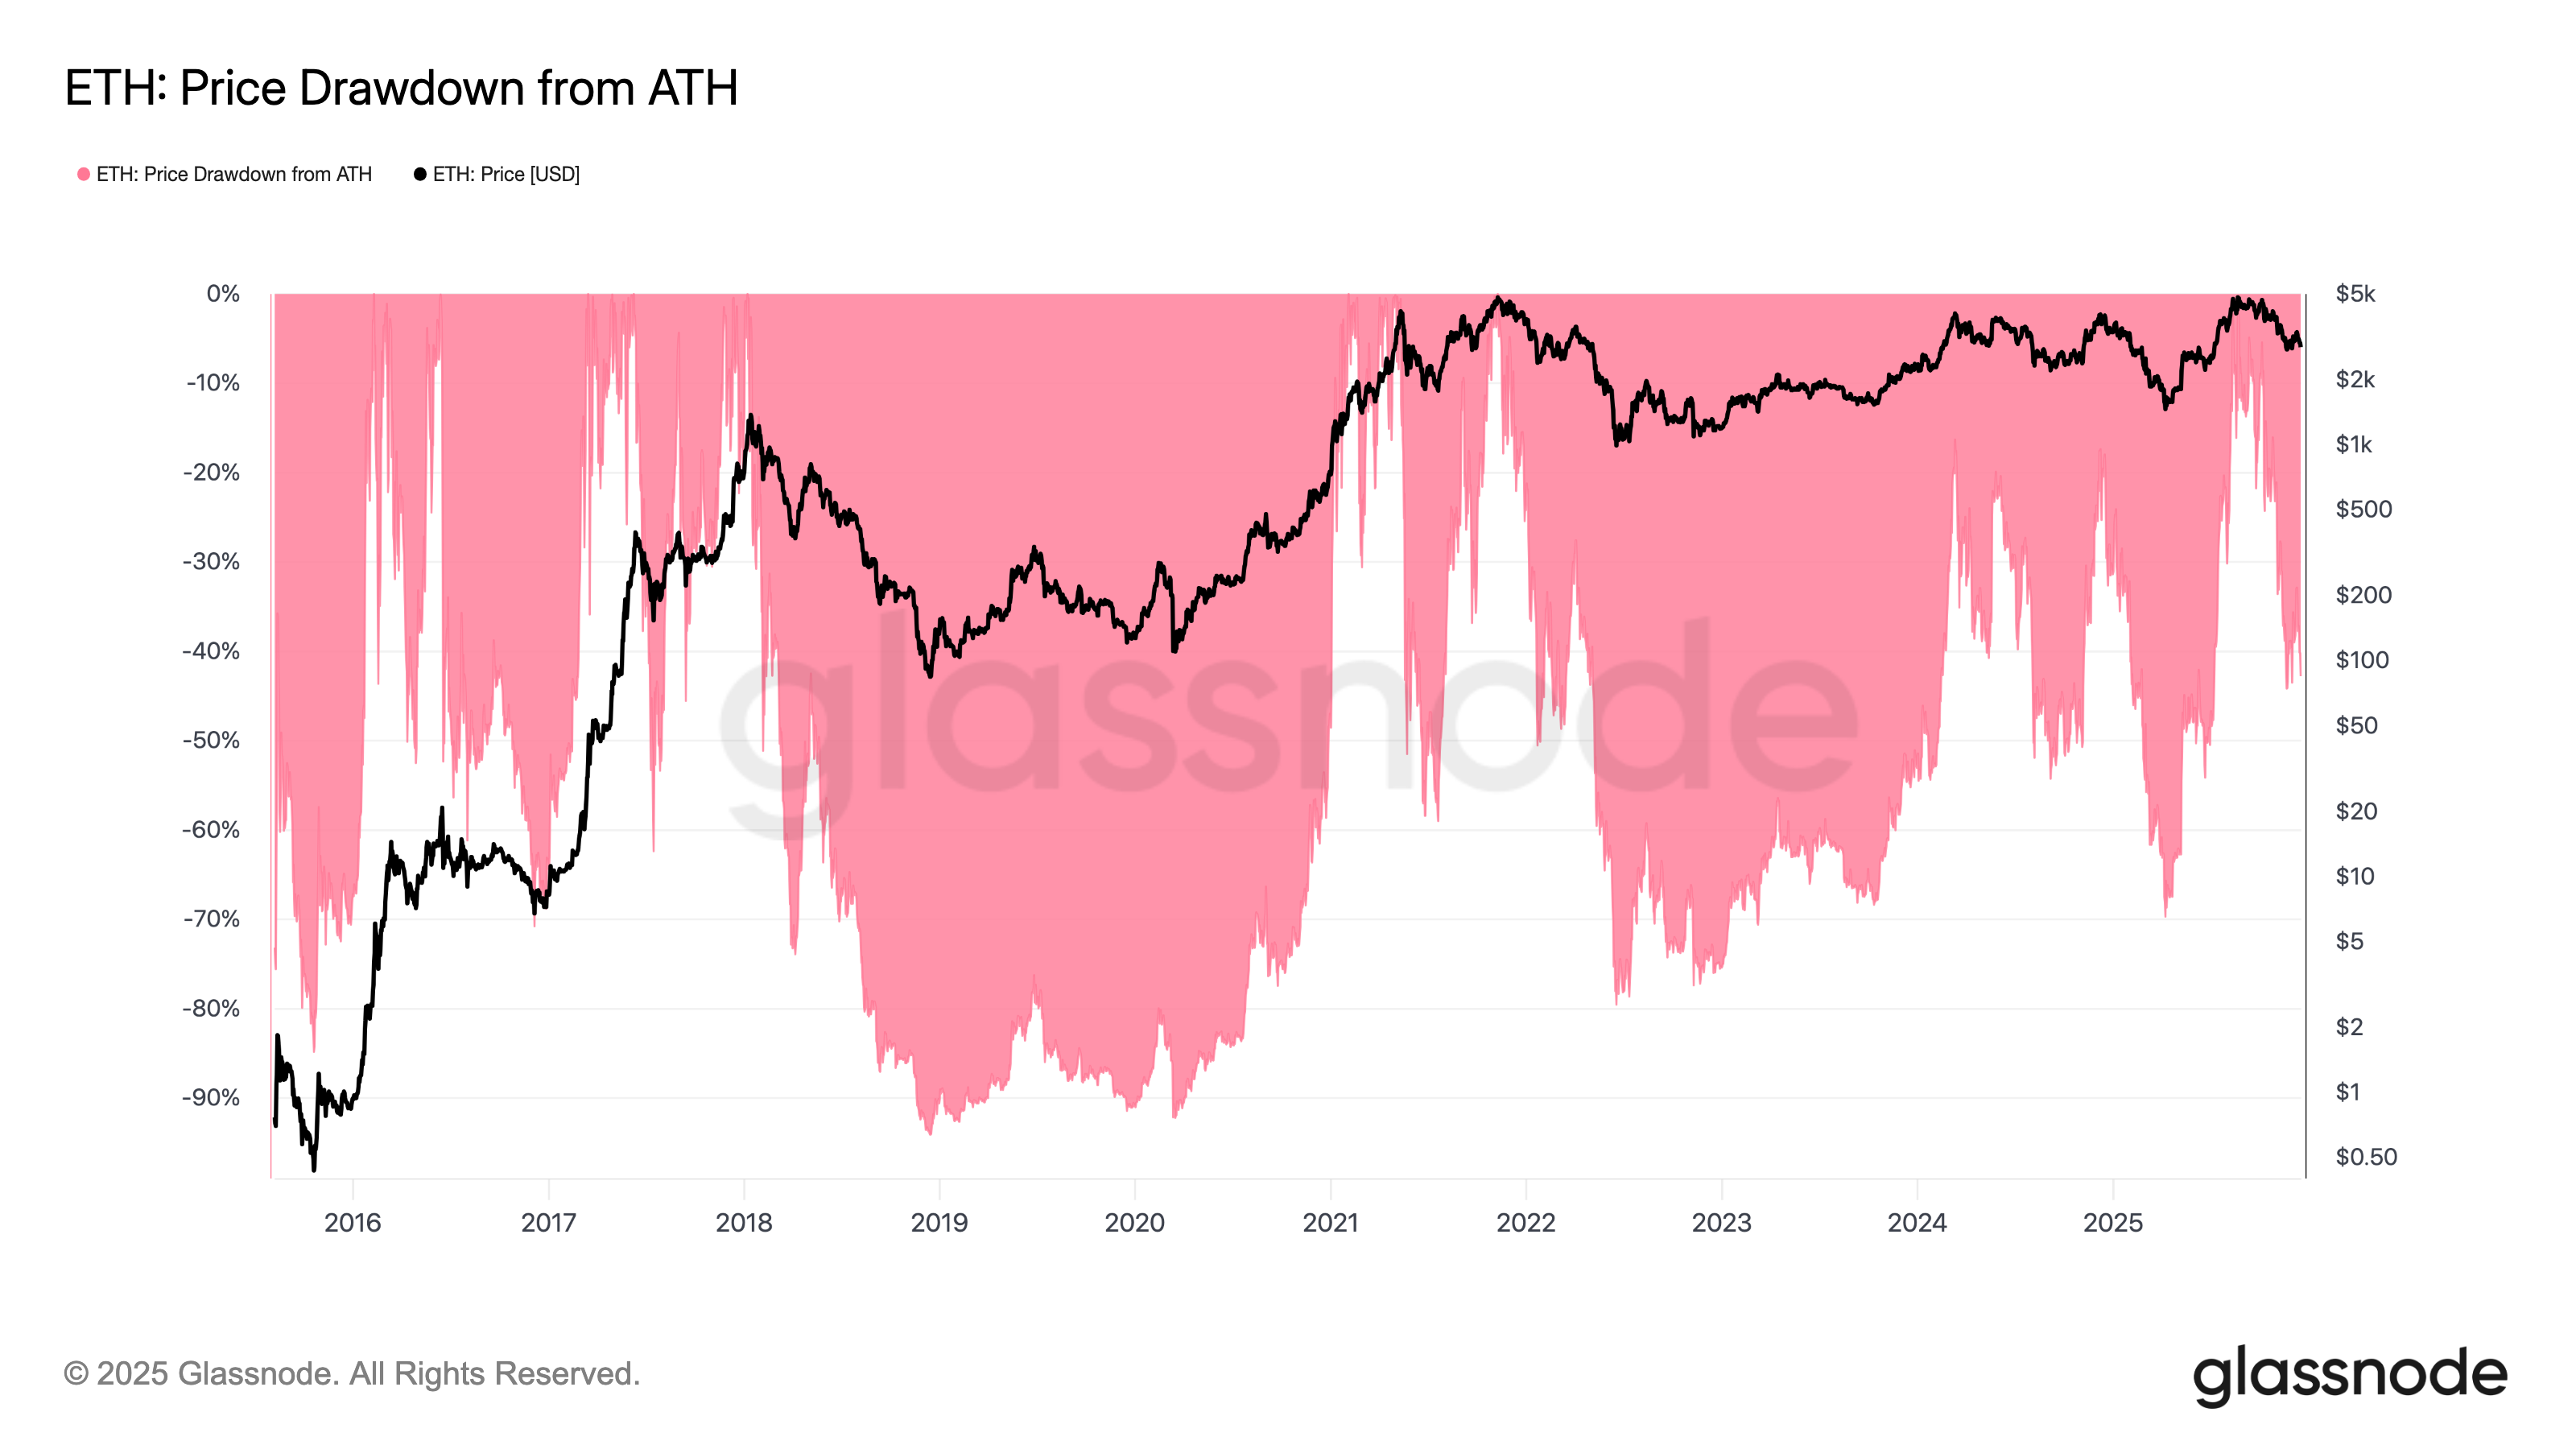
Ether (ETH) has retraced 42% from its all-time high of $4,950 with traders wondering where the altcoin was likely to bottom out next.
Key takeaways:
Ethereum traders see ETH price dropping to $2,100 if support at $2,800 fails.
Persistent Ether ETF outlaws and less treasury buying introduce more risks for bulls.
Analysis: 25% ETH price drop possible
Data from Cointelegraph Markets Pro and TradingView showed that the ETH/USD pair has dropped back below $3,000.
Commenting on the latest price action, analyst and trader Daan Crypto Trades said that although this cycle has not been what ETH investors anticipated, Ether’s “market structure and the Ethereum ecosystem have matured during this time,” adding:
“I can’t defend the price action this cycle, it has underperformed $BTC and many others massively.”
An accompanying chart suggested that if ETH lost its $2,800 support, it would likely drop toward the next major support level around $2,100.
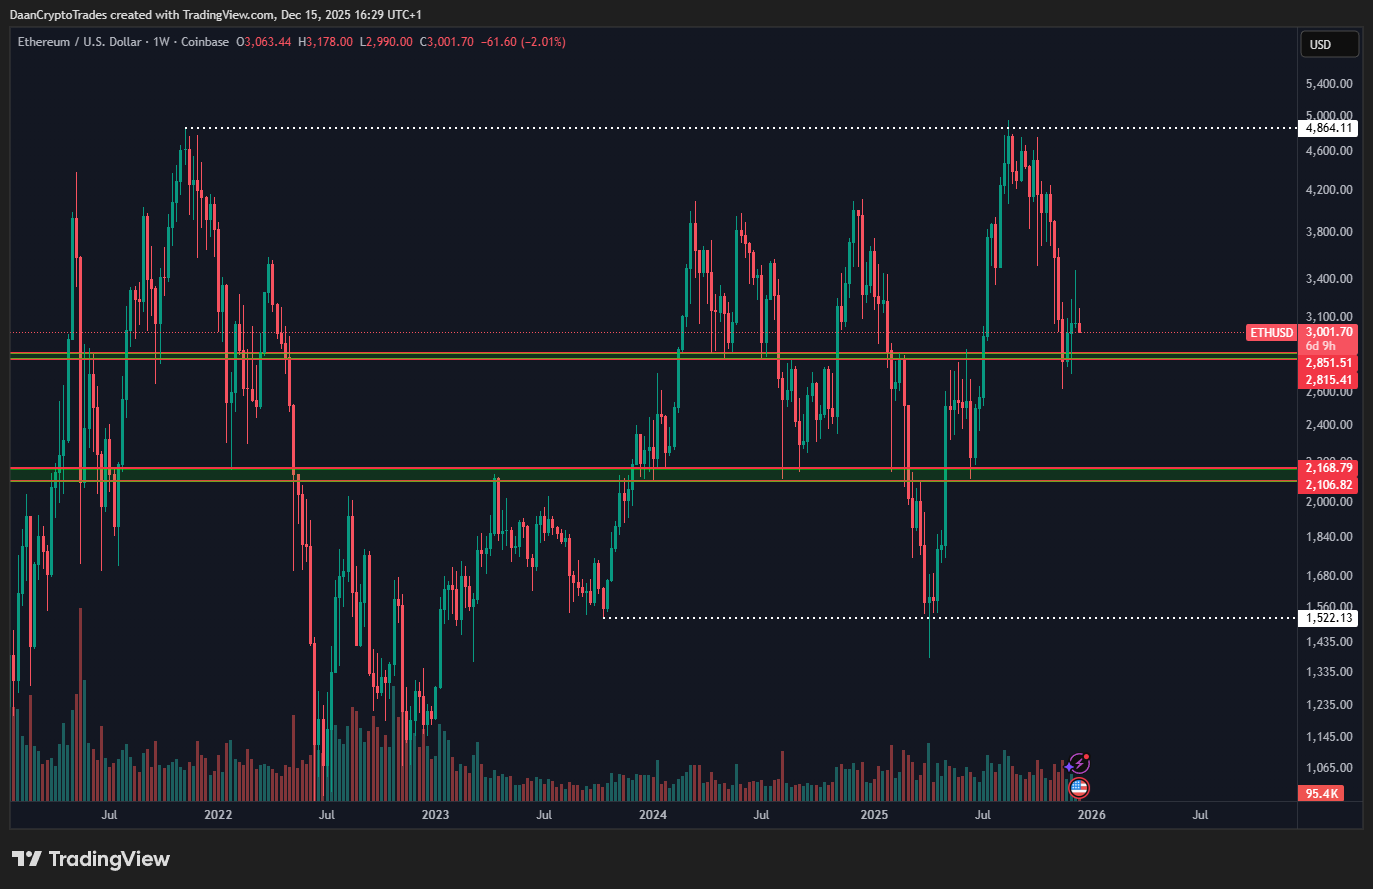
Data from Glassnode showed that the next significant support below $2,800 sits at around $2,100, where approximately 2.1 million ETH were previously acquired.
Related: Ethereum could get faster in January with gas limit rise to 80M
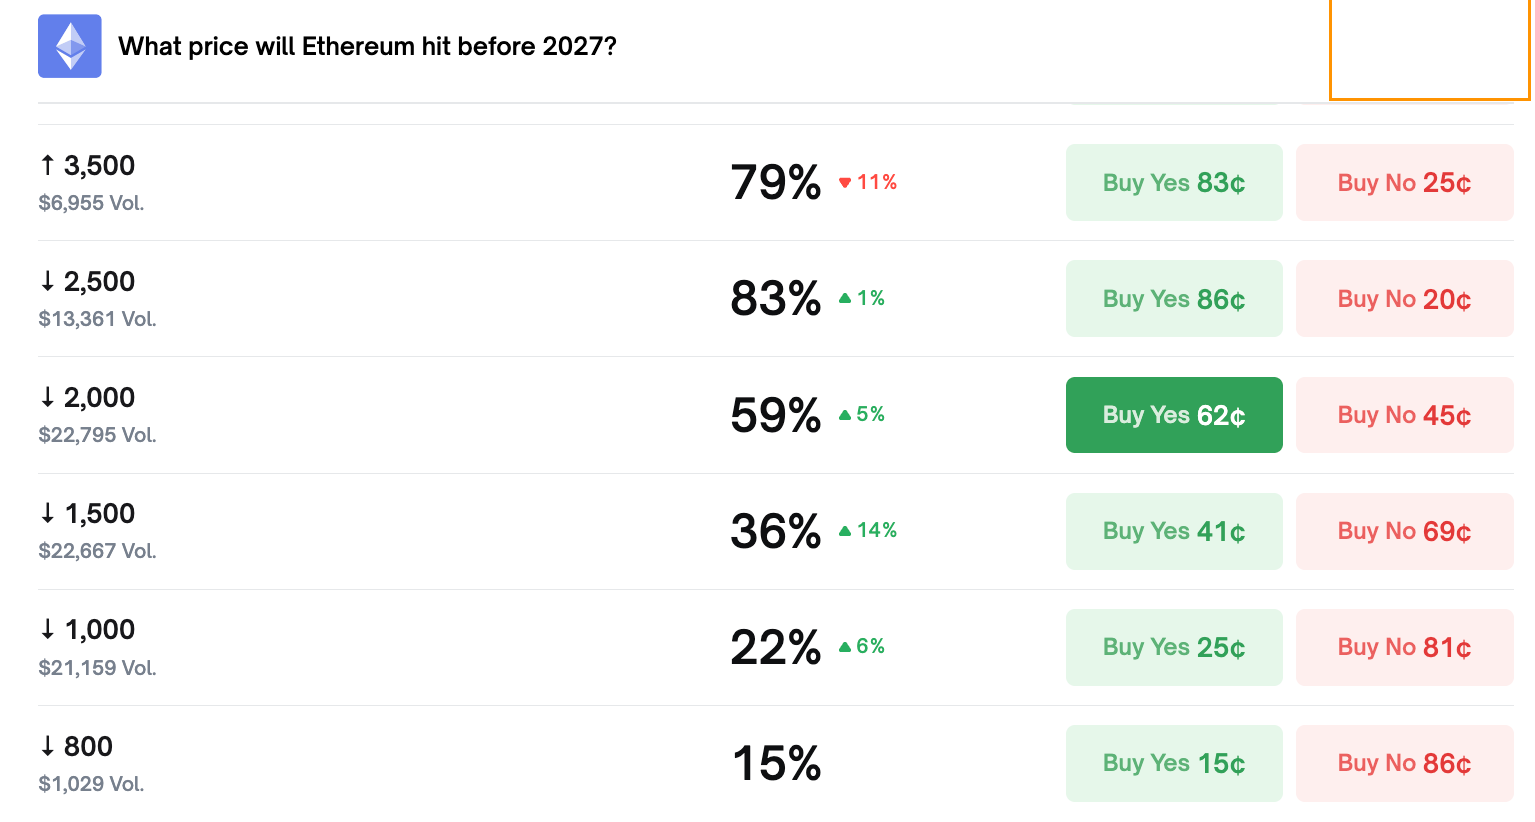
Although Polymarket bettors are pricing in only about an 11% chance of ETH dropping to $2,000-$2,200 before the end of 2025, they see an 83% chance of Ether’s price revisiting $2,500 and a 59% chance of it falling to $2,000 in 2026.
Ether’s low for 2025 is $1,380, reached in April, and the last time the ETH/USD pair traded at $2,100 was on May 9. The current 42% drawdown from all-time highs, however, is relatively shallow. Previous bear cycles bottomed after the price declined by around 80-90%.
Investors de-risk from Ethereum ETFs
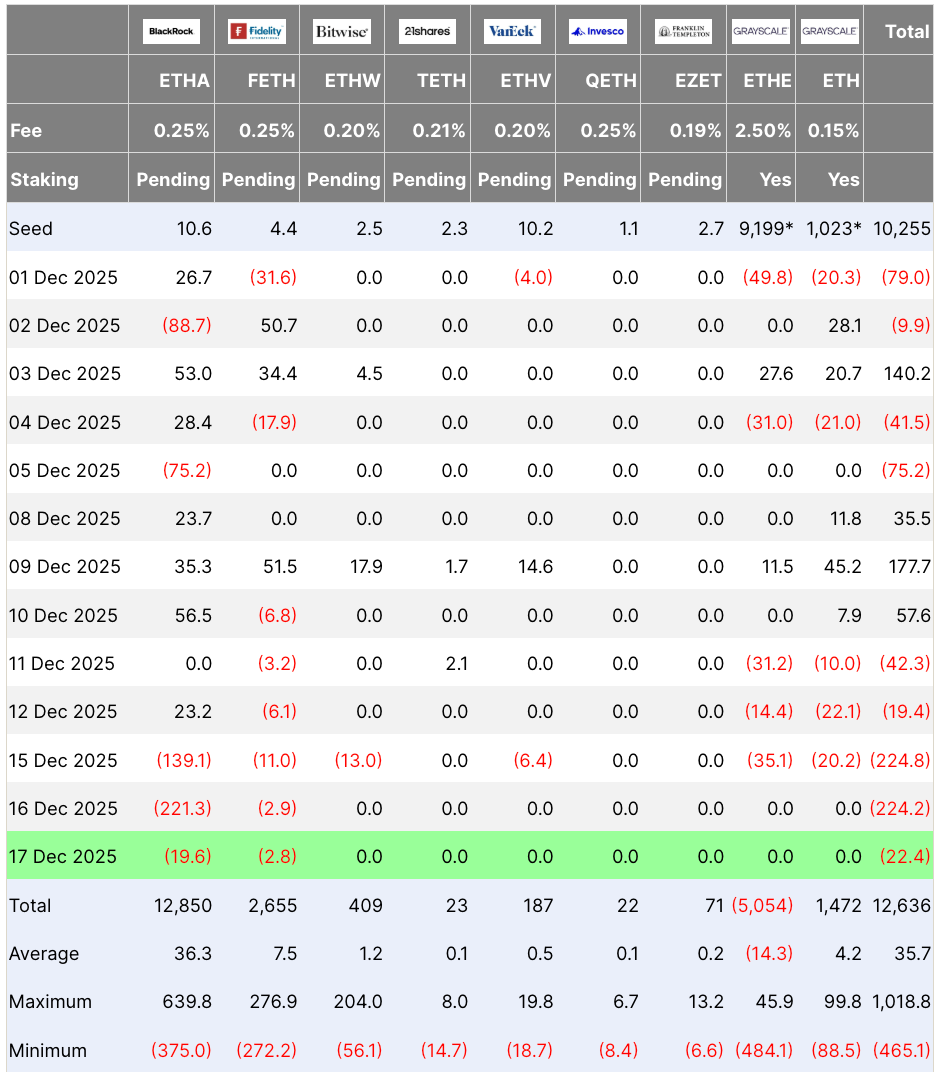
Institutional demand for US-based spot Ethereum exchange-traded funds (ETFs) has declined, according to data from Farside Investors.
These investment products posted outflows for five consecutive days, totaling $533.1 million, and reducing the assets under management to $17.34 billion.
“US-based Ethereum ETFs continue to see capital outflows,” CryptoQuant analyst IT Tech said in his latest post on X, adding:
“Investors are de-risking or quietly rotating away from ETH, suggesting no immediate comeback for Ether.”
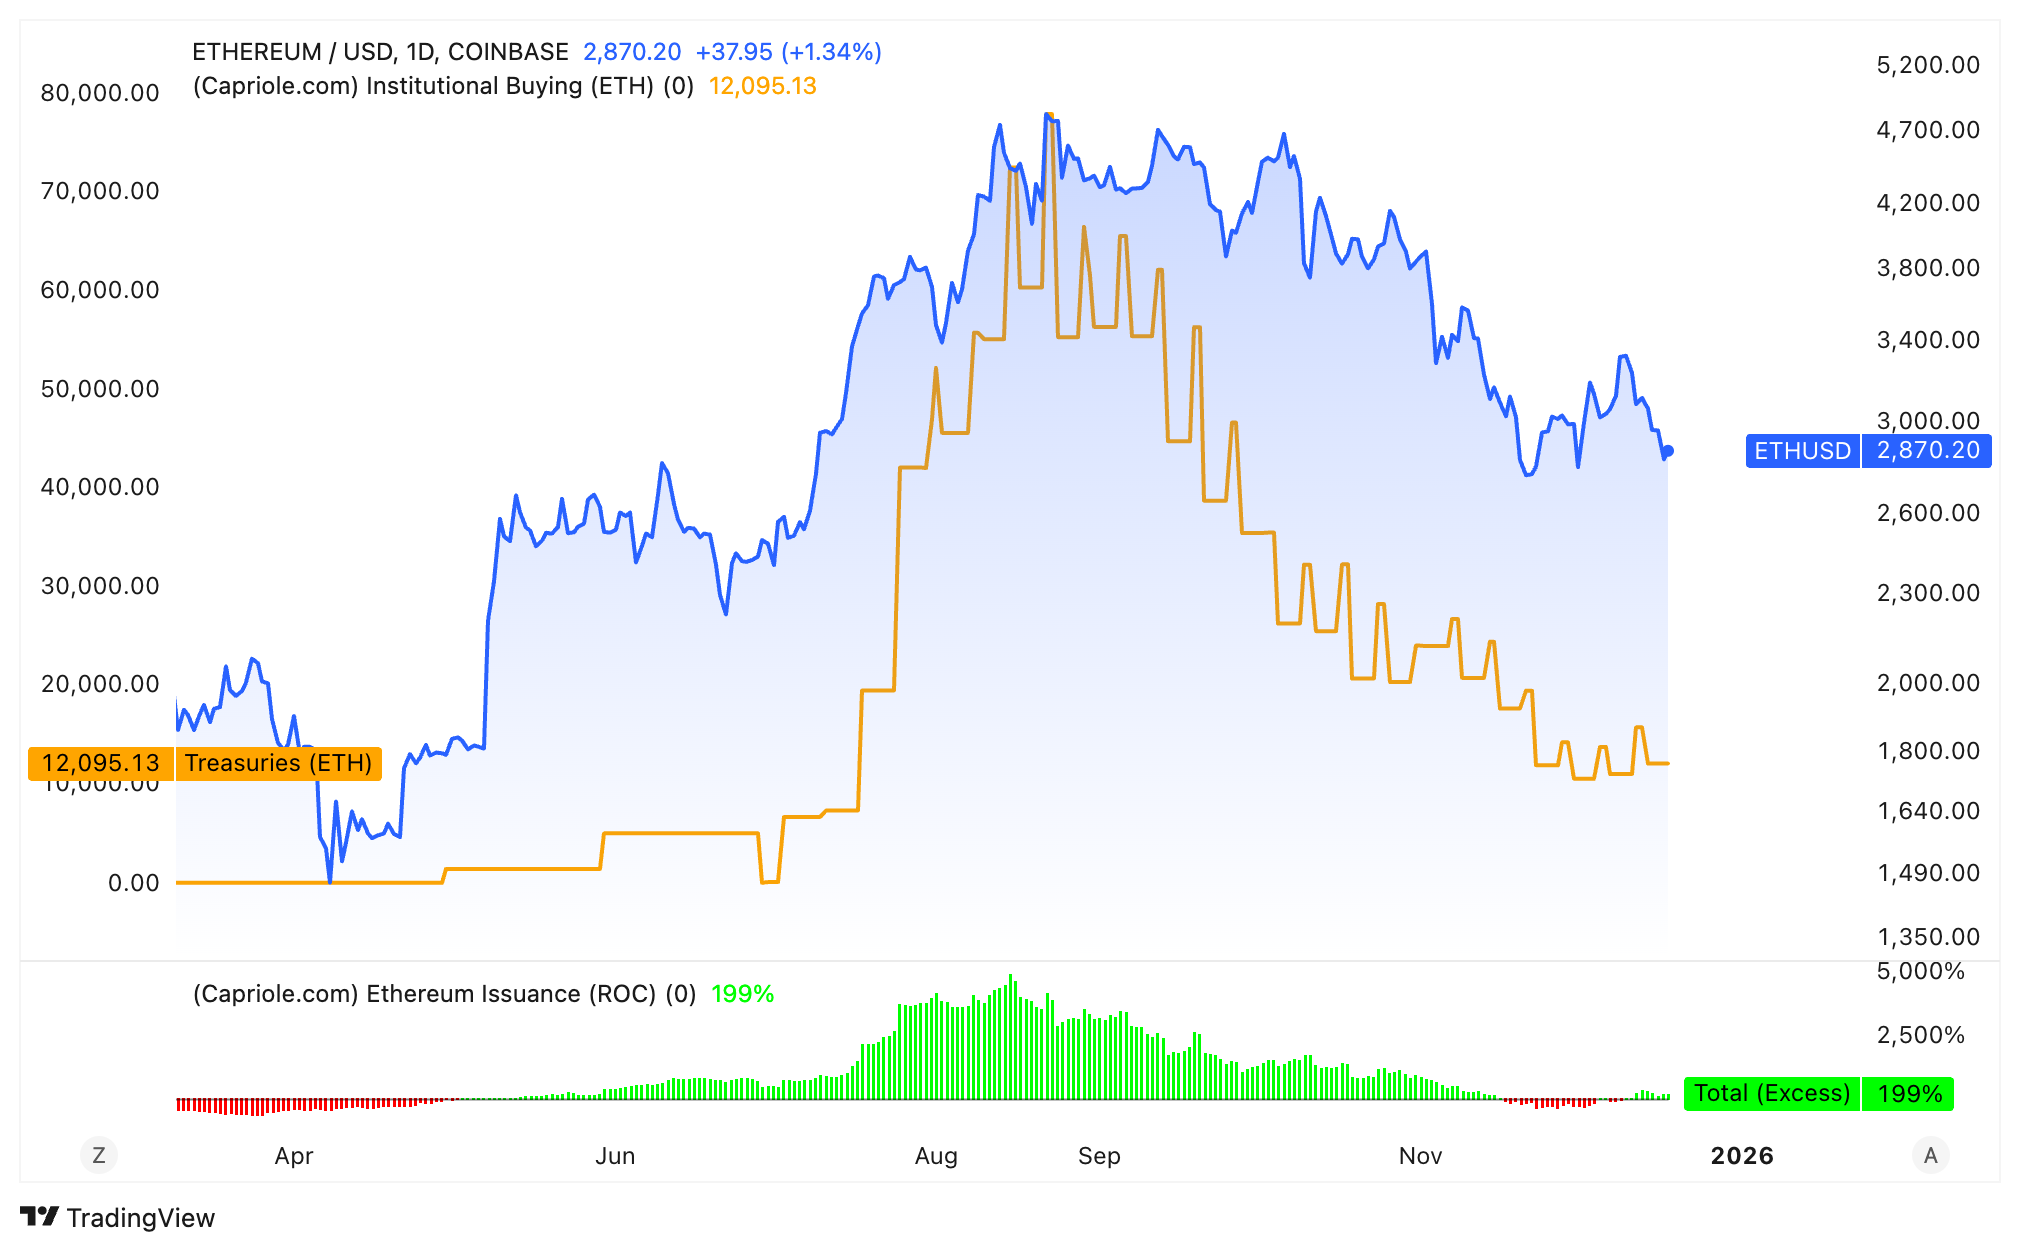
Additional data from Capriole Investments reveals that daily purchases by Ethereum treasury companies have dropped from a peak of 78,010 ETH on Aug. 23 to 12,095 ETH per day.
Even though BitMine is accelerating its Ether buying, multiple onchain and technical indicators around the ETH have turned bearish, suggesting more pain ahead.
This article does not contain investment advice or recommendations. Every investment and trading move involves risk, and readers should conduct their own research when making a decision. While we strive to provide accurate and timely information, Cointelegraph does not guarantee the accuracy, completeness, or reliability of any information in this article. This article may contain forward-looking statements that are subject to risks and uncertainties. Cointelegraph will not be liable for any loss or damage arising from your reliance on this information.