Dogecoin Recovery: How Much Can The Leading Meme Coin Rise Again?

bitcoinistPublished on 2026-02-16Last updated on 2026-02-16

Abstract

Dogecoin has been declining, recently dropping 10% in 24 hours and trading around the $0.10-$0.11 support level. Analysts suggest this range is a key psychological battleground. According to BitGuru, if buyers support the price here, DOGE could rebound toward $0.13, $0.15, or even $0.19. Another analyst, Charting Guy, notes a significant technical signal on the weekly chart: the 20-week EMA has crossed below the 200-week EMA, a pattern that has historically marked cycle lows before major uptrends. If support holds, a recovery could target the $0.20-$0.25 range, with higher resistances near $0.30 dependent on broader market strength, particularly from Bitcoin.

Dogecoin has spent the past few weeks grinding lower, testing the patience of bullish traders. The past 24 hours, for instance, were spent with sell-offs, with the meme coin king now down by 10% in the last trading day.

Dogecoin is now perambulating around the $0.10 to $0.11 range, a level that has repeatedly acted as a psychological battleground in past cycles. Recent technical analyses shared on X suggest that this range could determine whether Dogecoin stages another rebound or drifts deeper into weakness in the coming weeks.

Bullish Phase, Liquidity Sweep, And Consolidation

Crypto analyst BitGuru recently outlined a structure that many traders may recognize from previous market cycles. According to his view, Dogecoin initially formed what he described as a bullish phase before entering a liquidity sweep and an extended consolidation period. The daily candlestick chart he shared shows price pushing higher earlier in the cycle, followed by a clear downside move that has been playing out since October 2025.

After that sweep, Dogecoin settled into a tightening channel of lower lows and lower highs, creating a prolonged correction range through late 2025 and into early 2026. The daily candlestick chart, which is shown below, highlights an important horizontal support region around $0.10, where price has recently reacted. From a technical perspective, this region acted as a bottom during the early February crash.

Source: Chart from BitGuru on X

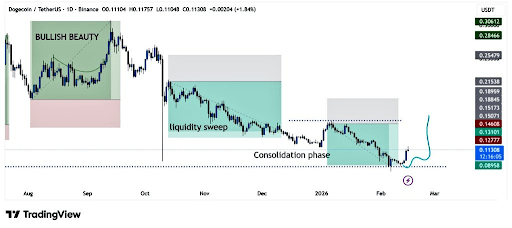
According to BitGuru, if buyers were to step in here, Dogecoin could attempt a move back toward higher resistance levels around $0.13, $0.15, and $0.19. These are all short-term price levels that can be achieved within a few hours of buying pressure.

The Weekly EMA Signal That Points To Bottoms

Another category of analysis came from Charting Guy, who approached the setup from a broader, long-term angle on the weekly timeframe. He pointed to the relationship between the 20-week exponential moving average and the 200-week exponential moving average on the weekly candlestick price chart.

Dogecoin has tended to form major cycle lows around the period when the 20-week EMA crosses below the 200-week EMA. The interesting thing is that this crossover has just appeared again. Similar crossovers in previous cycles appeared towards the end of extended bearish phases before Dogecoin transitioned into multi-month uptrends.

The weekly price chart spans from 2017 through 2026, showing how previous crosses preceded strong upward expansions. This time, Dogecoin’s price dipped to around $0.09 to $0.10 as the crossover took place.

The most important thing now is how much upside is realistic if this support truly holds. Looking at the weekly structure, a recovery above the 20-week EMA could open the door to a retest of the $0.20 to $0.25 range. Above that, Dogecoin would need better market strength, particularly from Bitcoin, to challenge the higher resistance bands around $0.30 and above.

DOGE trading at $0.10 on the 1D chart | Source: DOGEUSDT on Tradingview.com

Related Questions

QAccording to the article, what is the current key price range that Dogecoin is trading in and why is it significant?

ADogecoin is currently trading in the $0.10 to $0.11 range. This level is significant because it has repeatedly acted as a psychological battleground in past cycles and is a crucial horizontal support region that could determine the coin's next major price direction.

QWhich two analysts are cited in the article and what type of analysis did each provide?

AThe two analysts cited are BitGuru and Charting Guy. BitGuru provided a technical analysis on the daily timeframe, outlining a structure involving a bullish phase, liquidity sweep, and consolidation. Charting Guy provided a long-term analysis on the weekly timeframe, focusing on the relationship between the 20-week and 200-week Exponential Moving Averages (EMAs).

QWhat specific technical event on the weekly chart does Charting Guy suggest has historically signaled a major cycle low for Dogecoin?

ACharting Guy points out that Dogecoin has historically formed major cycle lows around the period when the 20-week Exponential Moving Average (EMA) crosses below the 200-week EMA.

QBased on BitGuru's analysis, what are the three short-term resistance levels Dogecoin could attempt to reach if buying pressure increases?

AAccording to BitGuru, if buying pressure increases, Dogecoin could attempt to move toward the short-term resistance levels of $0.13, $0.15, and $0.19.

QWhat broader market factor does the article mention as necessary for Dogecoin to challenge resistance levels above $0.30?

AThe article states that for Dogecoin to challenge higher resistance bands around $0.30 and above, it would need better overall market strength, particularly from Bitcoin.

Related Reads

Trading

Spot
Futures

Hot Articles

Discussions

Welcome to the HTX Community. Here, you can stay informed about the latest platform developments and gain access to professional market insights. Users' opinions on the price of MEME (MEME) are presented below.

活动图片