Canton Network: Is CC’s 13% breakout based on leverage alone?

ambcryptoPublished on 2026-01-20Last updated on 2026-01-20

Abstract

Canton Network (CC) surged nearly 13% in 24 hours, largely fueled by leveraged trading in perpetual futures, as Open Interest rose by $3.12 million to $21.1 million. However, the rally shows signs of weakness: the funding rate turned negative, indicating growing short positions, and trading volume declined despite rising prices. Although CC broke out of a descending channel, targeting $0.15, momentum is fading. Moving averages suggest bearish pressure, while the RSI at 53 remains mildly bullish but is trending downward. The uptrend appears leverage-driven and vulnerable to a pullback without stronger organic demand.

Over the past 24 hours, Canton Network [CC] has moved sharply higher as liquidity in the market continued to build, recording a gain of nearly 13%.

While the price action appears to have breached a significant technical level on the chart, questions around demand remain unresolved.

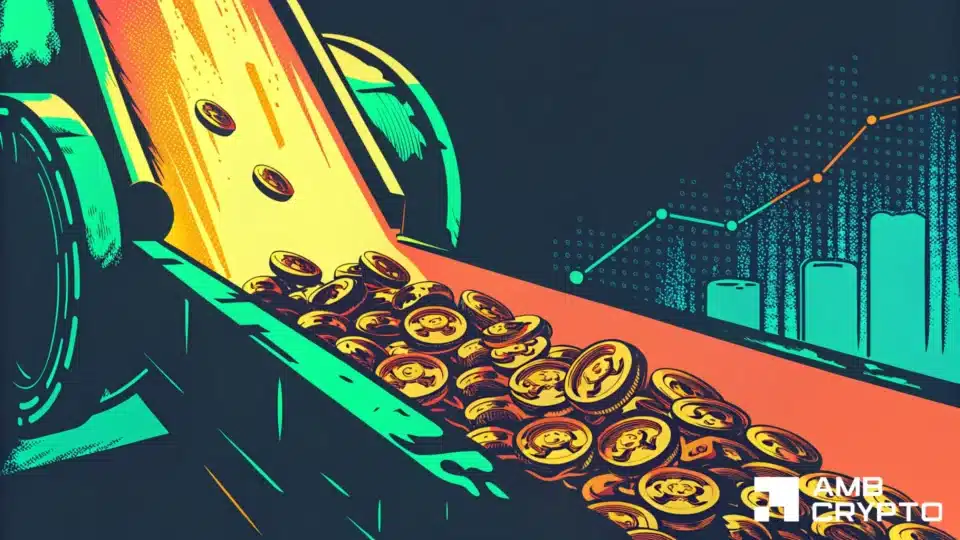
Perpetual traders appear to be the primary force behind the recent gains, raising concerns about the durability of the rally.

Perpetual investors remain the driving force

Available data suggests that CC’s recent price appreciation has been largely fueled by activity in the perpetual futures market.

CoinGlass data showed that during the period in which the asset gained notable price momentum, Open Interest rose sharply.

Open Interest measures the total amount of capital tied up in active perpetual contracts.

In this case, Open Interest climbed to $21.1 million, following an additional inflow of $3.12 million, indicating a surge in leveraged positions.

However, this leverage-driven rally may be vulnerable to a pullback as other sentiment indicators begin to shift.

The Open Interest–Weighted Funding Rate has dropped significantly into negative territory, suggesting that market liquidity is increasingly favoring short positions on CC.

In addition, trading volume has declined even as price continues to rise.

This divergence suggests that the rally lacks strong organic momentum and remains heavily leverage-driven, a combination that often signals increased downside risk.

Bullish breakout still in play

Despite these concerns, the rally has been strong enough to push CC above a key resistance level tied to a well-known bullish structure, the descending channel.

A descending channel consists of two downward-sloping trendlines, with one acting as support and the other as resistance, within which price typically consolidates.

A breakout above the resistance line often signals the potential for further upside, with price targeting the upper boundary of the channel, currently near $0.15 on the chart.

That said, the continuation of this move depends on CC’s ability to firmly hold above the former resistance level. More importantly, overall momentum must turn decisively bullish for the asset to sustain a higher trend.

Momentum begins to fade

Momentum indicators suggest early signs of weakness.

Market analysis using the Moving Average Ribbon, which combines multiple simple moving averages (20, 50, 100, and 200) to assess trend strength, pointed to growing bearish pressure.

At press time, the SMA 100 sat above the SMA 20 and SMA 50, while the SMA 200 also remained above the SMA 20.

When longer-term moving averages dominate shorter-term ones, it often indicates that the prevailing uptrend is losing strength.

This setup implies that price could face a downturn in the near term.

However, traders will closely watch whether the SMA 20 crosses above the SMA 50 or flips the SMA 200, as either move could signal renewed bullish momentum.

The Relative Strength Index (RSI), which measures momentum based on the speed and magnitude of price changes, shows that CC still retains some strength.

The RSI remains within the bullish zone between 50 and 70 and currently reads 53. Although the indicator is trending lower, it still leaves room for a potential rebound as long as it holds above the neutral threshold.


Final Thoughts

  • CC rallied on leveraged bets, but momentum signals from volume and Funding Rates failed to confirm the move.
  • Moving averages warned that the upside may be short-lived, with the RSI pointing to a similar outlook.

Related Questions

QWhat was the primary driver behind Canton Network's (CC) 13% price surge according to the article?

AThe article states that the recent price appreciation was largely fueled by activity in the perpetual futures market, indicating that leveraged positions from perpetual traders were the primary force behind the gains.

QWhat does the significant drop into negative territory for the Open Interest-Weighted Funding Rate suggest about the market?

AIt suggests that market liquidity is increasingly favoring short positions on CC, indicating a bearish sentiment among traders.

QWhat key technical pattern did CC's price break out of, and what is the potential price target mentioned?

ACC broke out above the resistance line of a descending channel. The potential upside target is the upper boundary of that channel, which is near $0.15.

QAccording to the Moving Average Ribbon analysis, what does it mean when longer-term moving averages dominate shorter-term ones?

AWhen longer-term moving averages (like the SMA 100 and 200) are above shorter-term ones (like the SMA 20 and 50), it often indicates that the prevailing uptrend is losing strength and that bearish pressure is growing.

QWhat is the current reading and implication of the Relative Strength Index (RSI) for CC?

AThe RSI reads 53, which is within the bullish zone (50-70). Although it is trending lower, it indicates that CC still retains some strength and has room for a potential rebound as long as it holds above the neutral threshold of 50.

Related Reads

Fei-Fei Li's Team Clarifies the Concept of 'World Models', Sora Merely a Renderer

"World Models" has become a widely used yet confusing term in AI. To address this, a team led by Fei-Fei Li and World Labs proposed a functional taxonomy based on the Partially Observable Markov Decision Process framework. This taxonomy categorizes systems called "world models" into three distinct projections: Renderers, Simulators, and Planners. Renderers, like OpenAI's Sora and other video generation models, focus on producing photorealistic visual outputs for human perception. They prioritize visual fidelity over physical accuracy. Simulators, such as NVIDIA Omniverse, aim to compute precise future environmental states for computational tasks like engineering analysis or digital twins. Planners, like Vision-Language-Action models, take in observations and goals to output executable actions for robots or agents. The article clarifies that most current "world models," including Sora, are primarily Renderers. They generate convincing visuals but lack the core ability to simulate state transitions based on actions, a key requirement for a true world model in classic reinforcement learning definitions. This conceptual confusion has practical implications, leading to potential misalignment in technology selection, investment, and public understanding of AI capabilities. Clear categorization is crucial. It helps enterprises avoid costly mistakes (e.g., using a renderer for robot training), allows investors to accurately assess markets, and enables researchers to build comparable benchmarks. While future systems may integrate these functions, recognizing current boundaries is essential for honest assessment and progress.

marsbit18m ago

Fei-Fei Li's Team Clarifies the Concept of 'World Models', Sora Merely a Renderer

marsbit18m ago

Bloomberg Uncovered: How Do China's Wealthy Circumvent the Annual $50,000 Limit to Transfer Assets?

**Summary: How Wealthy Chinese Circumvent $50,000 Annual Foreign Exchange Limits** Despite China's strict capital controls, including an annual $50,000 per person foreign exchange quota, an estimated $150 billion in funds still leaves the country annually via various gray and underground channels. This report outlines the evolution of China's "capital wall" and the methods used to bypass it. **The Evolving Capital Controls:** * **Foundation (1994):** The system of "current account convertibility with strict capital account controls" was established. * **Quota Set (2007):** The $50,000 individual annual forex purchase limit was formalized. * **Crackdown Begins (2015-2017):** Following market volatility, enforcement tightened. Banks were required to scrutinize transactions, and channels like using UnionPay cards for Hong Kong insurance premiums or buying overseas property were blocked. * **Digital & Legal Upgrades (2024-2026):** Enhanced algorithms now flag suspicious patterns (e.g., "smurfing"). The Common Reporting Standard (CRS) provides Chinese tax authorities with data on citizens' offshore accounts. Unlicensed cross-border brokers have been targeted. **Five Primary Methods for Moving Capital:** 1. **Underground Banking / "Hawala" (Duiqiao):** The largest-scale method. No money crosses borders. Clients pay RMB to a domestic account; an overseas associate deposits equivalent foreign currency into the client's offshore account. Risks include high fees, account freezes, and legal penalties. 2. **"Smurfing" or "Ant Moving":** Using multiple individuals' $50,000 quotas to pool funds for one offshore recipient. Increasingly detected by anti-money laundering algorithms. 3. **Trade Invoice Manipulation:** Businesses over-invoice imports or under-invoice exports via offshore shell companies, creating a pretext to transfer excess funds abroad under the guise of trade. 4. **Channel Migration:** After a crackdown on internet brokers, funds flow toward more compliant but costly channels like major banks' cross-border wealth management services or Qualified Domestic Institutional Investor (QDII) quotas. 5. **Structural Arrangements:** High-net-worth individuals use complex, high-cost legal structures involving offshore trusts, insurance, and investment migration programs to transfer asset ownership. **Regulatory Response: Focusing on People, Not Just Money** The current strategy extends oversight from enterprises to **individual residents**. Tools like CRS allow retroactive visibility into offshore assets. Cryptocurrencies, once seen as a potential loophole, are now actively monitored and prosecuted as an illegal channel. The underlying driver remains: with significant wealth concentrated among millions of affluent households seeking diversification amid domestic economic shifts, the incentive to move assets offshore persists despite regulatory barriers.

marsbit38m ago

Bloomberg Uncovered: How Do China's Wealthy Circumvent the Annual $50,000 Limit to Transfer Assets?

marsbit38m ago

Ethereum's Ballmer Moment: As Everyone Is Bearish, the Circulating Supply Is Disappearing

"Ethereum's Ballmer Moment: Circulation Shrinks Amid Bearish Sentiment" Amid widespread bearish sentiment, with prominent figures like Bankless founder David Hoffman selling ETH and young developers flocking to Solana, some argue Ethereum is entering its "Ballmer era"—akin to Microsoft's perceived stagnation under Steve Ballmer. While surface-level criticisms about slow protocol development, cautious leadership, and competitive pressure are valid, underlying fundamentals tell a different story. Approximately 30% of ETH is staked, major holders like BitMine are accumulating, and spot ETFs continue to absorb supply. Regulatory clarity, including the SEC/CFTC's March ruling on staking rewards and the potential passage of the CLARITY Act, is transforming crypto from a regulatory threat into a legitimized framework. This institutionalization, alongside a shrinking circulating supply (with net issuance around 0.23% annually), creates significant buy-side pressure independent of fee-based value capture. The broader crypto total addressable market is expanding through regulated stablecoins, tokenized assets, and institutional adoption. While public chains face competition from permissioned alternatives, the winning model appears to be permissioned assets settling on public chains like Ethereum and Solana. The author advocates a non-maximalist, barbell strategy: holding ETH for its institutional role and supply squeeze, SOL for consumer/throughput trends, BTC as a macro hedge, and a basket of next-gen L1s. Key bullish drivers for ETH include rapid circulation shrinkage, potential Q2 staked ETF approvals, regulatory tailwinds solidifying its role as a default settlement layer, and the optionality of an eventual "Satya moment" leadership shift. Despite bearish consensus, the current setup—where crypto is "not hot" and regulatory groundwork is being laid—presents a compelling investment opportunity. The crypto cycle's focus may have shifted to AI, but blockchain infrastructure is gaining a legal and institutional foothold precisely while attention is elsewhere.

marsbit38m ago

Ethereum's Ballmer Moment: As Everyone Is Bearish, the Circulating Supply Is Disappearing

marsbit38m ago

Trading

Spot
Futures
活动图片