Can MemeCore clear $1.28 resistance? THIS setup hints at…

ambcryptoPublished on 2026-07-07Last updated on 2026-07-07

Abstract

MemeCore's token M faced an 11% daily decline, erasing a portion of its recent 111% weekly gains. Underlying data shows increased selling pressure, particularly in the perpetual derivatives market where selling volume outpaces buying. The price is testing key resistance at $1.28 within a symmetrical triangle pattern, with a breakout direction pending. Spot market activity shows a slight net inflow and ongoing accumulation, while whale wallets have begun accumulating as retail participation weakens. This mixed picture suggests the near-term trend hinges on whether whale support and spot demand can overcome the heavy selling pressure in leveraged markets.

MemeCore’s native token M has extended its decline over the past 24 hours, losing roughly 11% even as the memecoin-focused blockchain retained a 111% gain over the past seven days.

On the surface, that pullback erases only about a tenth of M’s accumulated gains and reads as a routine corrective phase.

The underlying data tells a different story, with sellers gaining ground across the market in a way that could drag the asset lower from current levels.

Is selling pressure getting stronger?

Capital is contracting across MemeCore’s markets, with the gap between spot and perpetual traders narrowing as fresh flows move into the derivatives side.

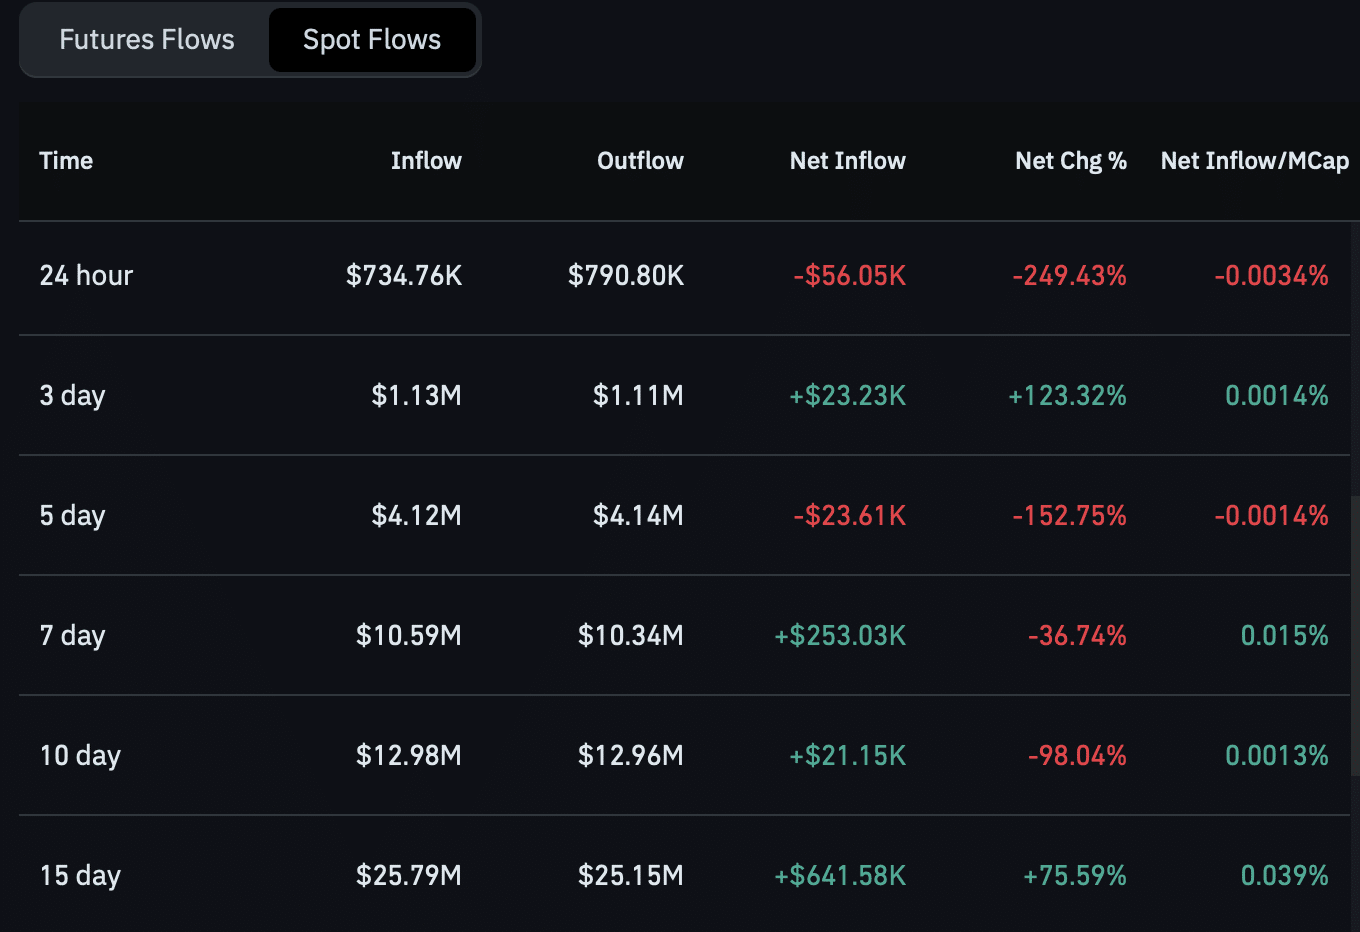
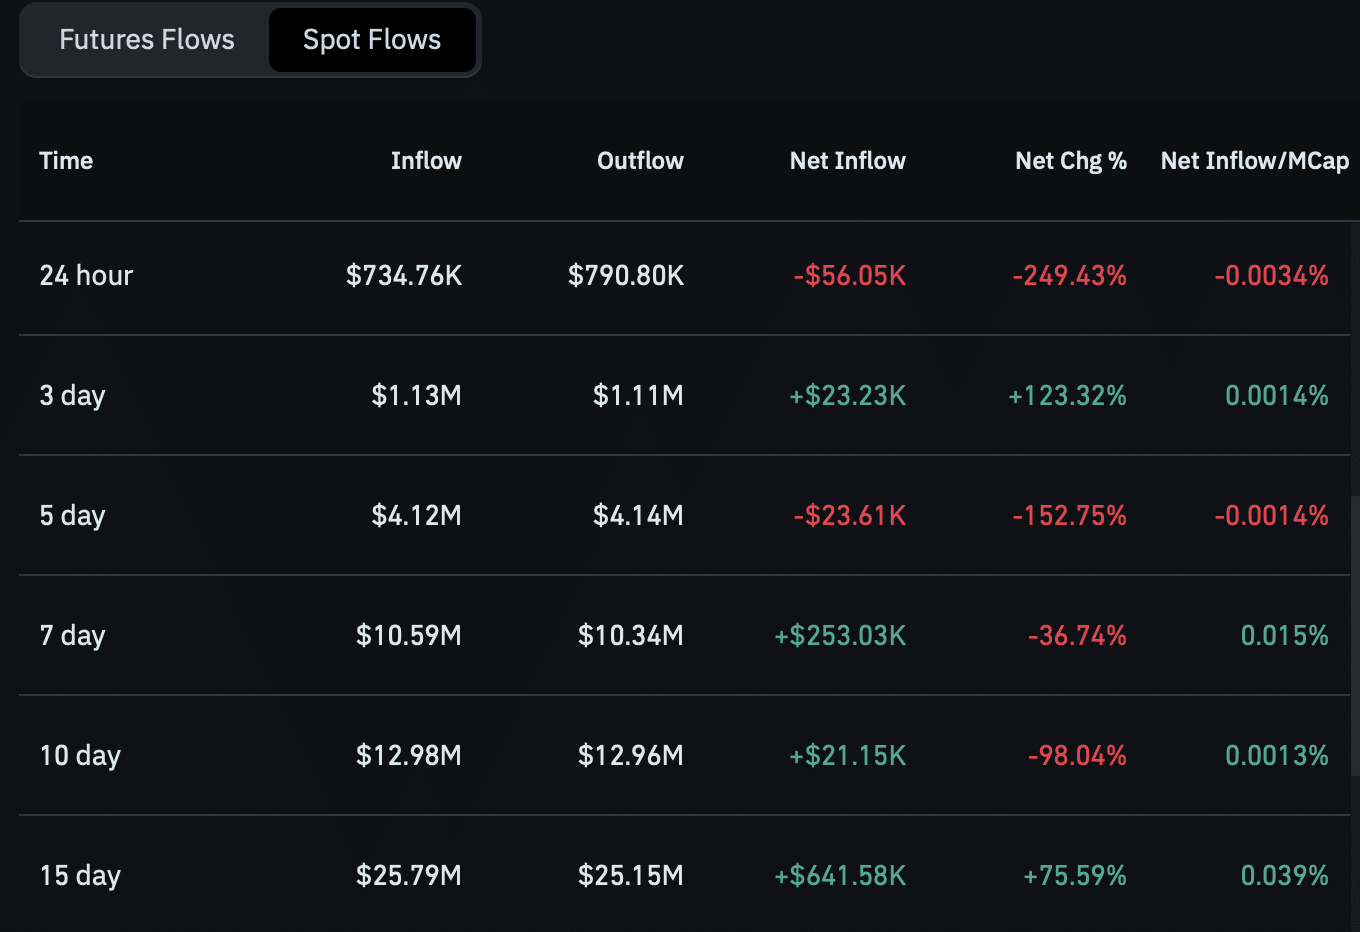
Spot Netflow data showed buyers absorbed roughly $790,000 worth of M, while sellers offloaded about $743,000, leaving a slim net inflow of around $56,000.

That balance tilts toward buyers, yet the edge is too thin to spark a decisive rally, and the imbalance sharpens in the perpetual market, where rising inflows are colliding with heavy selling volume.
Source: CoinGlass

MemeCore’s perpetual contracts drew a netflow of roughly $668,200, pointing to more capital channeled into leveraged positions on M. That inflow skews toward sellers, though, the Taker Buy Sell Ratio has slid to 0.823 in the latest CoinGlass reading, meaning market sells are outpacing market buys.

Mounting sell pressure in the perpetual market, set against shrinking spot capital, leaves M in a tight spot as it tries to rebuild momentum for a near-term move higher.

MemeCore [M] tests a major level

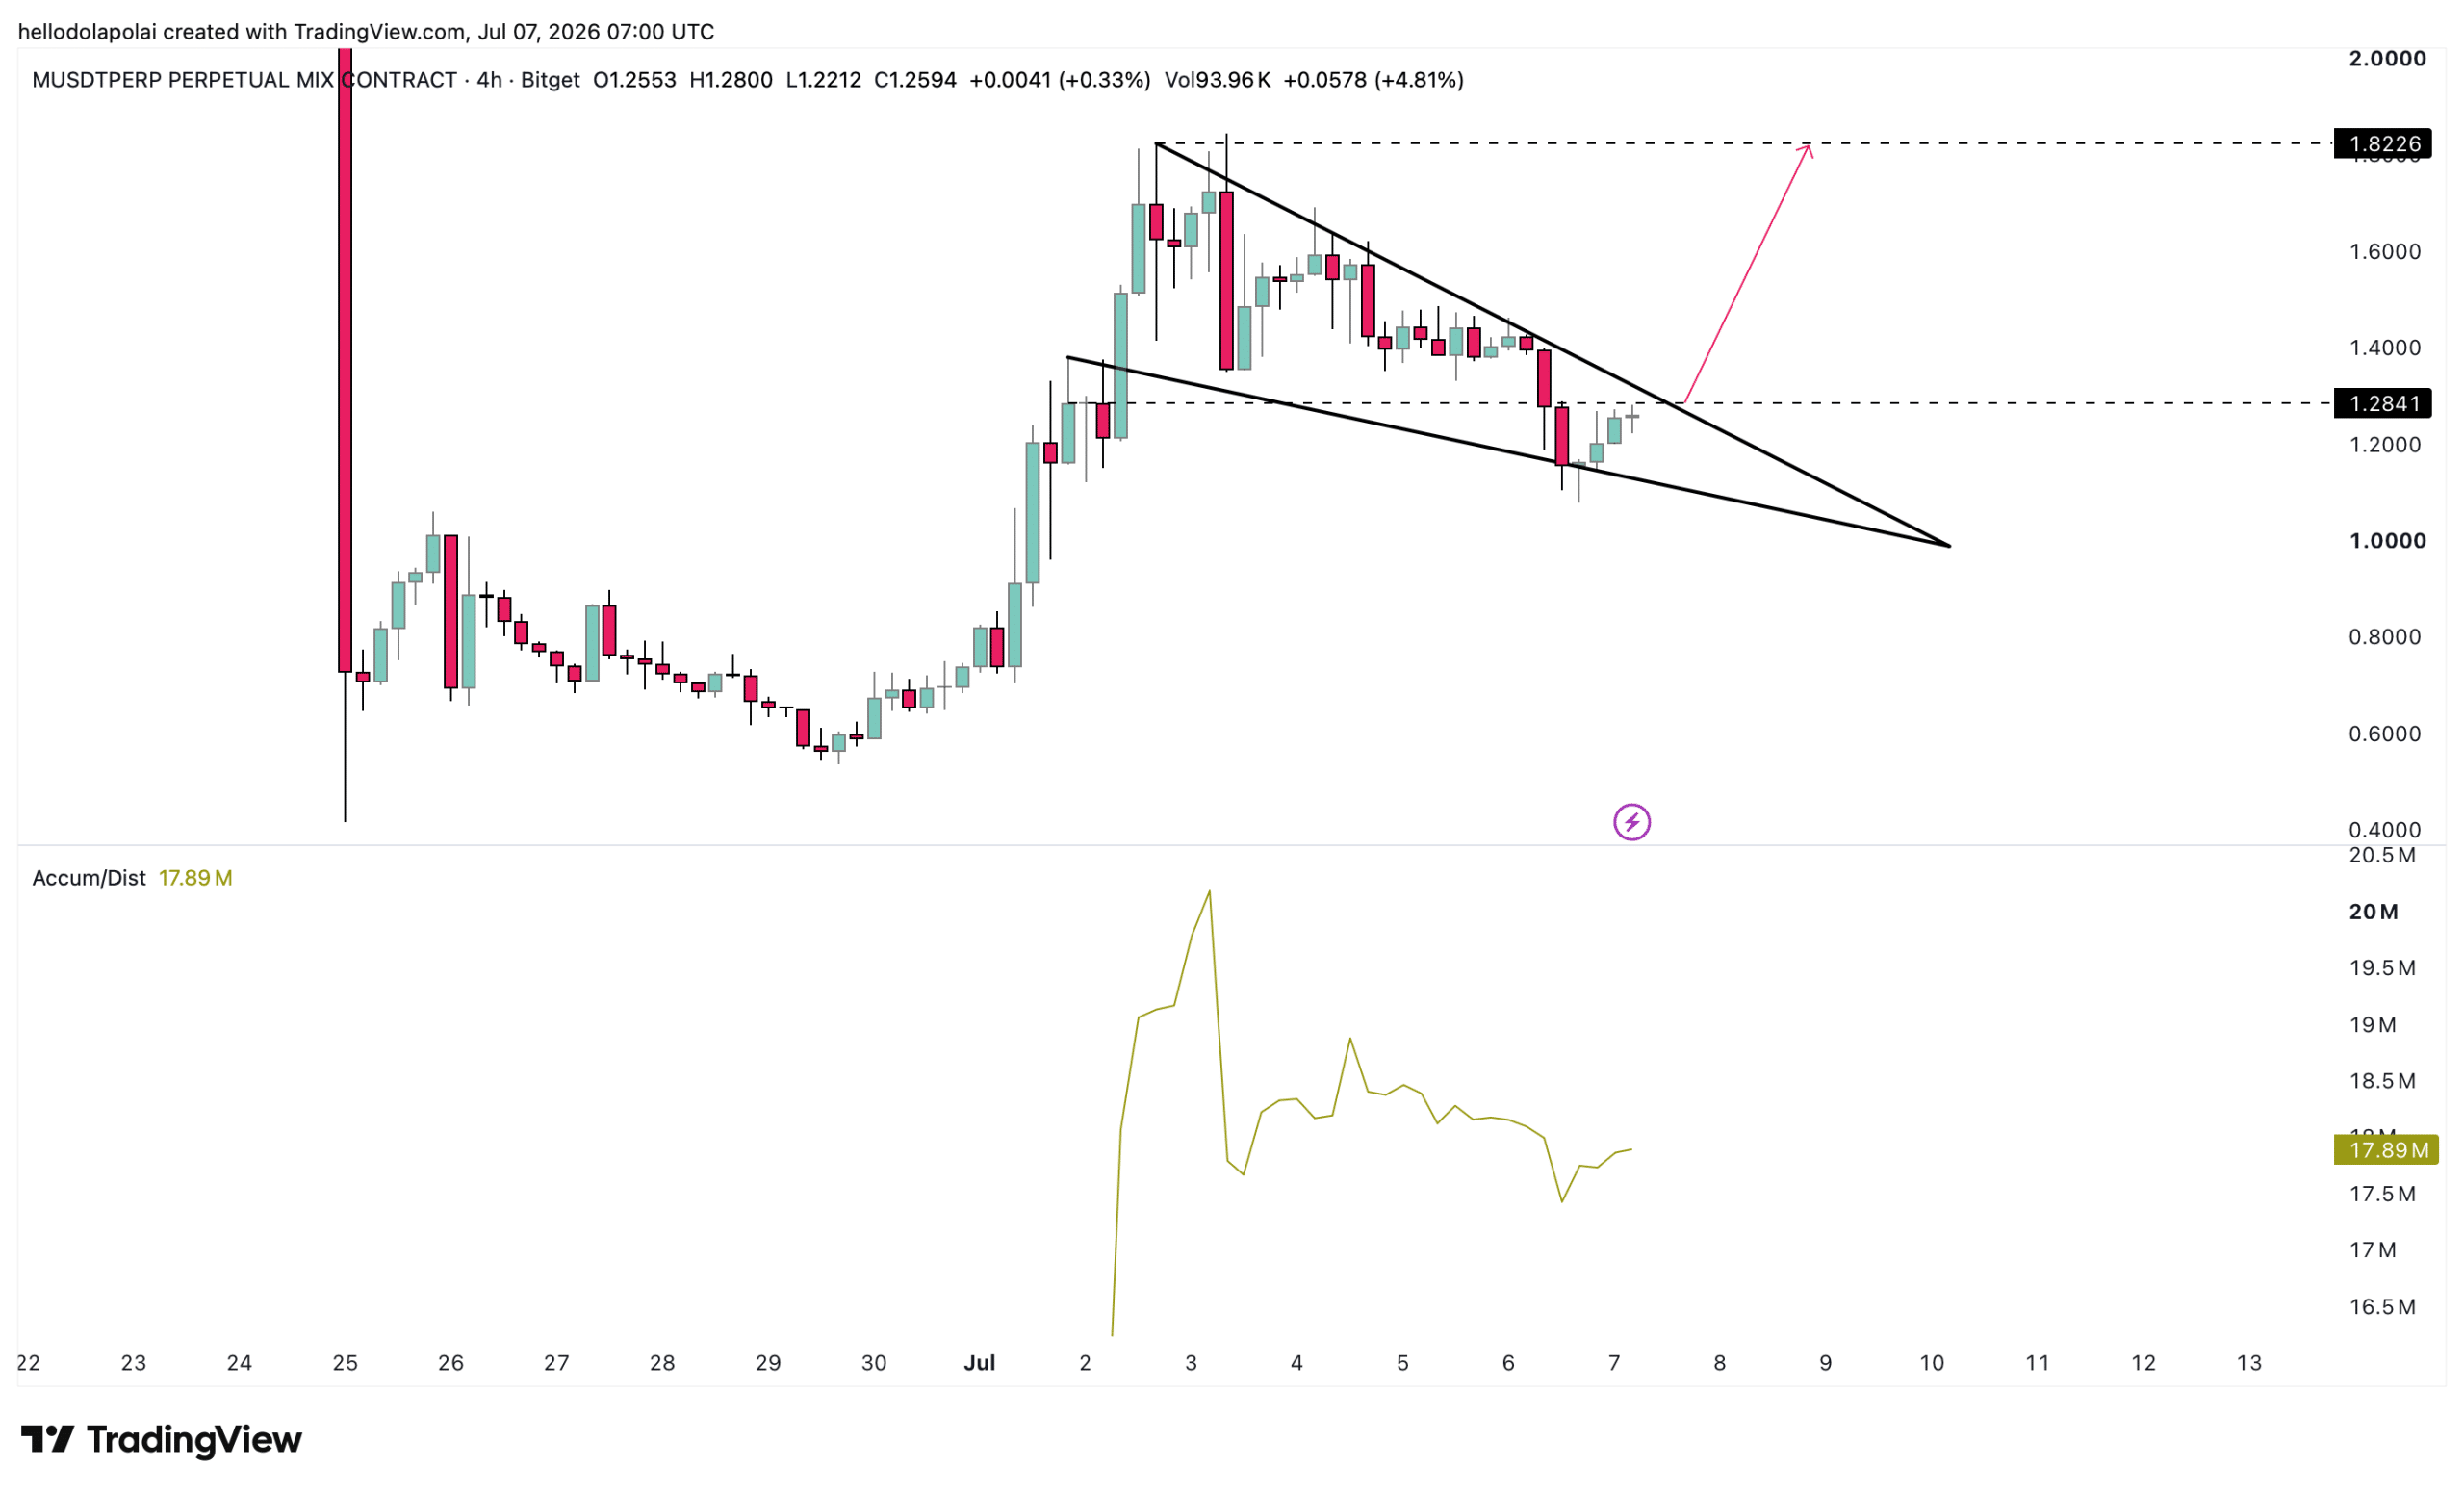
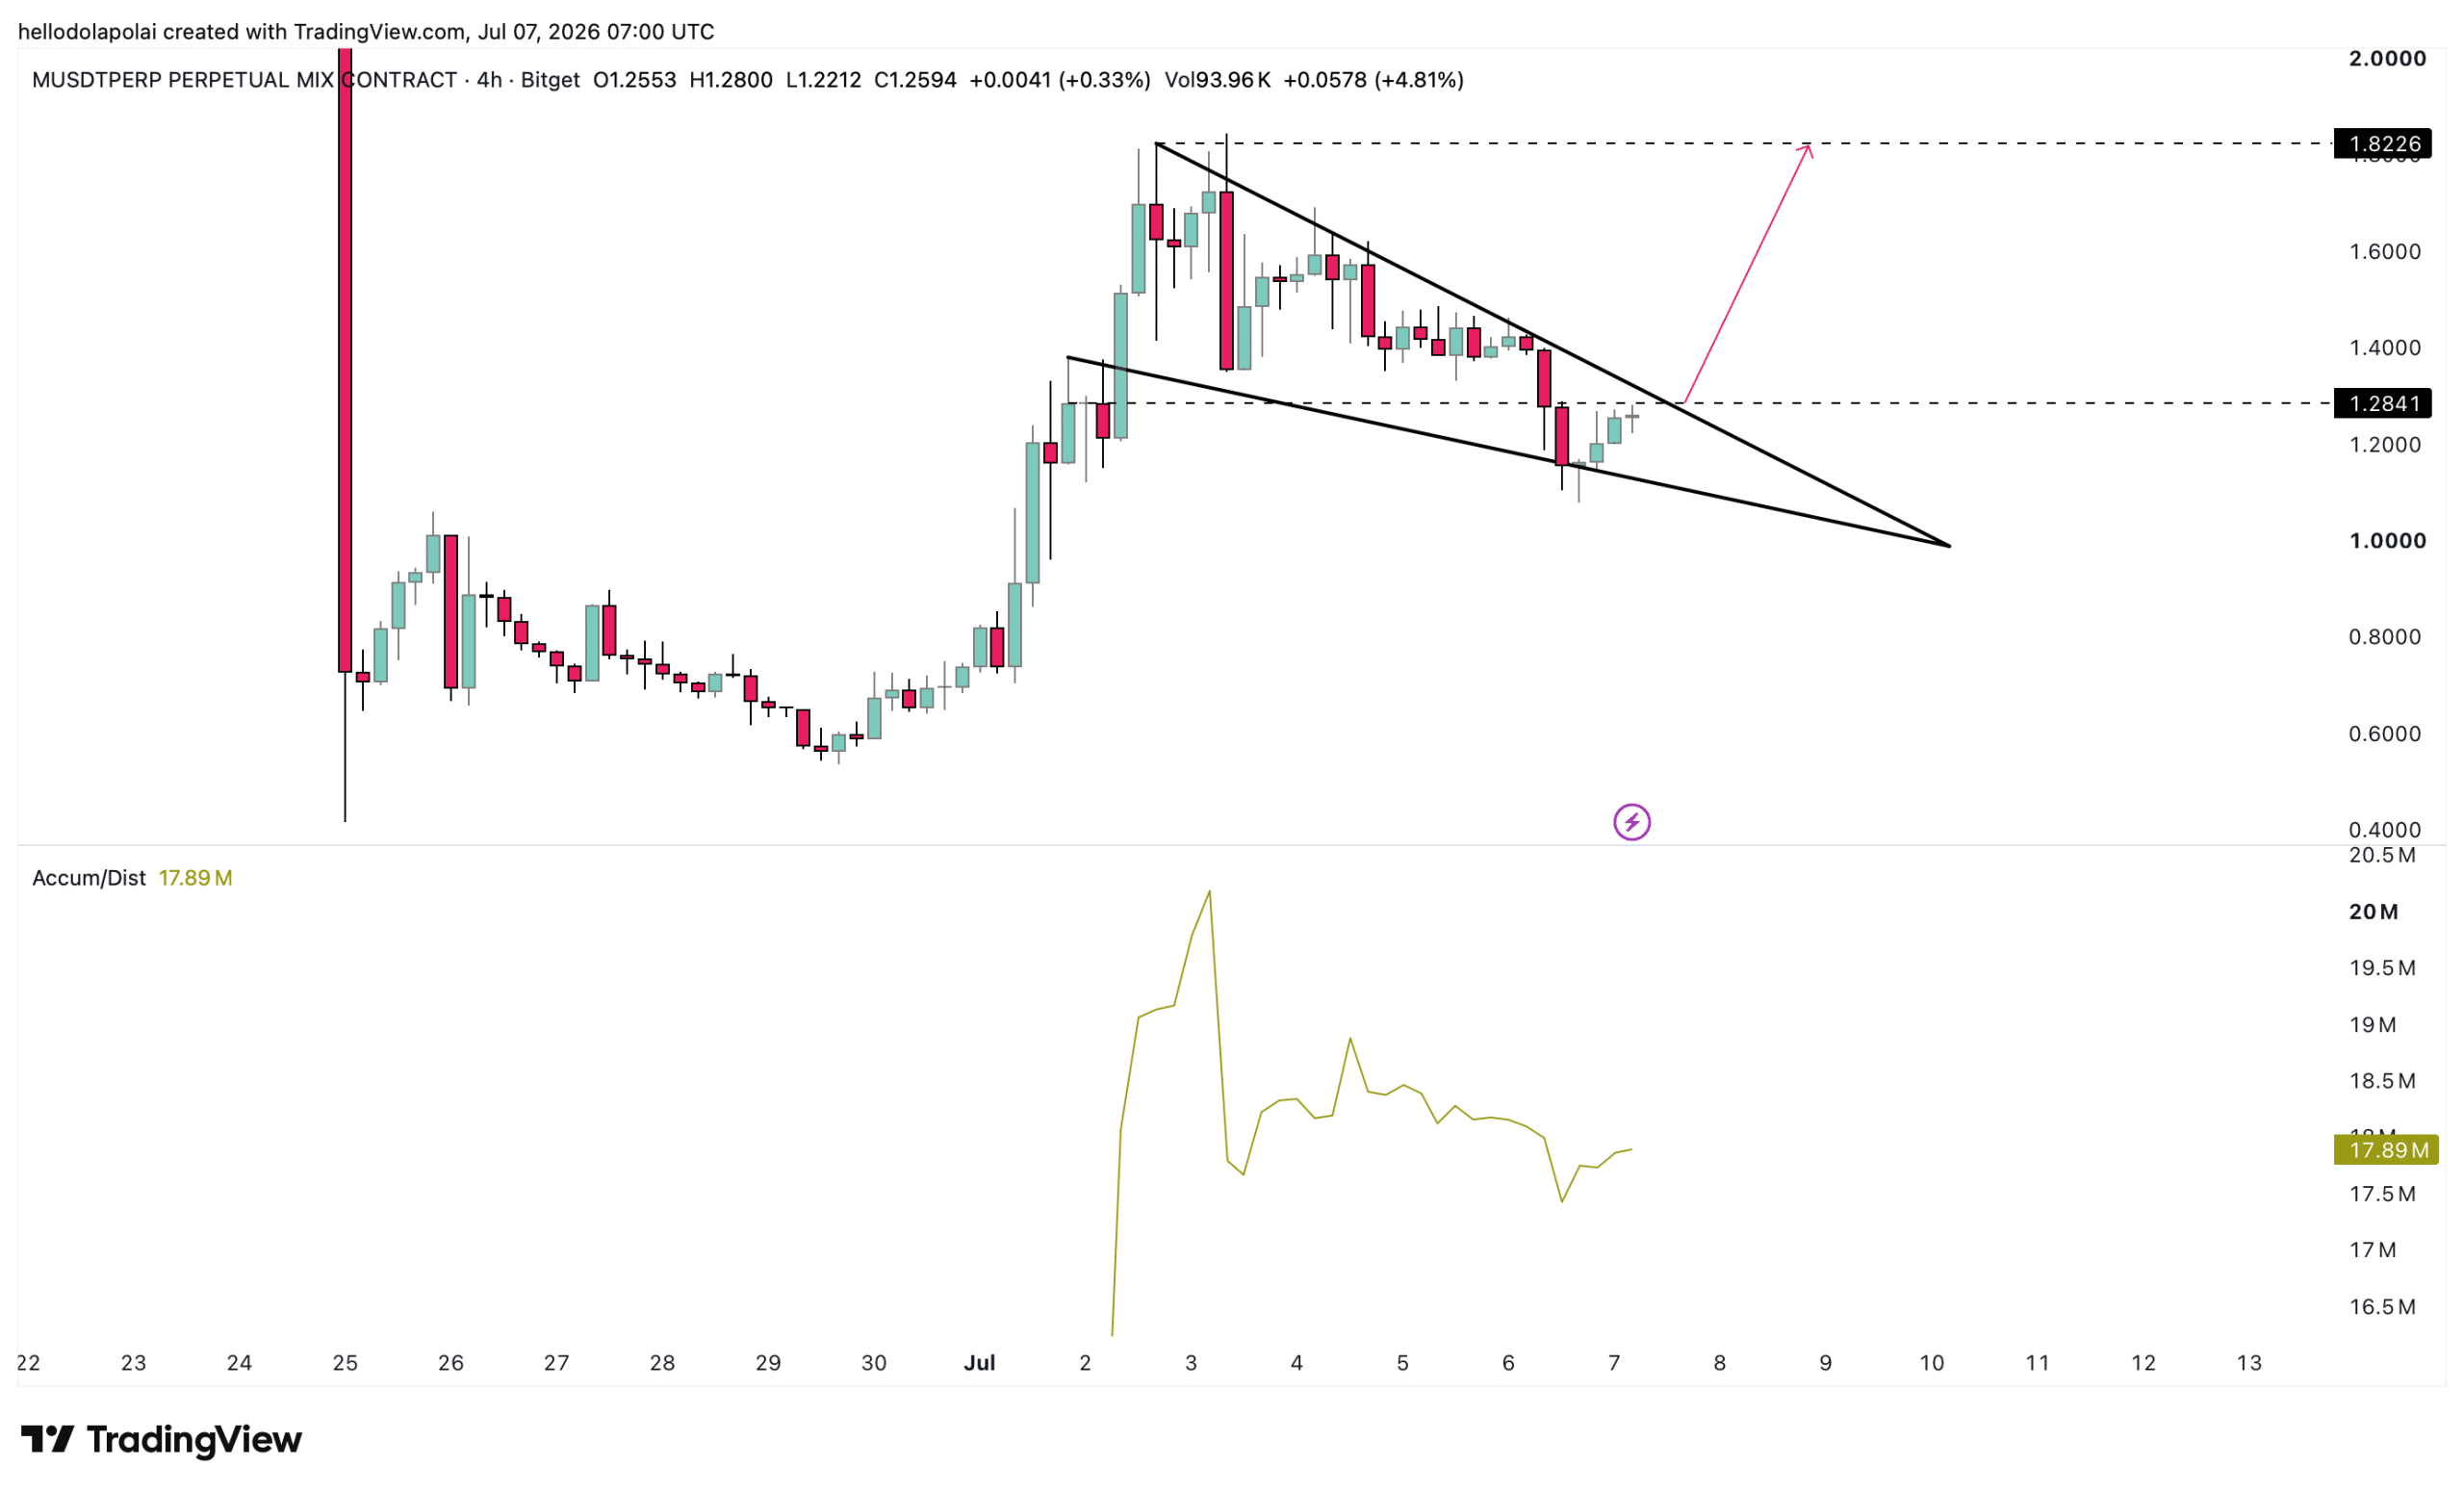
MemeCore traded inside a symmetrical triangle pattern.

The formation typically develops after a sharp price advance as the price consolidates between converging support and resistance lines. The pattern often precedes a breakout.

M now needed to clear horizontal resistance at $1.28.

A break above that level would still leave the price facing the pattern’s descending resistance. Clearing both barriers could confirm a stronger bullish move, while another rejection would likely extend consolidation.
Source: TradingView

Reinforcing the setup, the Accumulation/Distribution (A/D) indicator is climbing, a sign that buying has outweighed selling across the broader market.

A sustained rise in the indicator would show accumulation building beneath the price, a dynamic that tends to support M over time.

Whales accumulate as retail steps back

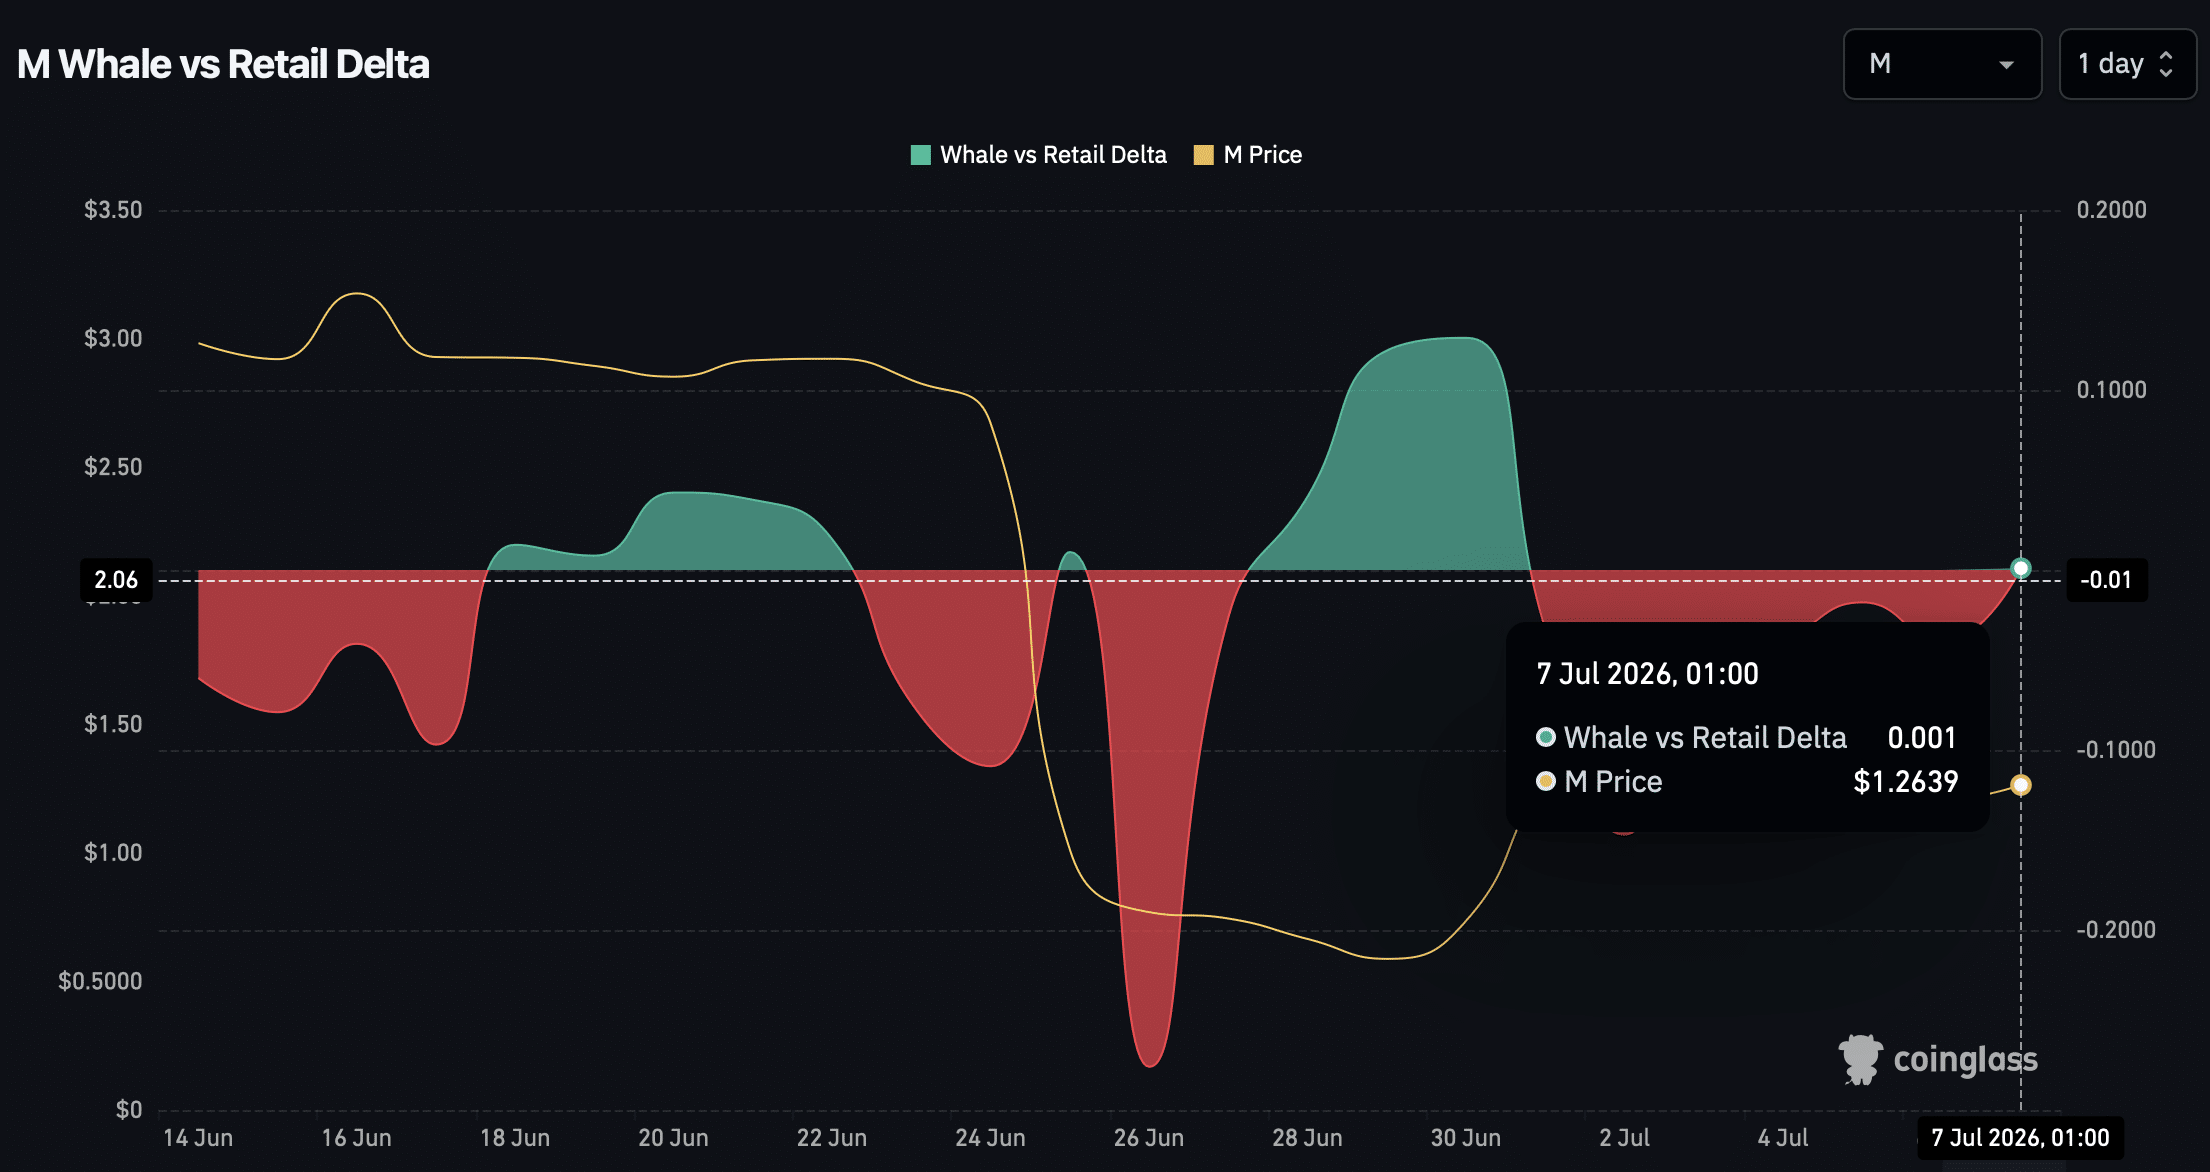
The Whale-to-Retail Delta recently flipped positive, though only marginally, at 0.01, a slim edge for large holders over retail participants.

That shift points to whales stepping in while retail investors are exiting.

Whales hold deep capital that frequently steers market direction, and their positioning could prove decisive in whether M resumes its slide or turns higher.
Source: CoinGlass

Even so, Spot buying continued outweighing selling, while most bearish pressure originated from the perpetual market. The A/D indicator also continued pointing toward accumulation.

If whale accumulation continues supporting Spot demand, M could strengthen its rebound and build on the gains recorded over recent weeks.


Final Summary

  • MemeCore’s 11% decline coincided with growing selling pressure in perpetual markets despite positive Spot Netflow.
  • Whales accumulated while retail activity weakened, offering early signs of underlying confidence.


Trending Cryptos

Related Questions

QAccording to the article, what are the key indicators showing that selling pressure is increasing in the MemeCore (M) market?

AThe key indicators showing increasing selling pressure include: 1) A narrowing gap between spot and perpetual markets as capital flows into derivatives. 2) A Taker Buy Sell Ratio in perpetual contracts sliding to 0.823, indicating market sells are outpacing market buys. 3) Perpetual market netflows of $668.2k skewing towards sellers, contrasting with shrinking spot capital.

QWhat price level must MemeCore's token M clear, and what technical pattern is it currently trading within?

AThe token M must clear the horizontal resistance level at $1.28. It is currently trading within a symmetrical triangle pattern, which developed after a sharp price advance and represents a period of consolidation.

QWhat does the positive Whale-to-Retail Delta value of 0.01 signify for the M token market?

AA Whale-to-Retail Delta value of 0.01, while marginal, signifies that large holders (whales) have begun accumulating the token while retail investors are stepping back or exiting their positions.

QWhat is the significance of the rising Accumulation/Distribution (A/D) indicator mentioned in the analysis?

AA rising Accumulation/Distribution (A/D) indicator signifies that buying pressure has outweighed selling pressure across the broader market. It suggests accumulation is building beneath the current price, which is a dynamic that tends to support the asset's price over time.

QWhat two conditions, according to the final summary, coincided with MemeCore's 11% price decline?

AAccording to the final summary, the 11% price decline coincided with: 1) Growing selling pressure in perpetual markets. 2) Despite this, a positive Spot Netflow (indicating more spot buying than selling).

Related Reads

Strive Executive: Rethinking the Bitcoin Price Flywheel

In this article, the author discusses the future trajectory of Bitcoin's price, moving beyond the traditional "power law" model that has described its long-term price appreciation with diminishing returns. The core argument is that Bitcoin is maturing, evidenced by declining volatility and shallower market drawdowns. This maturation, often seen as leading to permanently lower returns, is framed as a precursor to a new, potentially explosive phase. The author draws an analogy to metal fatigue, where cracks propagate in three stages: initial irregular formation, a predictable middle phase describable by a power law (Paris' law), and a final rapid acceleration leading to fracture. Similarly, Bitcoin's monetization is seen in three phases: 1) Discovery (high volatility/returns), 2) Maturation (declining volatility/returns, improving risk-adjusted metrics), and 3) System-driven monetization. The key insight is that Phase 2 sets the stage for Phase 3. Lower volatility makes Bitcoin a more attractive asset for large-scale capital allocation (due to improved Sharpe ratios) and, crucially, a higher-quality collateral for loans. As perceived credit risk falls, the financial system can safely extend more dollar-denominated credit against Bitcoin holdings. This creates a self-reinforcing "flywheel": lower volatility → more capital allocation & cheaper credit → increased demand for fixed-supply Bitcoin → price rise → higher collateral value enabling more credit → continued price pressure. The conclusion posits that even if Bitcoin adoption eventually plateaus (reaching an S-curve saturation), the expansion of capital and credit chasing a fixed supply could cause its USD price to re-accelerate, breaking above the long-term power-law trajectory and entering the "third region" of rapid, system-driven monetization.

marsbit6h ago

Strive Executive: Rethinking the Bitcoin Price Flywheel

marsbit6h ago

Trading

Spot

Hot Articles

Discussions

Welcome to the HTX Community. Here, you can stay informed about the latest platform developments and gain access to professional market insights. Users' opinions on the price of S (S) are presented below.

活动图片