Aggregate Analysis Beyond Price: Glassnode Global Metrics

insights.glassnodePublished on 2026-06-03Last updated on 2026-06-03

Abstract

Glassnode Global Metrics introduce a suite of aggregated on-chain and market metrics designed to analyze the dynamic crypto market without the distortions caused by asset reclassifications. The framework offers two data types: Raw Aggregates (original units) and scaled, base-100 Indices for continuous trend analysis. The article demonstrates the power of these indices through three examples. First, they reveal a dramatic 2024 small-cap rally invisible in raw data, where "winner" assets leaving the basket bias the raw series. Second, they provide a clearer view of profit-taking sentiment across market-cap cohorts, showing that small-cap holder sentiment is more stable than raw SOPR data suggests. Third, they isolate leverage behavior in derivatives, highlighting the higher volatility of open interest in mid- and small-cap assets during speculative phases. Currently live metrics include Total Market Cap, Median SOPR, Total Open Interest, and others, calculated for All Coins, Large, Mid, and Small Cap baskets with weekly rebalancing. The data is accessible via dedicated API endpoints for both raw and indexed series, bringing the continuity of traditional finance indices to multi-asset crypto analytics.

Aggregate market analysis has become a challenge since the digital asset space has fragmented into thousands of assets, sectors, and rapidly changing market-cap cohorts. As assets appreciate, decline, launch, or disappear, aggregate metric series develop structural discontinuities that make long-term analysis difficult.

Previously, we showcased the power of global views that aggregate metrics across the market using our Multi-Asset Explorer. We have now extended this framework with Glassnode Global Metrics — a suite of formally rebalanced aggregate metrics with continuous index normalization, available via API.

In this article, we introduce the framework, examine several examples across market capitalization, profitability, and derivatives positioning, and show what continuity-adjusted indices reveal relative to raw aggregates.

What are Glassnode Global Metrics?

Global Metrics are aggregated on-chain and market metrics computed across multiple cryptocurrencies, organized into configurable baskets. Baskets can be defined by market capitalization thresholds, top-N rankings (by any metric), or asset tags (sectors, categories). They solve a fundamental challenge in crypto analytics: how to track on-chain and market metrics across a highly dynamic group of assets over time without artificial discontinuities caused by basket composition changes, in contrast to indices that focus on price alone.

We provide two output types for each metric:

  • Raw Aggregates: True values in original units preserving economic meaning (e.g., USD for market cap, counts for active addresses)
  • Indices: Scaling-factor-adjusted, base-normalized time series for trend analysis and cross-basket comparison

What the indices reveal

Market structure: the 2024 small-cap surge

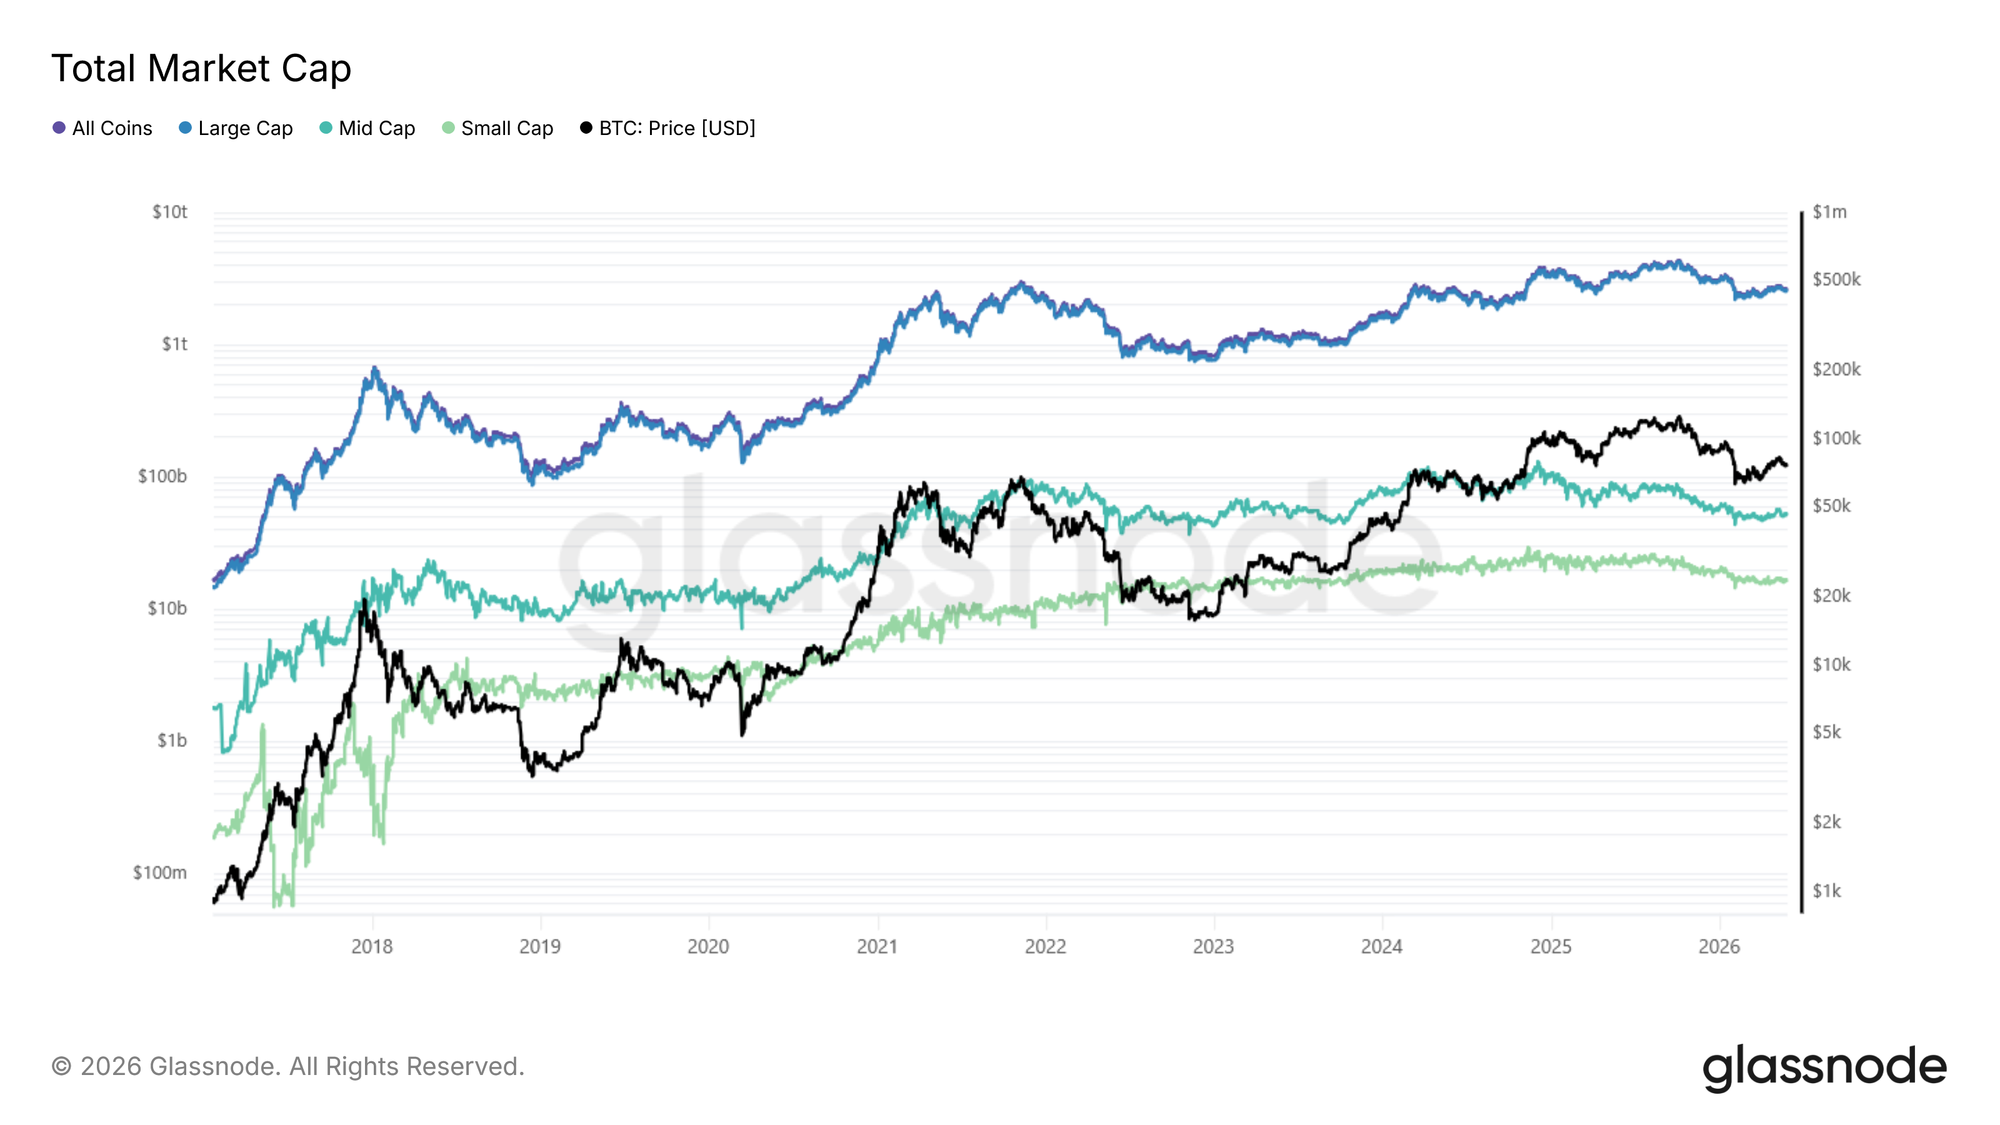
The clearest demonstration of why continuity-adjusted indices matter is the small-cap tier in 2024. The below figure presents Total Market Cap: Raw aggregate (USD, log scale) across all four baskets: All Coins, Large, Mid and Small Cap, with BTC price overlaid.
View Live Metric

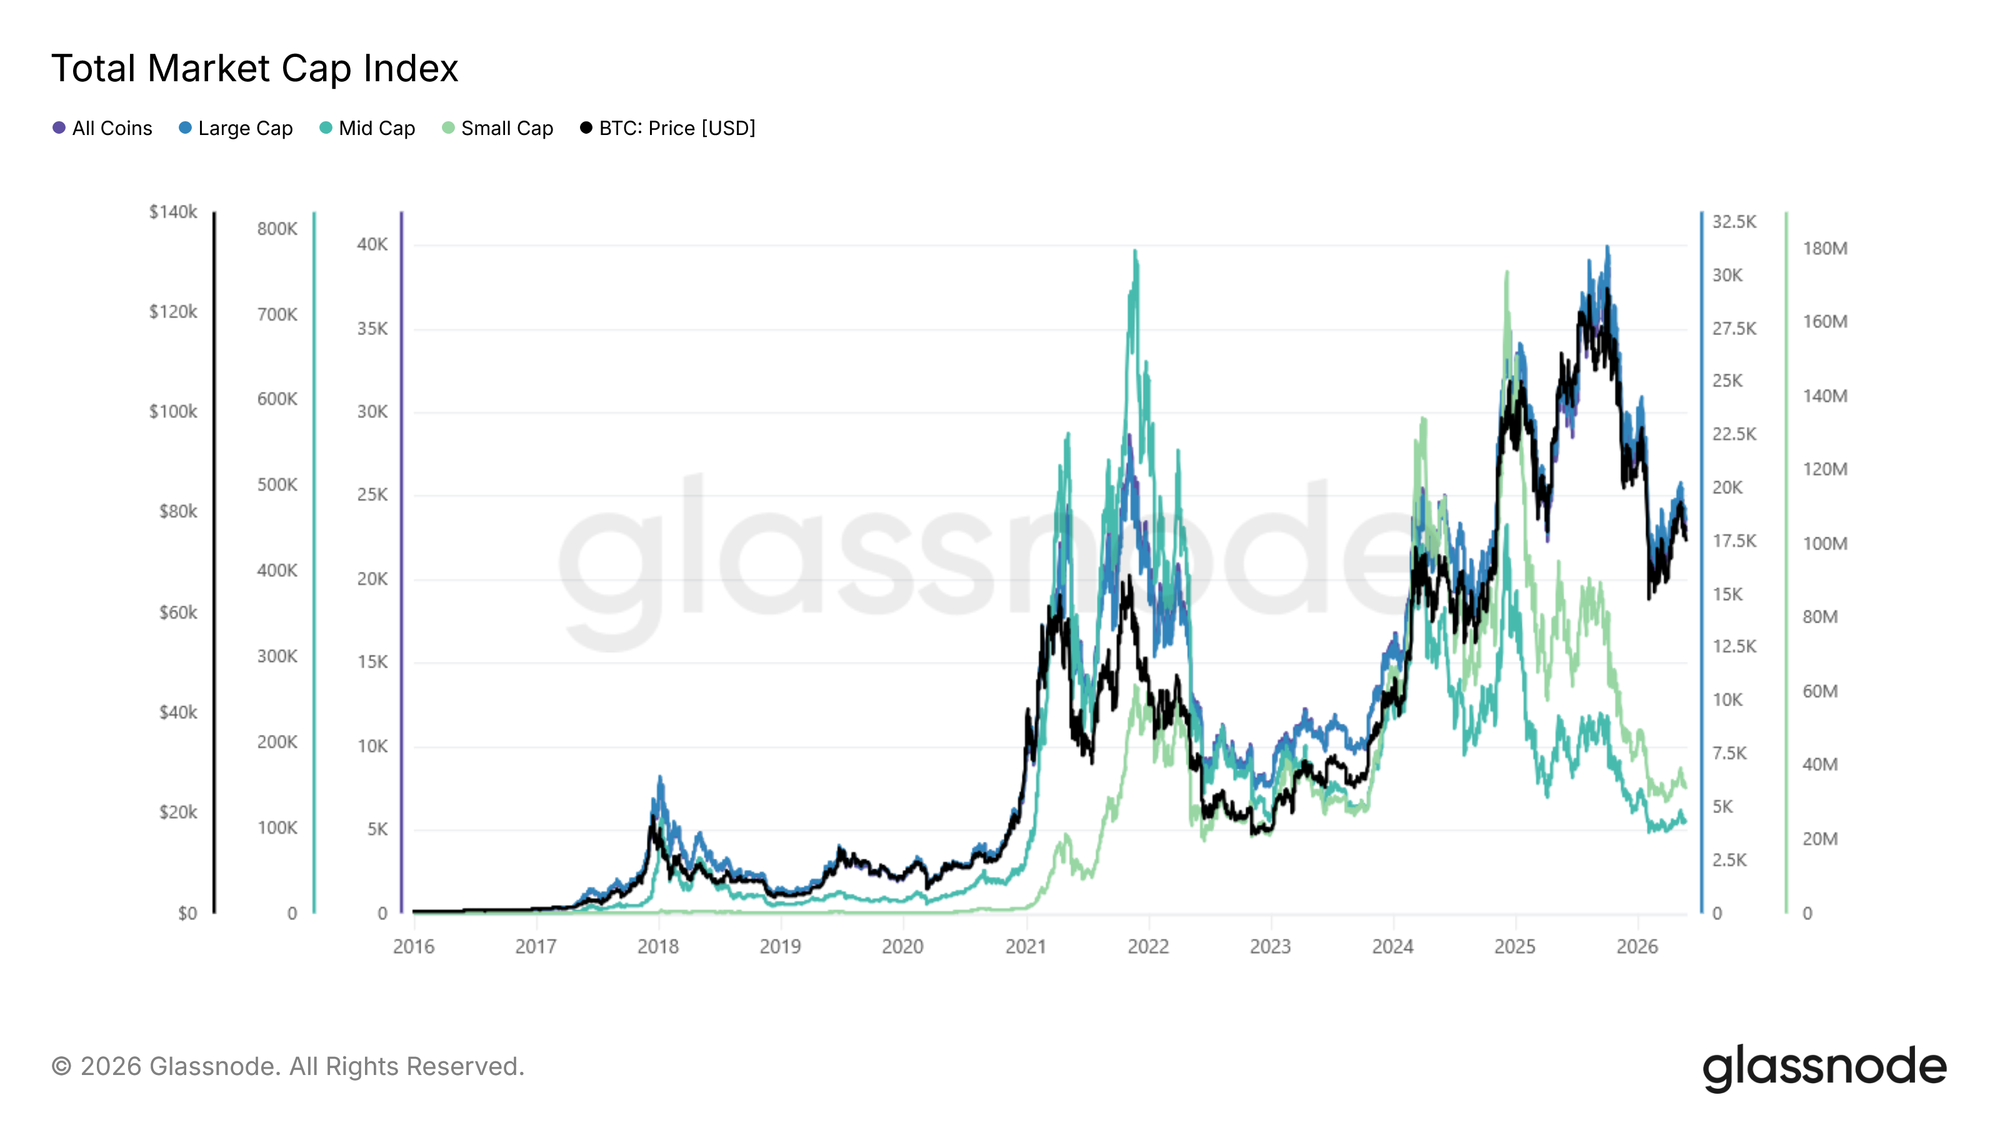
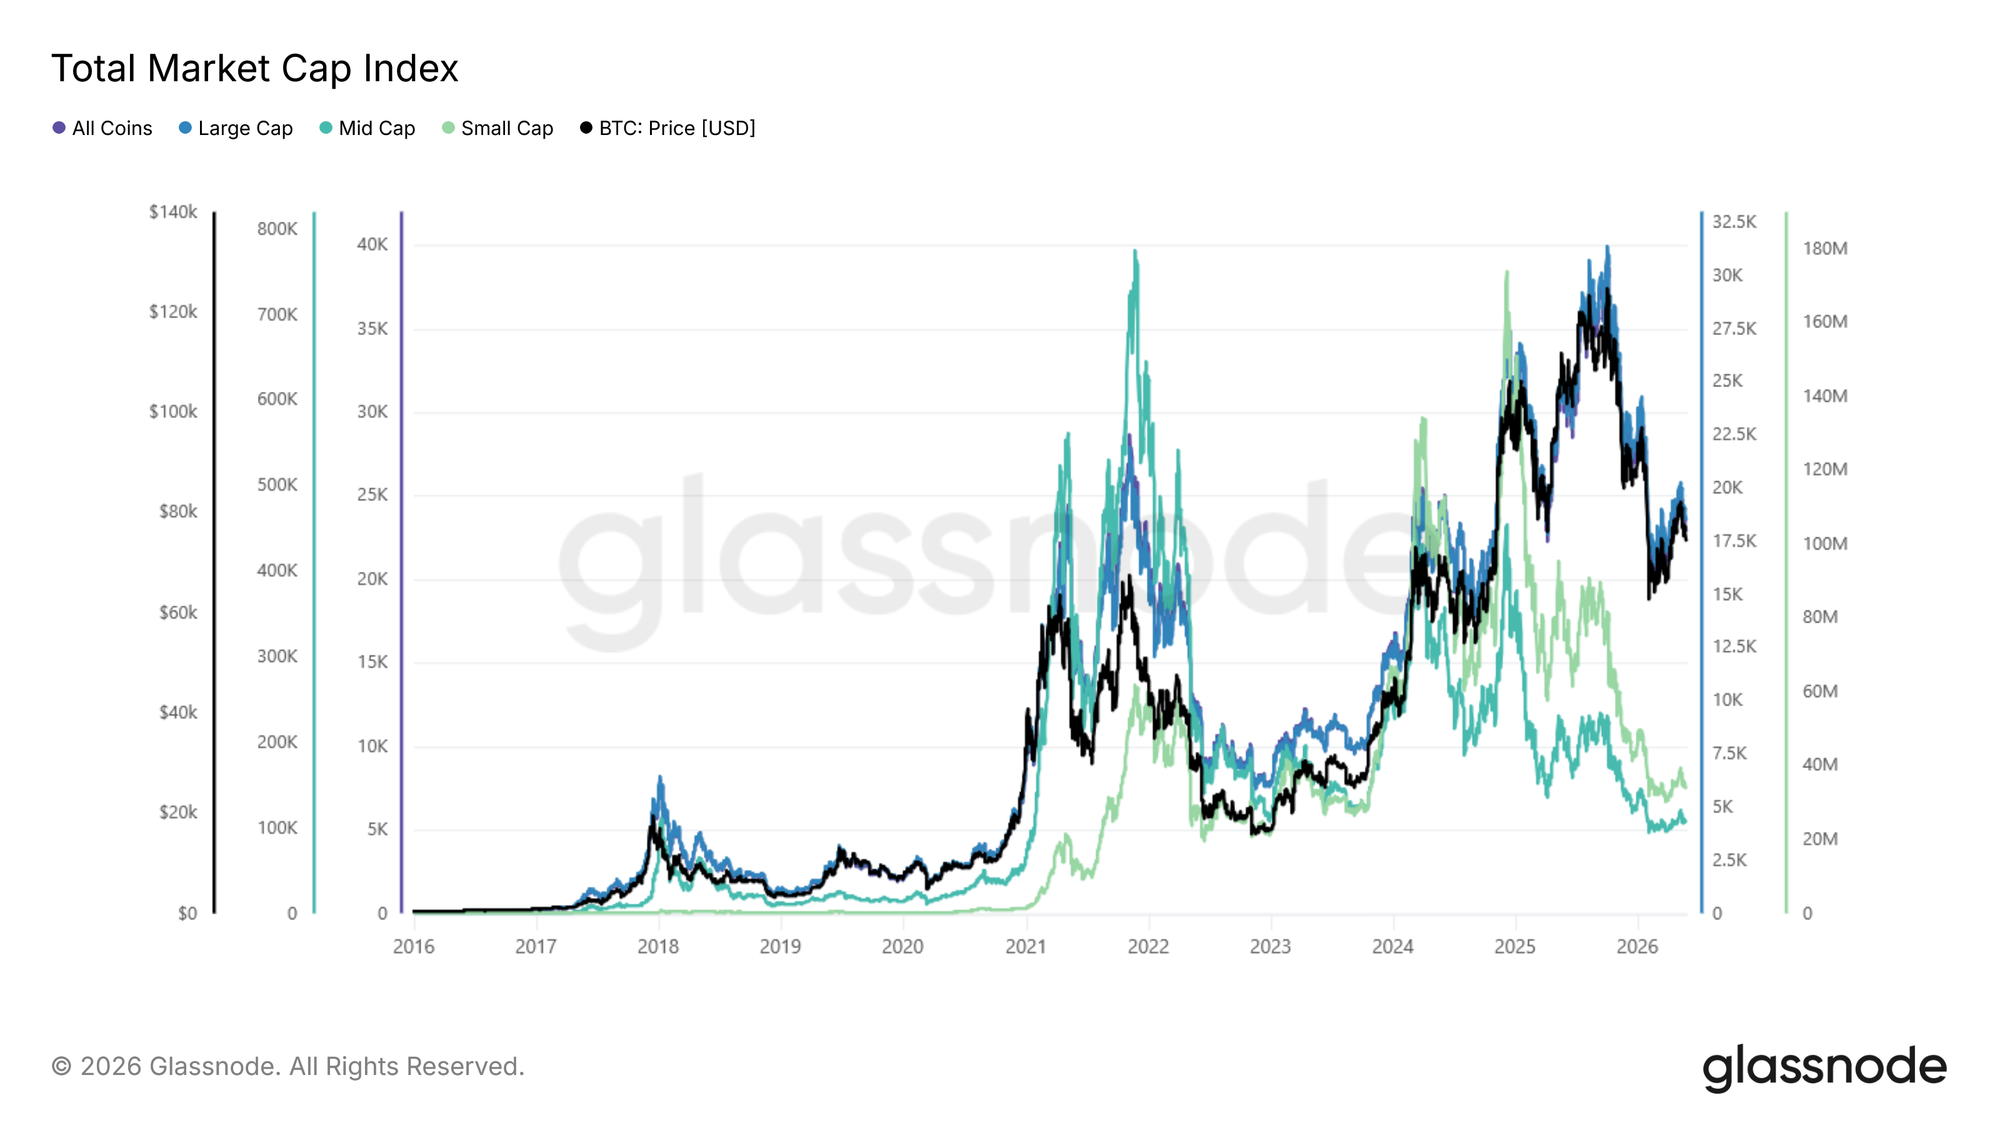
Compare to the Total Market Cap Index: scaled index (base 100) across the same four baskets. Each tier starts at 100, hence the lines are directly comparable as growth multiples.
View Live Metric

The raw small-cap series contains a structural bias: whenever a small-cap asset performs well, it eventually crosses the $100M threshold and leaves the basket, taking its gains with it. In other words, "winners leave". The raw aggregate is, by design, incapable of capturing a small-cap rally.

The index neutralizes this effect. Small-cap shot up dramatically in 2024, a move largely invisible in the raw series, driven by near-instant token creation platforms and the memecoin mania that followed.

The same chart also highlights the divergence across tiers: while large caps held up relatively well, altcoin tiers entered a prolonged drawdown. Both halves only become legible in the index.

Profit-taking Sentiment: Altcoin SOPR vs BTC SOPR

Spent Output Profit Ratio (SOPR), which measures whether coins moving on-chain are being spent at a profit (above 1) or a loss (below 1), is one of the clearest cases where a global metric adds value beyond the single-asset version. BTC SOPR and the median SOPR across altcoin baskets frequently diverge, and the spread between them becomes a signal in itself.

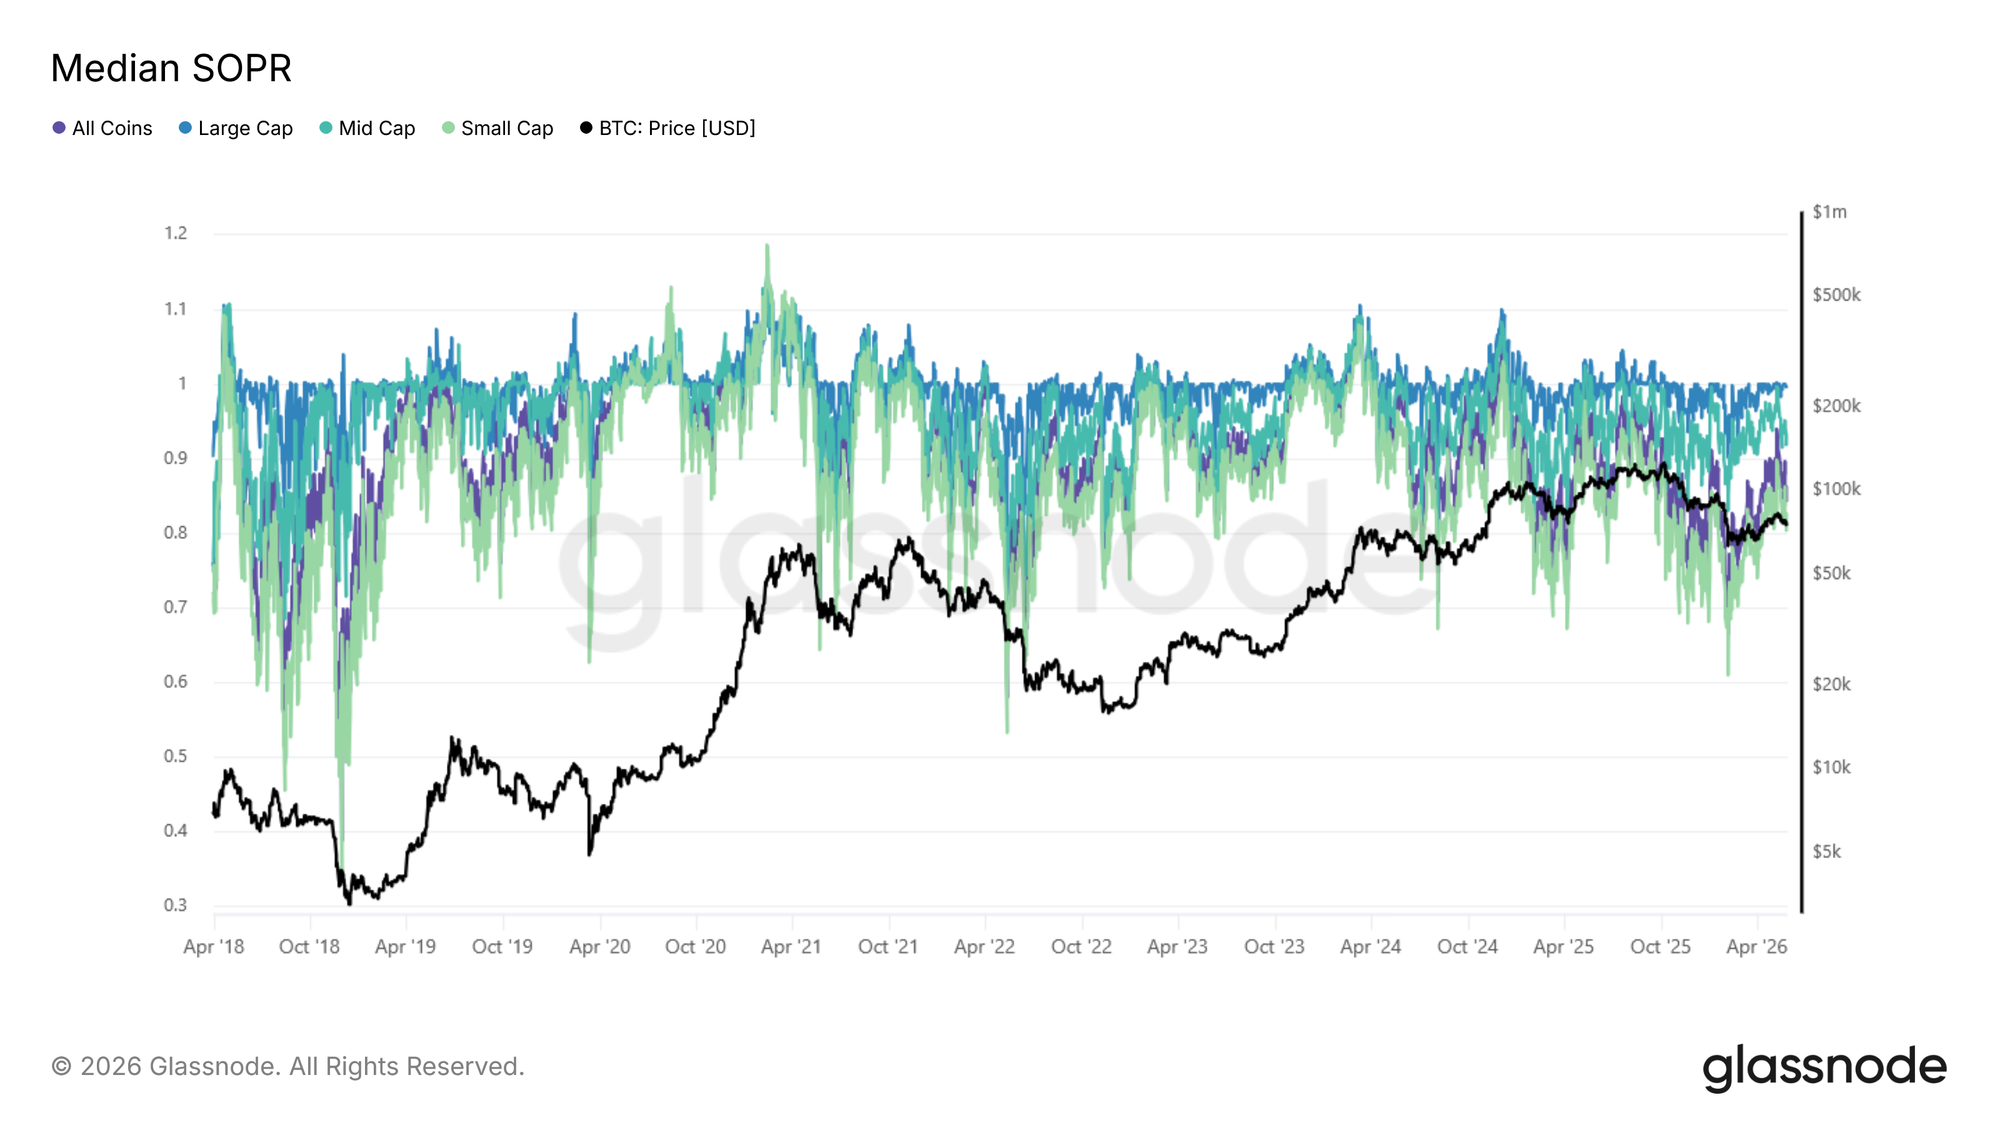
The following figure shows Median SOPR: Raw aggregate across all four baskets, BTC price overlaid. SOPR oscillates around 1.
View Live Metric

Compare to the Median SOPR: scaled index (base 100), across the same four baskets.
View Live Metric

The raw series tells the following story: small-cap SOPR crashes to levels comparable to the 2018 and 2022 bear markets, while large and mid caps have held up better in recent cycles. The index adds an additional nuance: because appreciated small-cap coins keep leaving the basket as they grow into higher tiers, the raw series overstates how bad sentiment is for the assets that actually remain.

Adjusted for this, small-cap sentiment is more stable than it appears. For large and mid caps no such correction applies, and what the index reveals is a genuine long-term trend: each cycle, the average holder in established assets extracts slightly less profit than the one before. As more supply locks into long-term holding, less of it cycles through at a profit.

Rather than relying on selected tokens as proxies for altcoin sentiment, the global SOPR index provides a cohort-level read directly. No need to cherry-pick individual tokens.

Derivatives Positioning: Open Interest

Open Interest (OI) measures the total value of outstanding perpetual futures contracts and provides a useful proxy for leverage concentration across the market.

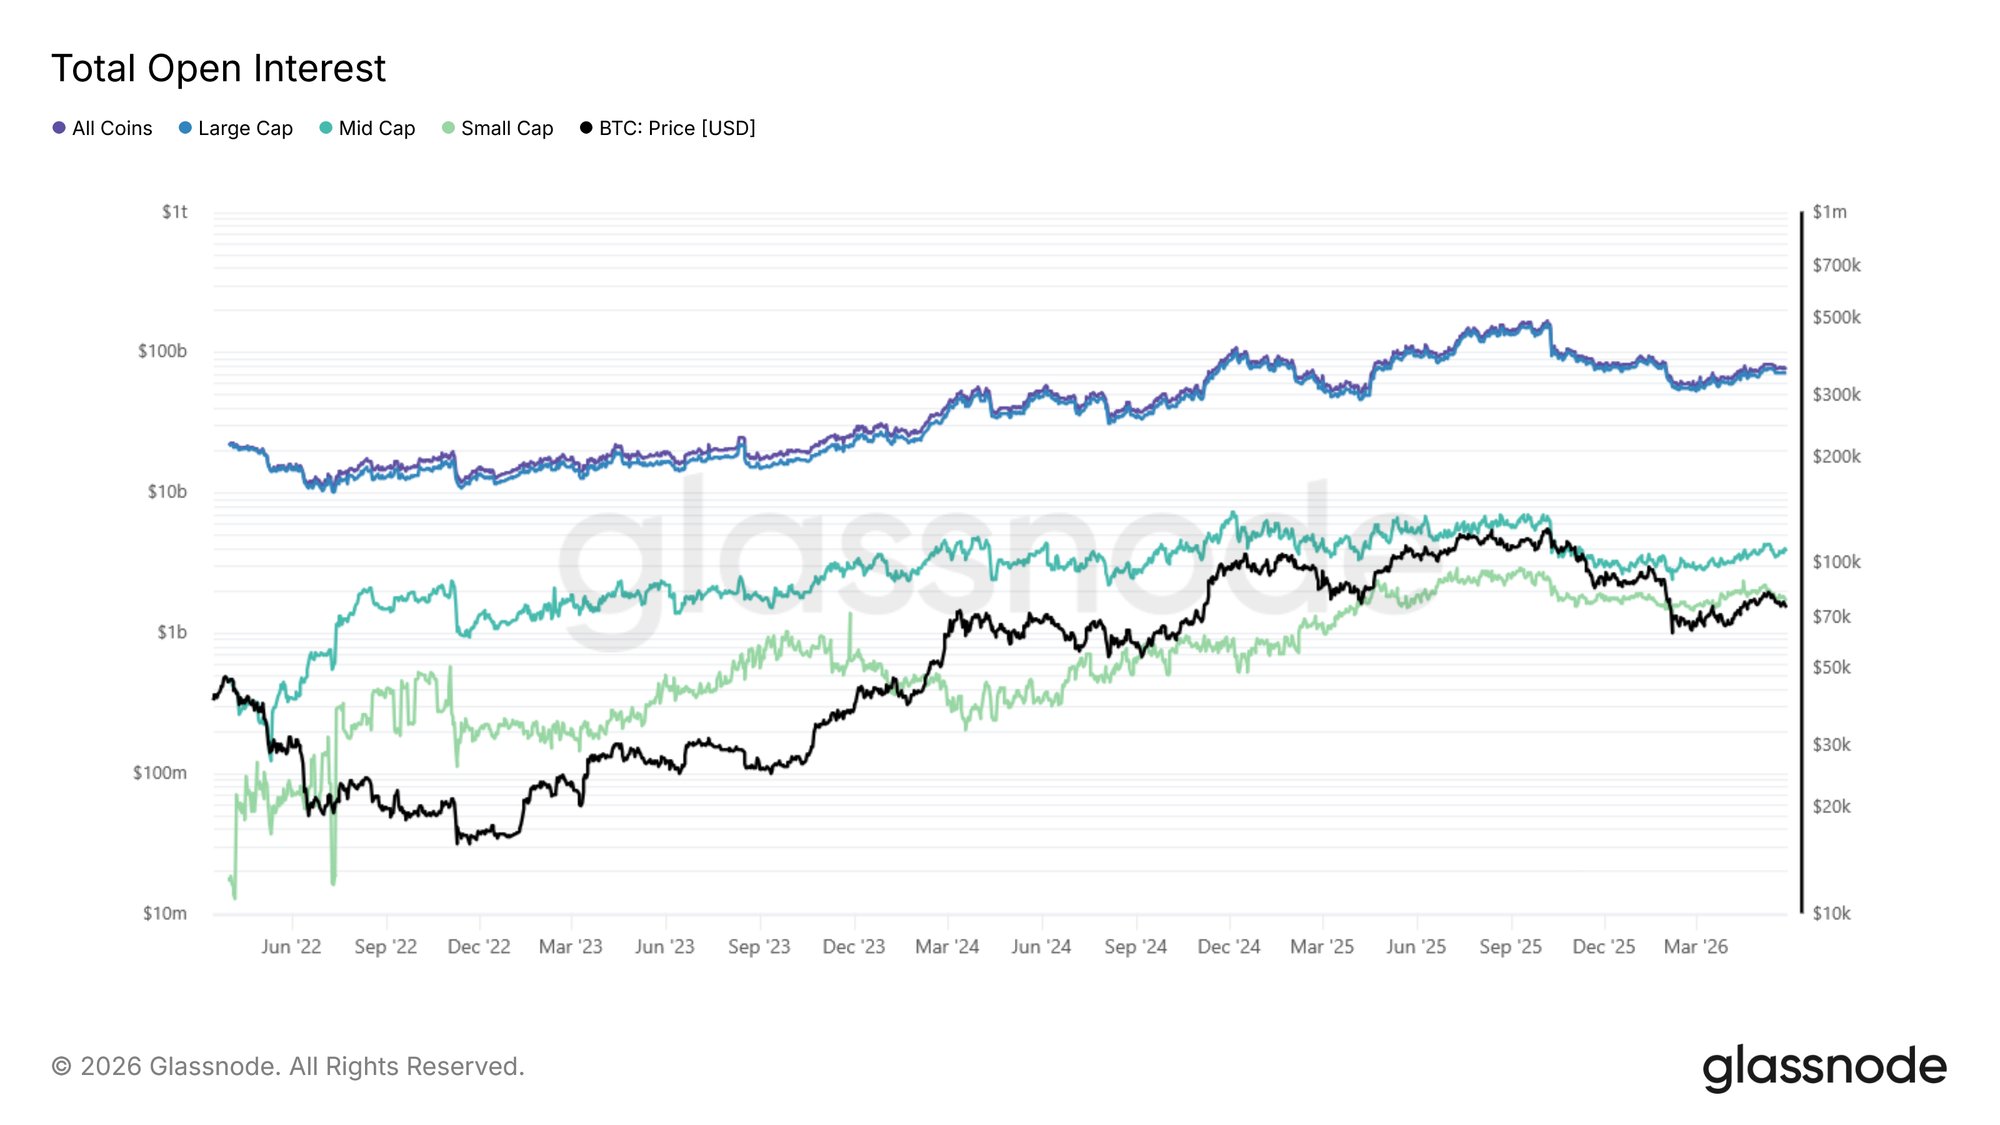
The below figure presents Total Open Interest: Raw aggregate (USD, log scale) across all four baskets, data from 2022.
View Live Metric

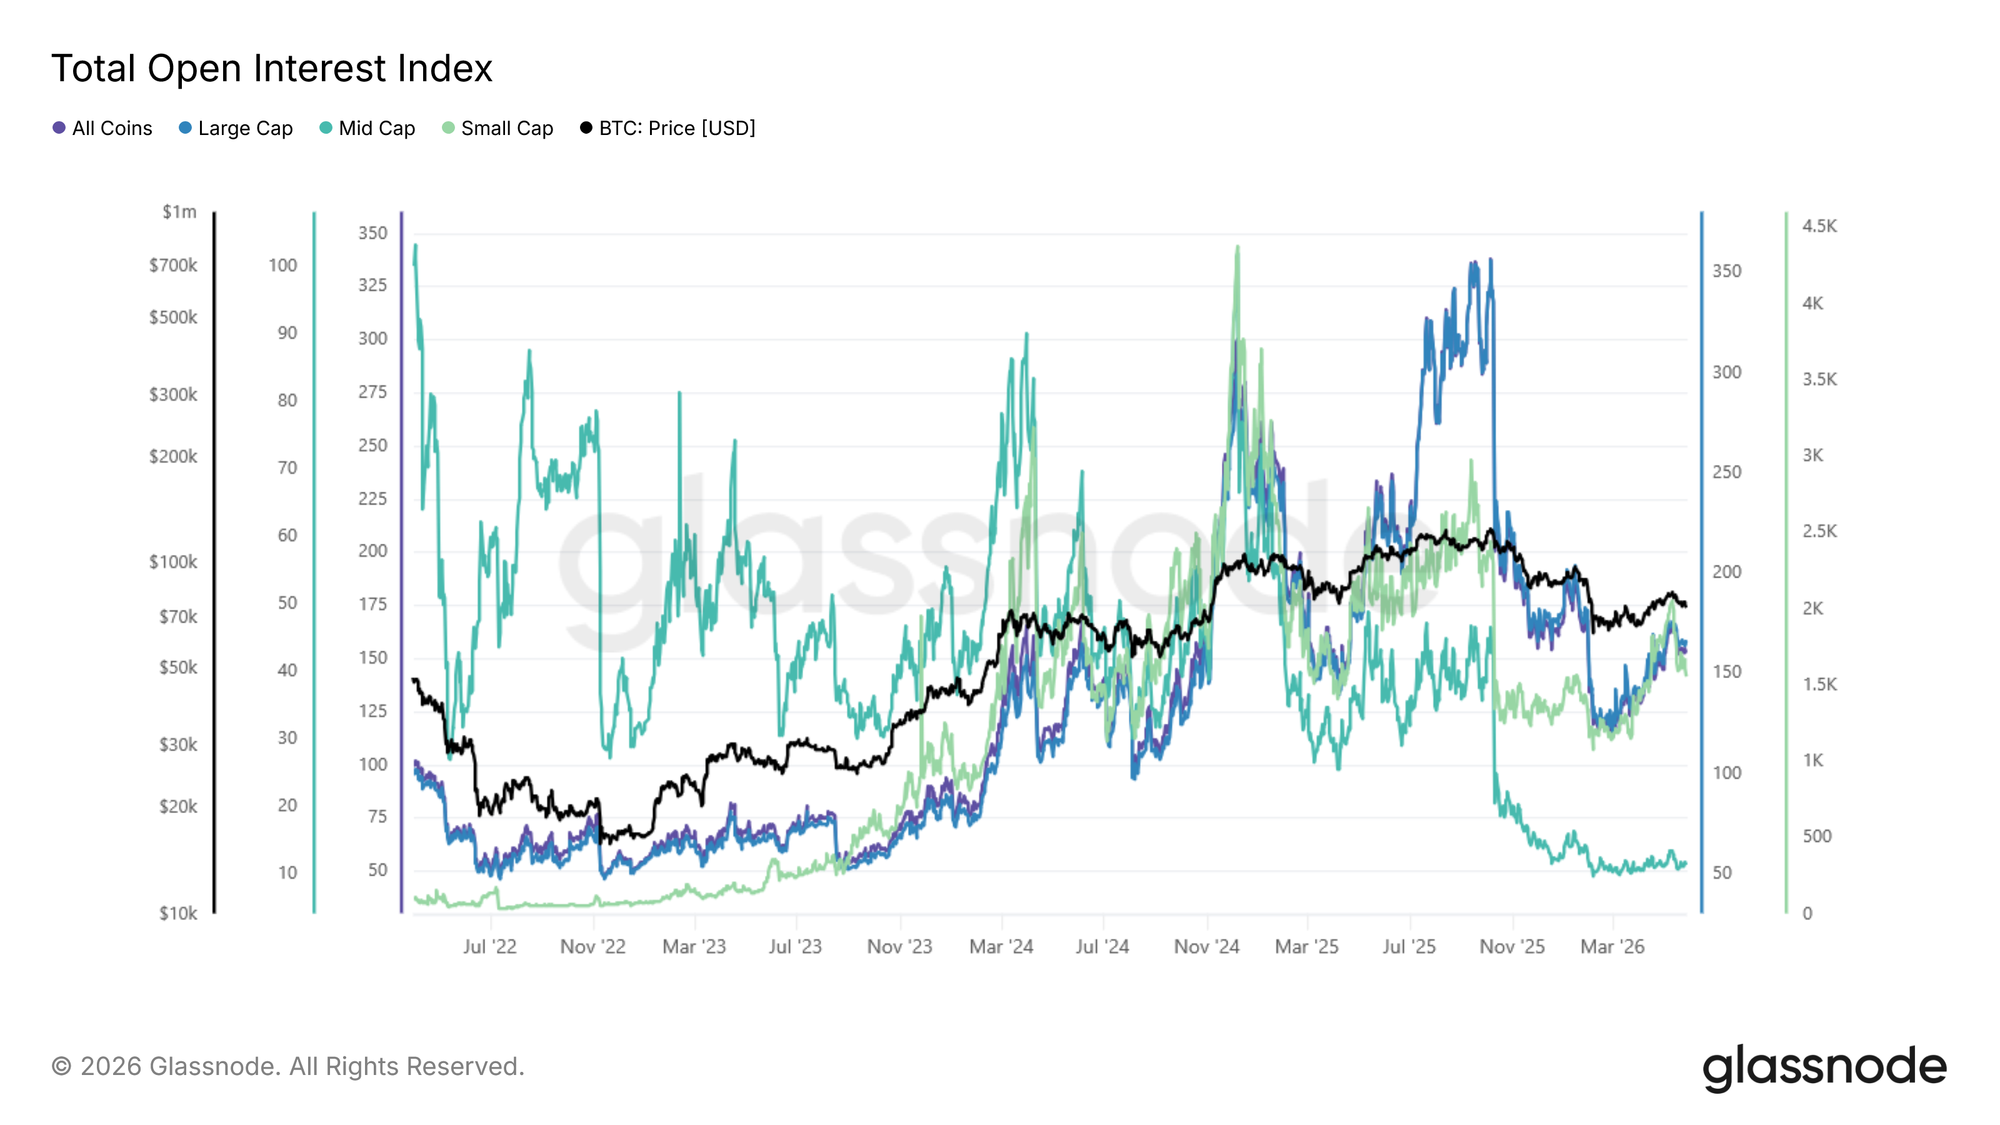
Compare to the Total Open Interest Index: scaled (base 100) across the same four baskets.
View Live Metric

Large cap dominates open interest in absolute terms; most leverage sits on the biggest, most liquid assets. The index, however, makes the behavior of the smaller tiers comparable: mid- and small-cap open interest is far more volatile, spiking sharply during speculative episodes and unwinding just as fast. These spikes are a useful early-warning signal for cascade risk in the more fragile parts of the market.

The continuity-adjusted framework makes these shifts easier to isolate by separating changes in leverage behavior from changes in cohort composition.

The Glassnode Global Metric Suite

Four metrics are live with this release, each computed for all four baskets, sixteen time series in total. All use weekly rebalancing and equal weighting.
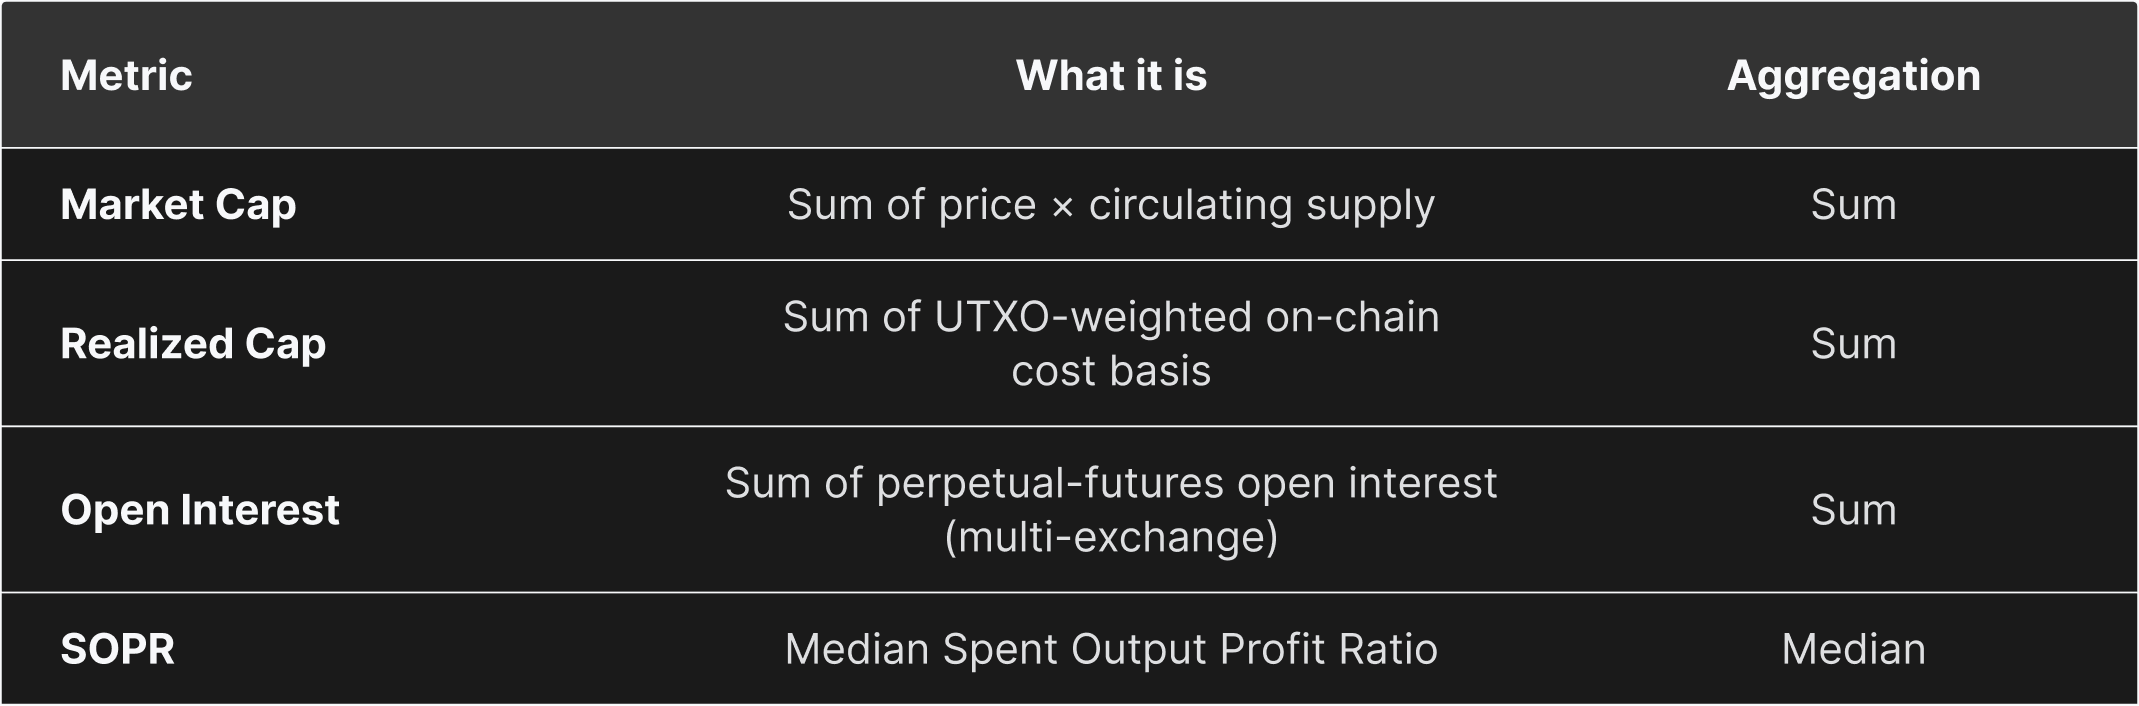
The baskets are the market-cap tiers used throughout this paper:

  • All Coins (no filter)
  • Large Cap (≥$1B)
  • Mid Cap ($100M–$1B)
  • Small Cap (<$100M).

Eligibility filtering, start dates, and the choice of sum versus median aggregation are covered in the appendix.

Accessing the Data via API

Each metric is published in two forms. 1) The raw aggregate preserves the original units (discontinuous at rebalances) and is intended to use for absolute sizing and point-in-time snapshots. 2) The index is scaled, base-100, and continuous, making it more suitable for trend analysis and cross-basket comparison.

Raw and index versions are served from separate endpoints, and each endpoint returns all baskets for that metric:

https://api.glassnode.com/v1/metrics/global/{metric}_{aggregation}_{rebalancing}_{weighting}_raw
https://api.glassnode.com/v1/metrics/global/{metric}_{aggregation}_{rebalancing}_{weighting}_index
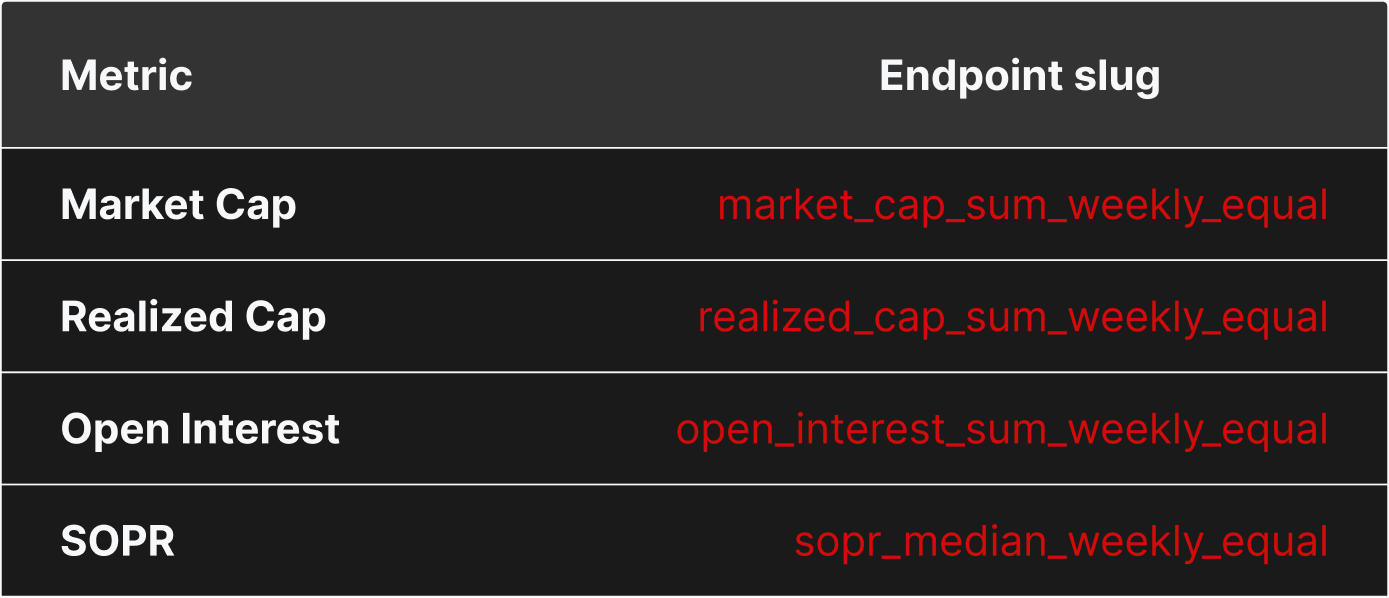
For full request details, please see the Glassnode API documentation. The framework is extensible (additional metrics, alternative weightings, and tag-based sector baskets are planned), but the four metrics above are live today, and they already bring the continuity discipline of traditional price indices to on-chain and market data for a market that is increasingly multi-asset.

Methodology

Full details on basket selection, eligibility filtering, scaling-factor formulas, and index normalization, please reach out to your account manager for access.


  • Follow us on X for timely market updates and analysis
  • Join our Telegram channel for regular market insights
  • For on-chain metrics, dashboards, and alerts, visit Glassnode Studio

Disclaimer: This report is for informational and educational purposes only. The analysis represents a limited case study with significant constraints and should not be interpreted as investment advice or definitive trading signals. Past performance patterns do not guarantee future results. Always conduct thorough due diligence and consider multiple factors before making investment decisions.


Related Questions

QWhat is the core challenge that Glassnode Global Metrics aim to solve in crypto analytics?

AGlassnode Global Metrics aim to solve the fundamental challenge of tracking on-chain and market metrics across a highly dynamic group of assets over time without artificial discontinuities caused by basket composition changes. This is in contrast to indices that focus solely on price.

QExplain the key difference between the 'Raw Aggregates' and 'Indices' provided by Glassnode Global Metrics.

AThe 'Raw Aggregates' provide true values in original units (e.g., USD for market cap), preserving economic meaning but potentially containing structural discontinuities. The 'Indices' are scaling-factor-adjusted, base-normalized (to 100) time series designed for continuous trend analysis and cross-basket comparison, as they neutralize the effect of assets entering or leaving the basket.

QUsing the 2024 small-cap market cap example from the article, why does the raw aggregate series fail to capture a genuine small-cap rally, and how does the index correct for this?

AThe raw small-cap market cap series suffers from a 'winners leave' structural bias. When a small-cap asset appreciates and crosses the $100M threshold, it leaves the small-cap basket, taking its gains with it. Therefore, the raw aggregate cannot capture sustained gains. The index corrects for this by applying a continuity adjustment that neutralizes the effect of composition changes, allowing the true performance of the small-cap tier to be visible.

QAccording to the analysis of the Median SOPR (Spent Output Profit Ratio) index, what long-term trend does it reveal for large and mid-cap assets?

AThe analysis of the Median SOPR index reveals a genuine long-term trend for large and mid-cap assets: in each market cycle, the average holder in these established assets extracts slightly less profit than in the cycle before. This is attributed to more supply being locked into long-term holding, resulting in less of it cycling through at a profit.

QHow does the Global Open Interest index help identify risk, particularly for smaller market cap tiers?

AThe Global Open Interest index helps identify risk by making the *behavior* of different market cap tiers comparable. It shows that open interest for mid- and small-cap assets is far more volatile than for large caps, spiking sharply during speculative episodes and unwinding rapidly. These spikes serve as an early-warning signal for cascade risk in the more fragile, less liquid parts of the market.

Related Reads

From Gold to Bitcoin: Fixed Supply + Institutional Frenzy, Might It Repeat the 'Explosive' Price Trend?

"From Gold to Bitcoin: Fixed Supply and Institutional Frenzy May Lead to 'Explosive' Price Rally Analysts suggest Bitcoin's price action could mirror gold's over the past two decades, following the launch of spot Bitcoin ETFs. Gold ETFs, introduced in 2004, drove gold's price surge to a current market cap near $28 trillion. Both gold and Bitcoin are non-yielding stores of value, with prices driven purely by investor sentiment rather than cash flows or credit. Gold ETFs experienced dramatic cycles: explosive growth, painful drawdowns, and slow recoveries, with each cycle reaching higher peaks. Bitcoin ETFs, approved in early 2024, saw rapid institutional adoption but are now facing similar volatility. Recent warnings highlight the risk of significant ETF outflows disrupting the current rebound. BlackRock's IBIT, a leading Bitcoin ETF, has sold nearly 100,000 BTC to meet redemptions while still holding over 733,000. The core parallel is fixed supply: when demand surges, prices explode, but demand is often volatile and wave-like, not steady. Institutional interest, through ETFs and corporate adoption, remains a key support pillar, helping to cushion sell-offs. If Bitcoin captures even a fraction of gold's role as a store of value, its upside potential is immense, though the path will be marked by high volatility. For investors, focusing on long-term trends and managing risk is crucial as this 'price explosion' narrative unfolds."

Foresight News4m ago

From Gold to Bitcoin: Fixed Supply + Institutional Frenzy, Might It Repeat the 'Explosive' Price Trend?

Foresight News4m ago

Why Is AI Agent Shopping Hard to Popularize?

The article argues that the popular narrative of "AI agent shopping" – equipping AI with a wallet to autonomously handle purchases – is fundamentally flawed and oversimplifies the complexity of shopping. It deconstructs shopping into two core actions: **information retrieval** (standardized, easily automated) and **value judgment** (deeply subjective and human-centric). The narrative mistakenly assumes AI can fully handle both. Value judgment itself has two layers: **evaluation** (assessing options against criteria) and **demand definition** (setting the criteria, weights, and values). The latter is inherently human and dynamic, as preferences are not fixed but constructed during the decision-making process ("constructive preferences"). The real dividing line for automation is not product standardization, but whether the **act of choosing** itself holds experiential value. For mundane purchases (e.g., printer paper), full AI delegation works. For experiential goods (e.g., wine, furniture), the joy of selection is core to consumption, so AI should act as an assistant that narrows options, leaving the final choice to humans. The "AI wallet" concept confuses three separate elements: decision-making, execution, and fund custody. Current payment industry solutions (e.g., from Stripe, Mastercard, Google, Visa) show that limited, scoped payment authorization tokens are sufficient for most consumer scenarios, not full fund custody. The true use case for autonomous AI wallets is in **B2B procurement** and **machine-to-machine (M2M) settlements** for standardized, high-frequency, low-value transactions. The real bottlenecks for AI shopping are not payment technology, but **1) the lack of trusted data sources** (e.g., fake reviews, counterfeit goods) and **2) the impossibility of automating human demand definition**. The conclusion is that the focus should be on safely automating the assessment and filtering process while reserving for humans the rights to define their criteria and enjoy the final act of choice. For experiential goods, the platform's competitive advantage shifts to providing a superior selection experience.

Foresight News1h ago

Why Is AI Agent Shopping Hard to Popularize?

Foresight News1h ago

After Nine Months of Shorting, a Full Turn to Long: Renowned Trader Opens Bitcoin Positions Around 64K, Crypto Market Long-Short Divergence Intensifies

After nine months of being short, prominent crypto trader Doctor Profit has closed all his bearish positions and started buying Bitcoin near $64,000, signaling a complete bullish reversal. He argues that structural market changes—such as impending U.S. regulation (CLARITY Act) and institutional adoption via securities tokenization—are rewriting the traditional four-year cycle script, potentially bringing the market bottom forward from the widely expected September/October timeframe. This view finds some technical support from on-chain analyst gumsays, who notes a bullish divergence on Bitcoin's weekly chart has persisted for 147 days, nearing the 161-day duration seen before the 2022 cycle low. However, cycle researcher Jake Pahor presents a counter-argument based on historical data. Analyzing patterns since 2014, he identifies three common features of past bear market bottoms: a ~12-month duration from peak to trough, a sustained period of extreme fear (with a proprietary risk score below 20), and the price falling below Bitcoin's realized price (~$53,000 currently). The current cycle, only nine months from its October 2025 peak, meets none of these conditions. The debate highlights a market torn between "front-running" a potential early bottom driven by new fundamentals and waiting for confirmation through traditional on-chain and sentiment metrics. While Doctor Profit opts for aggressive buying, Pahor maintains a disciplined, tiered accumulation strategy, continuing weekly buys at current risk levels but reserving larger orders for if more extreme fear emerges.

marsbit1h ago

After Nine Months of Shorting, a Full Turn to Long: Renowned Trader Opens Bitcoin Positions Around 64K, Crypto Market Long-Short Divergence Intensifies

marsbit1h ago

Senior Trader's Confession: How to Trade Market's False Expectations?

Veteran trader's case study: trading the market's "wrong expectations". This trade centered on a textbook "expectation error" after a weak CPI report. While the market initially priced in broad monetary easing (sending Nasdaq to 30,060), the crucial 30-year real yield hit a 20-year high. This signaled a fractured transmission mechanism: short-term rates eased, but long-term funding costs (vital for tech valuations) refused to fall. The trader executed five short positions on the Nasdaq (NQ) as it fell from 30,060 to 28,768. The core methodology: don't just trade the data, but analyze the market's implied causal chain and identify where it breaks. In this case, the chain was: Weak CPI → Policy Easing → Lower Long-Term Funding Costs → NQ Valuation Expansion. The break occurred between policy easing and long-term rates. The "veto variable" – long-term real yields – refused to confirm the bullish narrative. Trades were structured around "fast variables" (price) temporarily repairing while "slow variables" (funding conditions) remained broken. The article outlines a repeatable framework: 1) Map the market's implied causal chain. 2) Identify the veto variable. 3) Observe if it rejects the narrative. 4) Enter when price still follows the old script. 5) Choose the cleanest asset expression (e.g., short NQ, not broad S&P). 6) Define both invalidation and fulfillment exit conditions. The key insight: Alpha often comes not from an information edge, but from a "reaction function edge" – recognizing when the market is applying an outdated causal logic to new data. The critical question: What causal chain is the market's first reaction relying on, and is that chain still valid today?

marsbit1h ago

Senior Trader's Confession: How to Trade Market's False Expectations?

marsbit1h ago

Trading

Spot
活动图片