Bitcoin suddenly surged during U.S. stock market hours last night, reaching a high of $94,640, before being pushed back down to around $92,000. The persistent premium effect on Coinbase has reappeared, indicating that institutions are aggressively buying the dip.
Recently, figures like Cathie Wood and CZ have stated that the four-year cycle has ended. Currently, mainstream institutional confidence is significantly boosted, but retail investor confidence remains weak. The only way to restore retail confidence is through a price surge, pushing Bitcoin back above $100,000. At that point, retail investors will likely become frenzied again.

BTC
From a daily chart perspective, BTC has broken through the upward trend line on high volume, forming a pattern that suggests a decline is over. Pullbacks can be used to go long again. The MACD indicator is about to cross above the zero axis, indicating potential for further rebound. The high-volume surge shows increased buying power; short sellers should be more cautious. The nearest resistance is around $98,000.
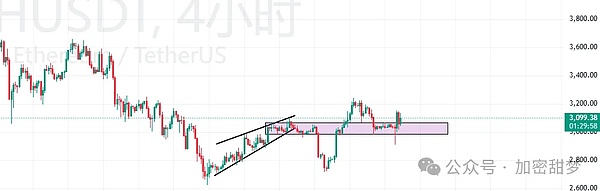
The four-hour breakout is complete. After the breakout, the two key levels for a pullback are the middle band of the ascending channel and the previous resistance-turned-support level (both are marked on the chart).
Two key levels: $92,000 and $90,540. If it breaks below the key level of $90,540, avoid going long in the short term. Both of these levels are suitable for light long positions, with a stop-loss if the level is broken.

ETH
Ethereum's daily chart is even stronger, showing four consecutive bullish candles and breaking through $3,260. The current price is around $3,320, near the upper Bollinger Band. On the four-hour chart, it surged and then pulled back, indicating a need for a correction.
The intraday strategy remains focused on shorting at highs. If you missed the long trade, avoid chasing the pump at high levels. Key resistance levels to watch for shorting are around $3,380 and $3,480. If a pullback occurs, focus on these levels for short positions.
Support levels below are at $3,230, $3,150, and $3,060. A break below $3,000 would open the door to further declines towards $2,900, $2,820, $2,730, and even $2,620.
SOL
SOL has been relatively weak for a while, failing to break above $147. Previously, SOL tended to pivot before BTC, but this time ETH was the first to break through key resistance. It's likely that SOL will follow suit and attempt a breakout tonight. If it can break above $147.5 and maintain a pullback above $141.85-$138.85 (i.e., holding above $138), it could potentially test $154-$158 in the coming days.
On the three-day chart, SOL's rebound hasn't fully materialized yet. A push upward tonight could trigger it. However, it will still pull back upon reaching resistance. Going long at lows can be profitable, and shorting at highs is also viable—just know when to take profits on the pullback before potentially flipping long again.
$MERL
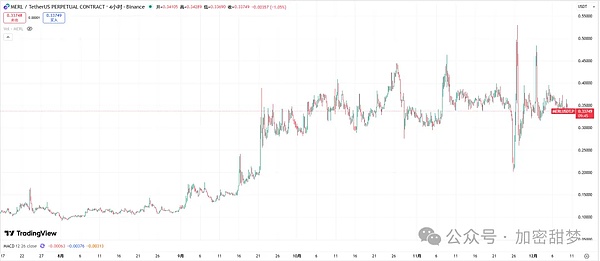
MERL has tested the $0.50 level three times in the past month, each time getting rejected hard. The pump volume might look impressive, but it's largely artificial—buying pressure simply isn't sustaining. The highs are getting lower, and the bounces are becoming weaker, clearly indicating a bearish structure.
I'm closely watching the $0.20 level for three main reasons:
1. The project team's cost basis is roughly in the $0.18-$0.22 range. They typically won't just sit idle if the price drops here.
2. This is also a psychological support level for retail investors. Holding here might provide some breathing room; breaking it could trigger panic selling.
3. It's a critical trend level: holding here would suggest bearish momentum is waning, while breaking it could lead to a free fall with ample downside.
So, don’t rush to buy the dip now, and don’t expect any sudden independent rally. MERL's bearish trend remains intact. Avoid taking long positions before $0.20. Wait until it approaches $0.20 to see if it continues to drop or shows signs of a bounce—the price action will give the signal. Hold cash, trade with the trend, don’t fight it.
ZEC
It's time to take profits and close all long positions. The 1-hour chart shows a rising wedge pattern and a potential double top, suggesting a short-term correction is likely. Additionally, there's a bearish divergence. Considering profit protection, it's advisable to close all long trades. The profit is already substantial—our entry was at $359, and the current price is $440. Don’t get greedy for the last bit.

If you find our content valuable, please share our public account with your friends! Welcome to follow and stay updated with the latest crypto news! Every major crash is followed by vast opportunities. If you're feeling lost about future market strategies, follow Tianmeng. Contact on WeChat: RFGH8689