How Risky is the "Death Spiral" of MSTR and STRC?

Foresight NewsPublished on 2026-06-05Last updated on 2026-06-05

Abstract

Summary: This article explores the perceived "death spiral" risk between MicroStrategy (MSTR), its Bitcoin holdings, and its perpetual preferred stock (STRC), drawing comparisons to the LUNA-UST collapse. While both systems feature price anchors, high yields for holders, and potential feedback loops, their core mechanisms differ fundamentally. The MSTR-STRC structure relies on continuous financing to sustain its high dividend payouts, primarily through stock ATM offerings. A negative feedback cycle could occur: falling MSTR stock price makes raising equity capital harder, increasing pressure to sell Bitcoin, which undermines STRC confidence and further depresses MSTR. However, unlike LUNA-UST's automated, direct linkage, the MSTR-STRC loop is weaker and has brakes: STRC dividends can be deferred or rates lowered, and STRC holders have a $100/share liquidation preference in bankruptcy, providing a price floor. The company's sustainability hinges on its ability to continue financing. Its current ~$900 million USD reserves cover only about 6.3 months of its ~$1.71 billion annual interest/dividend burden. The next six months are critical, aligning with both the potential bottom in Bitcoin's four-year cycle and the depletion timeline of its reserves. While a LUNA-style catastrophic collapse is deemed highly unlikely due to structural differences, the key question is whether MicroStrategy can navigate this period through healthy deleveraging to restart its capital engine.


Author: @100y_eth (Four Pillars)

Compiled by: AididiaoJP, Foresight News


MicroStrategy (MSTR) recently sold 32 bitcoins (worth only $2.5 million), which triggered a market cap evaporation of over $100 billion in Bitcoin. STRC (its perpetual preferred stock) fell from a reference price of $100 to $94, and MSTR's stock price also dropped from $150 to $123.


MSTR, BTC, and STRC are deeply intertwined. In a bullish market, this structure is a powerful capital engine, allowing Strategy (MicroStrategy) to aggressively accumulate Bitcoin; but once the market deteriorates, as it has recently, the three form a vicious cycle of mutual negative feedback.


This reminds people of the LUNA-UST incident from years past. So, is the MSTR-STRC structure truly sustainable?


Key Takeaways


UST and STRC appear similar on the surface: their prices are anchored to a specific reference value, holders can obtain high yields, and both carry death spiral risks. However, they are fundamentally different in their price stabilization mechanisms, legal recourse rights, interest/dividend payment methods, and internal operational structures.


For Strategy to maintain sustainability, it must continuously raise funds. This relies on both market confidence and its own creditworthiness. In the worst-case scenario, even if it cannot continue financing, it will not experience a direct "death spiral" like LUNA-UST.
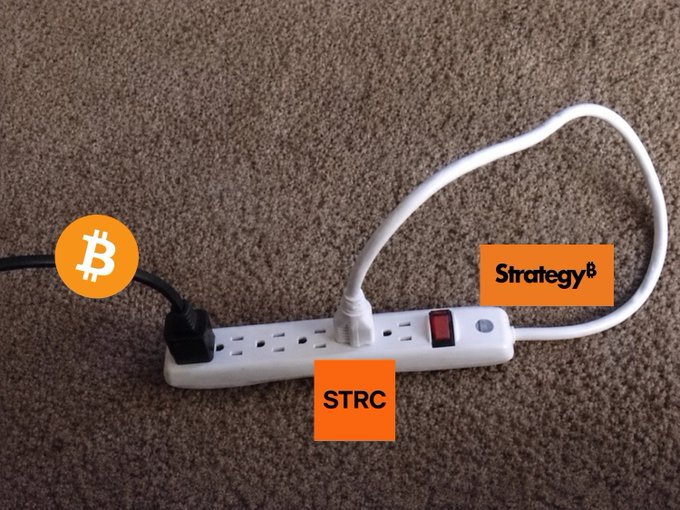


Strategy's current net leverage ratio is about 11%, with an amplification factor of approximately 42%. Even if MSTR and STRC enter a negative feedback loop, as long as the Bitcoin price remains above about $26,000, preferred shareholders still have a high probability of preserving their principal; and as long as Bitcoin does not fall below about $8,000, the probability of bankruptcy due to debt is very low.


The next six months will be a critical period. According to Bitcoin's four-year cycle theory, a bottom could be seen in the second half of this year, and Strategy's US dollar reserves are only sufficient to last about six months. The core question is: can Strategy restart its capital engine through healthy deleveraging within these six months?


LUNA-UST Quick Recap


The LUNA-UST collapse was four years ago. Let's quickly review its operating mechanism.


Price Stabilization Mechanism
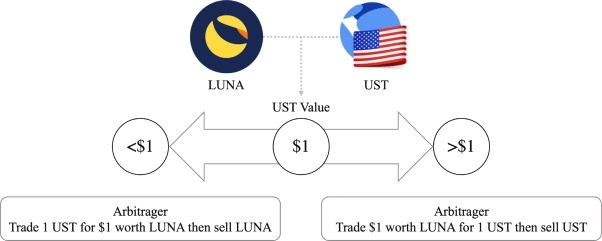


UST was an algorithmic stablecoin with no collateral, maintaining its $1 peg through an algorithm. The core rule was: 1 UST could always be exchanged for $1 worth of LUNA.


  • When UST < $1: Users could burn UST worth less than $1 to receive $1 worth of LUNA. The arbitrage opportunity pushed the UST price back up while reducing UST supply.
  • When UST > $1: Users could provide $1 worth of LUNA to receive more valuable UST. Arbitrage pushed the UST price down while increasing UST supply.


Vicious Cycle Scenario


The more UST issued, the less LUNA supply, which should have been a positive driver for LUNA's price. Terraform Labs indeed amplified this effect by aggressively expanding UST use cases.
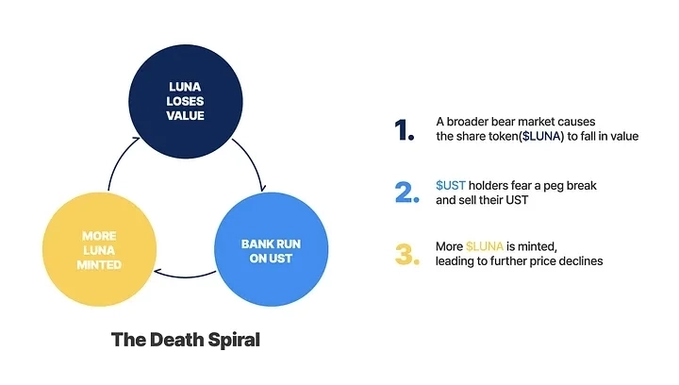


However, once confidence collapsed, the same mechanism reversed into a death spiral:


LUNA price drops → UST confidence collapses → UST price drops → LUNA massively increases supply → LUNA price drops further...


The LUNA-UST Collapse


The direct trigger for the collapse was a loss of confidence. At the time, Terraform Labs was migrating UST liquidity on Curve from the 3pool to the 4pool, thinning liquidity in the 3pool. An attacker sold $85 million worth of UST, breaking the peg and triggering panic.


A large amount of UST was withdrawn from Anchor Protocol (which offered about 20% APY for deposits), instantly overwhelming the market with selling pressure. Before the crash, 71% of UST was deposited in Anchor. When the unsustainability of the 20% yield was exposed, even a $450 million injection by the Luna Foundation Guard was powerless to stop it.
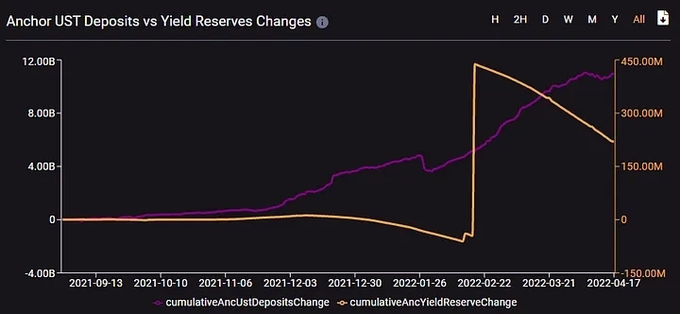


Ultimately, LUNA supply exploded from about 350 million tokens to 65 trillion tokens (a 17,000-fold increase), with its price approaching zero.


Detailed Analysis of the MSTR-STRC Structure


Strategy's core goal is to increase BPS (Bitcoin per Share). To achieve this, it raises funds through various financial engineering tools like convertible bonds, perpetual preferred stock, and ordinary share ATM offerings, then uses the raised capital to accumulate more Bitcoin.


Financing Methods


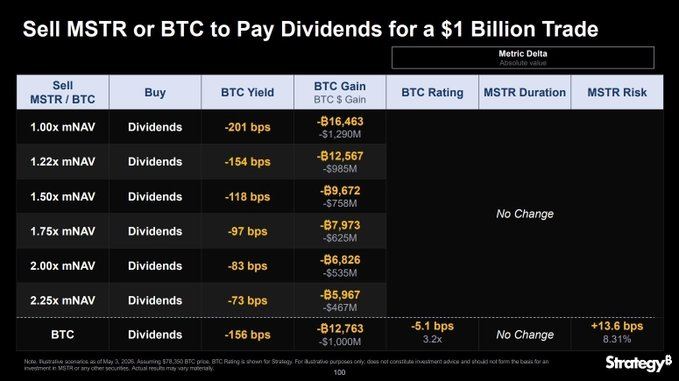
  • Ordinary Share ATM Offerings: Issuing small amounts of MSTR Class A ordinary shares for sale on the market. This causes ADSO (assuming fully diluted shares outstanding) dilution, but when mNAV > 1.22, it can actually increase BPS.
  • Convertible Bonds: Low-interest borrowing with conversion options, but carries principal repayment pressure.
  • Perpetual Preferred Stock: Dividends and liquidation priority are higher than ordinary shares but lower than creditors. No principal repayment pressure, but dividend burden is close to 10%. Current series include STRF, STRC, STRE, STRK, STRD, etc. Only STRK is convertible preferred stock; the others are non-convertible. Non-convertible preferred stock does not dilute ADSO and is Strategy's preferred financing method.


Strategy currently needs to pay about $1.712 billion in annual interest and dividends, primarily funded from its US dollar reserves, which are mainly replenished through ordinary share ATM offerings. Recently, it also paid dividends by selling 32 BTC, drawing market attention.


STRC Price Stabilization Mechanism


STRC is designed with a $100 reference price.


  • When STRC > $100: Strategy can lower the dividend rate to depress the price, or issue more STRC to increase supply. It also holds the right to redeem at $101/share, effectively capping STRC's upside.
  • When STRC < $100: Strategy can increase the dividend rate to push the price up. Simultaneously, STRC has a $100/share liquidation preference, providing price support.


Currently, STRC's annualized dividend rate is 11.50% (based on the $100 reference price).


Vicious Cycle Scenario


MSTR and STRC influence each other, forming a self-reinforcing feedback loop. A deteriorating market can lead to a vicious cycle:


MSTR price drops → mNAV decreases → Difficulty of ordinary share ATM financing increases → Pressure to sell BTC rises → STRC confidence drops → STRC price drops → MSTR price drops further...


However, the key difference is: Strategy is not obligated to pay STRC dividends in cash monthly. Cash payments require a board declaration and sufficient funds; otherwise, dividends can accumulate. Additionally, Strategy can theoretically lower the dividend rate to SOFR (Secured Overnight Financing Rate). In extreme cases, it can gradually reduce the dividend rate and defer payments until conditions improve.


LUNA-UST vs MSTR-STRC: Fundamental Differences
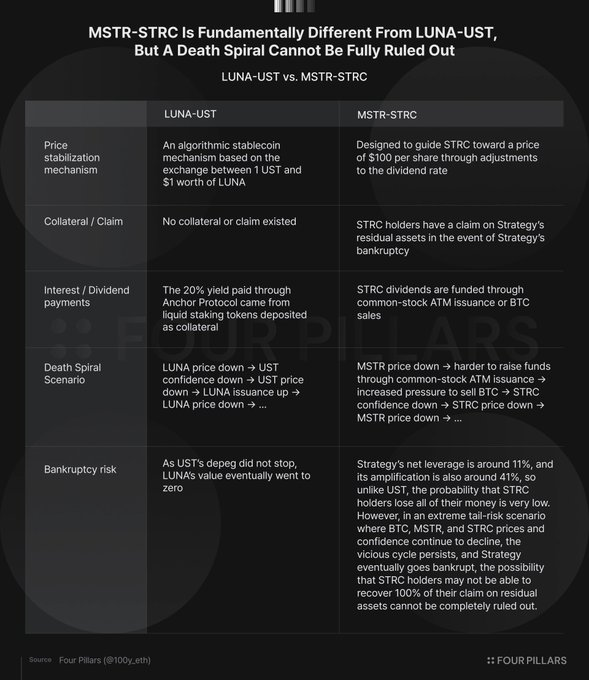


UST and STRC share three apparent similarities: price anchored to a specific level, holders can obtain high yields, and both carry death spiral risks. However, their internal operating mechanisms are entirely different.


Price Stabilization Mechanism


UST stabilized by adjusting LUNA supply; STRC stabilizes by adjusting its own dividend rate. UST's peg mechanism directly affected LUNA's price and supply, while STRC's mechanism does not directly affect MSTR's price and supply.


However, since STRC dividends are primarily funded by MSTR ATM offerings, if MSTR's value falls causing mNAV to drop below 1.22, Strategy's ability to maintain dividends would be questioned.


Collateral / Recourse Rights


UST was completely uncollateralized, and its price could go to zero; STRC, as preferred stock, is also uncollateralized, but in case of company bankruptcy, STRC holders have priority recourse rights to remaining assets (liquidation preference of $100/share).


Interest / Dividend Source


UST itself did not generate interest; the 20% yield came from Anchor Protocol's lending interest and staking rewards (natural market demand).


STRC dividends are primarily funded by ordinary share ATM offerings; in extreme cases, selling BTC is also possible. From a BPS perspective, ATM offerings are beneficial when mNAV > 1.22, while selling BTC is preferable when below 1.22. Overall, however, the "naturalness" of STRC's dividend source is weaker than Anchor's lending + staking rewards.


Death Spiral Differences


The LUNA-UST death spiral was direct and automatic: UST drop → LUNA supply increase → LUNA further drop.


The MSTR-STRC death spiral is more complex and has two major braking mechanisms: First, the direct linkage is weaker; MSTR does not automatically increase supply like a protocol to pay STRC dividends. Second, there are legal recourse rights; even in bankruptcy, STRC holders have recourse to remaining assets, providing downside price support.


The common catalyst for both remains "confidence." As long as investors maintain confidence in MSTR (or LUNA back then), the structure can operate; once confidence collapses, real problems emerge. MSTR selling 32 BTC is not a major event rationally, but emotionally, it could become the trigger for a loss of confidence.


Is the MSTR-STRC Structure Sustainable?


Sustained Fundraising Ability is Core
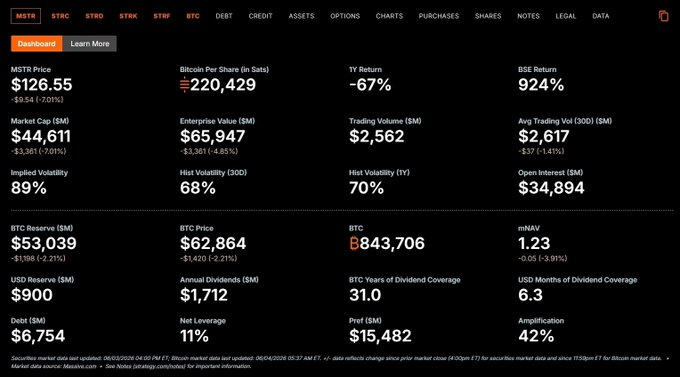


Strategy's current US dollar reserves are $900 million, with annual interest + dividend obligations of $1.712 billion. Without additional fundraising, reserves alone can sustain about 6.3 months.

If reserves are depleted, it could continue financing by issuing more shares / preferred stock, or sell BTC (theoretically sustainable for 31 years). However, the recent sale of just 32 BTC triggered a severe market reaction; the side effects of selling BTC are far greater than imagined.


Financing conditions are clear:


  • MSTR ATM offerings require mNAV > 1.22; otherwise, they reduce BPS.
  • STRC issuance requires the price to be maintained near $99-100; otherwise, financing costs become too high.


Both are highly dependent on market confidence: investors must believe in BTC's long-term appreciation and that Strategy can create value beyond simple holding. In the current market environment, raising funds through shares / preferred stock is difficult in the short term. Strategy can only rely on existing dollar reserves and wait for the market and confidence to recover.


What Happens in Bankruptcy?


Strategy's net leverage ratio is only 11% ((Debt - USD Reserves) / Bitcoin Reserves). The amplification factor including preferred stock is about 42%.


As long as the Bitcoin price does not fall below approximately $26,300 (the price corresponding to the total value of debt + preferred stock), preferred shareholders can preserve their principal through recourse to remaining assets. This is the biggest difference from LUNA-UST.


Convertible Bond Maturity Pressure
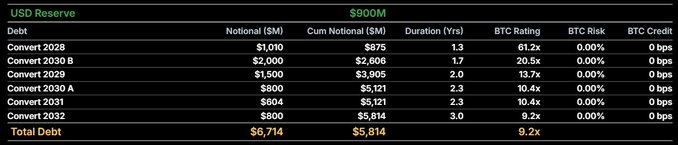


Strategy has no principal repayment obligation for perpetual preferred stock, but convertible bonds require principal repayment at maturity (current total debt $6.714 billion). Maturities begin in 2028. With current USD reserves of only $900 million, if unable to raise funds, it may need to sell BTC to repay debt. However, with a low net leverage ratio, the probability of bankruptcy due to debt is extremely low.


The Next Six Months are the Lifeline
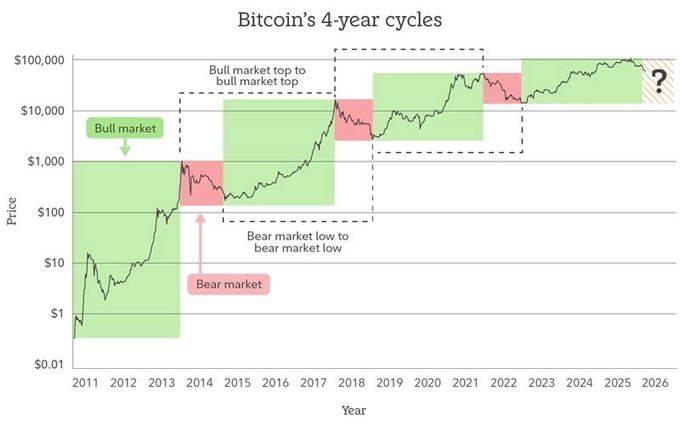


If Bitcoin's four-year cycle theory still holds, a bottom could be seen in the second half of this year, and Strategy's dollar reserves happen to be sufficient for only about six months.


Within these six months, whether Strategy can restart its capital engine through healthy deleveraging will determine its future fate.


Although the title and images are somewhat sensational, the MSTR-STRC and LUNA-UST mechanisms are fundamentally different. The probability of a similar catastrophic collapse is extremely low.


The real question is: Can Strategy survive the challenging next six months, restart its capital engine through healthy deleveraging, or will it merely become an interesting experiment in Bitcoin's history?


Related Questions

QWhat is the core mechanism behind the potential negative feedback loop between MSTR, BTC, and STRC as described in the article?

AThe potential negative feedback loop is triggered when the market worsens. It starts with MSTR's stock price falling, which lowers its mNAV (market-adjusted Net Asset Value). This makes ATM (At-The-Market) equity issuance less effective or counterproductive for raising funds. This difficulty in financing increases the pressure to sell BTC to cover expenses. Selling BTC can weaken market confidence in STRC, causing its price to drop below its $100 reference. Falling STRC prices further undermine confidence in MicroStrategy's overall financial structure, putting additional downward pressure on the MSTR stock price, thus perpetuating the cycle.

QWhat are the two key 'braking mechanisms' that differentiate a potential MSTR-STRC crisis from the LUNA-UST death spiral?

AThe two key braking mechanisms are: 1) No Direct, Automatic Linkage: MSTR does not automatically issue more shares to pay STRC dividends like the LUNA protocol minted new tokens to redeem UST. Dividend payments can be deferred or the rate can be lowered. 2) Legal Recourse Rights: STRC is a corporate preferred stock. In a bankruptcy scenario, STRC holders have a legal claim on the company's remaining assets (with a $100 per share liquidation preference), providing a fundamental floor for its value, unlike UST which had zero collateral and could go to zero.

QAccording to the article, what is the most critical factor for the sustainability of MicroStrategy's capital structure?

AThe most critical factor is its ongoing ability to raise capital. The structure relies on continuous financing (via ATM equity sales, issuing new preferred shares like STRC, or convertible bonds) to cover the substantial annual interest and dividend payments (approx. $1.71 billion). This financing ability is heavily dependent on market confidence in Bitcoin's long-term appreciation and in MicroStrategy's ability to add value beyond simple holding. If this confidence erodes and financing dries up, the company must rely on its dollar reserves or sell BTC, which carries significant negative market sentiment risks.

QWhat specific condition must be met for MicroStrategy to effectively use ATM (At-The-Market) issuance of its common stock to strengthen its financial position?

AFor ATM issuance of MSTR common stock to be effective in increasing the Bitcoin-per-share (BPS) metric, the mNAV (market-adjusted Net Asset Value) must be greater than 1.22. When mNAV is above this threshold, issuing new shares at a premium to the underlying Bitcoin value actually accretes value per share. If mNAV falls below 1.22, issuing new equity would be dilutive to BPS and therefore counterproductive.

QWhy does the article identify the next six months as a critical period for MicroStrategy's strategy?

AThe next six months are critical due to a confluence of two timelines: 1) Financial Runway: MicroStrategy's current dollar reserves ($900 million) are only sufficient to cover its annual interest and dividend obligations for approximately 6.3 months without additional financing. 2) Market Cycle: The article references the Bitcoin four-year cycle theory, suggesting a potential market bottom could occur in the second half of the year. Therefore, the company must navigate this period of high financial obligation with limited reserves, aiming to 'healthily deleverage' and restart its capital engine before its reserves run out and (hopefully) as the market begins to recover.

Related Reads

STAR 50 Soars 10.73%, Why Did A-Shares Stage a "V-Shaped Reversal"?

After a prolonged decline, the Chinese A-share market staged a strong rally on July 21. The STAR 50 index surged 10.73%, its largest single-day gain in nearly a year, leading a broad-based "V-shaped" reversal. The Shanghai Composite Index rose 1.79%, the Shenzhen Component Index gained 4.81%, and the ChiNext Index jumped 7.05%. Total market turnover reached 2.97 trillion yuan, an increase of 256.1 billion yuan from the previous session, with over 3,100 stocks advancing. The semiconductor sector spearheaded the rebound, with related ETFs posting significant gains. Analysts attribute the surge to three converging factors. First, coordinated capital inflows from "national team" institutions, insurance funds, listed company buybacks, and fund house self-purchases have bolstered market liquidity and confidence. Second, supportive policy signals, including commitments from regulators to ensure stable market operations, provided a favorable backdrop. Third, a stabilization and recovery in overseas markets, notably South Korea, created a positive external environment. Institutions suggest the most severe panic selling phase for the tech sector has likely passed, following a significant digestion of crowded positions and leveraged funds. While short-term volatility may persist, the medium to long-term outlook remains underpinned by enduring trends like AI computing demand expansion and semiconductor localization. The market's focus now shifts to the sustainability of supportive fund flows, earnings reports, and upcoming catalysts from the global AI industry chain.

marsbit23m ago

STAR 50 Soars 10.73%, Why Did A-Shares Stage a "V-Shaped Reversal"?

marsbit23m ago

U.S. Tech Momentum Stocks Post Largest Single-Day Gain Ever, But Is the Plunge Over?

US tech momentum stocks staged a sharp rebound on Tuesday (July 21st). Morgan Stanley's TMT Momentum Factor surged over 12%, marking its largest single-day gain on record, exceeding even peaks from the 2000 dot-com bubble. Key momentum indices from Goldman Sachs also posted their strongest daily performances in years. The rally was led by semiconductors, with the Philadelphia Semiconductor Index jumping 4.6%. This rebound followed three consecutive down days and a cumulative 33% plunge in momentum stocks, one of the steepest drawdowns since the dot-com era. Analysts attribute the surge largely to a short squeeze. Heavy selling had pushed high-beta momentum stocks into deeply oversold territory, forcing many short sellers, particularly in Asia, to cover their positions, creating a self-reinforcing buying spiral. However, the rebound's internals appear weak. Trading volume was notably low, and advancing stocks still lagged decliners on the S&P 500, indicating a narrow, concentrated rally rather than broad market participation. Diverging views emerge on the outlook. BTIG warns the bounce has hit key resistance and recommends selling into strength, citing extreme volatility and historical parallels to past market tops. Conversely, Goldman Sachs and UBS believe the momentum unwind is nearing its end, suggesting it may be time to gradually add exposure, as positioning has been significantly reduced. They caution, however, that high volatility warrants a measured approach, potentially using defined-risk strategies. The upcoming earnings season, particularly reports from major tech firms like Alphabet, is seen as a critical test for the rally's sustainability. Simultaneously, bond markets flashed a warning, with yields rising partly due to spiking oil prices. Analysts note that if long-term Treasury yields break decisively higher, it could pose a significant headwind for equities, especially growth stocks.

marsbit30m ago

U.S. Tech Momentum Stocks Post Largest Single-Day Gain Ever, But Is the Plunge Over?

marsbit30m ago

U.S. Tech Momentum Stocks Record Largest Single-Day Gain Ever, but Has the Rout Ended?

U.S. tech momentum stocks staged a dramatic rebound on Tuesday, July 21st. Key momentum indices like the Morgan Stanley TMT Momentum Factor and Goldman Sachs' High Beta Momentum Long Index posted historic or near-historic single-day gains, fueled largely by semiconductor stocks. This sharp rally followed a severe three-day sell-off that saw momentum stocks plunge 33%, marking one of the steepest pullbacks since the dot-com bubble. Analysts attribute the bounce primarily to a short squeeze, as forced covering from over-leveraged traders, particularly in Asia, created a buying spiral. However, the rally's health is questioned due to weak market breadth—overall trading volume was low, and decliners outnumbered advancers in the S&P 500 despite the index's gain—suggesting a narrow, concentrated surge rather than broad recovery. Opinions on the sustainability diverge. BTIG strategists warn the rebound has hit key resistance levels, citing extreme volatility and historic stock dispersion as signs of an ongoing broader correction, and recommend selling into strength. Conversely, Goldman Sachs and UBS view the aggressive momentum unwinding as nearing its end, noting reduced positioning and a lack of new fundamental catalysts. They suggest the sell-off presents a selective opportunity to add exposure, albeit cautiously and gradually using defined-risk strategies. The immediate trajectory hinges on the ongoing earnings season, with market focus on Alphabet's capital expenditure guidance for AI investment clarity. Meanwhile, bond markets present a risk, with rising Treasury yields—potentially heading toward 5.5%—and widening credit spreads for mega-cap tech companies posing a threat to equity valuations. The combination of technical factors, earnings results, and macro conditions leaves the durability of the rebound in doubt.

链捕手33m ago

U.S. Tech Momentum Stocks Record Largest Single-Day Gain Ever, but Has the Rout Ended?

链捕手33m ago

Long-Divided Must Unite, Long-United Must Divide: When L1 Becomes Its Own Rollup, What Is Ethereum's Endgame?

"The Inevitable Cycle: When L1 Becomes Its Own Rollup – What is Ethereum's Endgame?" For years, the Ethereum community grappled with concerns that L2s were fragmenting the ecosystem and eroding L1's value. While L2s provided cheaper execution, they also splintered liquidity and the unified user experience of a single chain. This has prompted a fundamental reassessment of the relationship between L1 and L2. Ethereum's roadmap is evolving. The "Scale" initiative merges L1 and L2 expansion into a holistic framework. L1 itself is advancing with higher gas limits, statelessness, and zkEVM verification, no longer content to be just a low-throughput settlement layer. Consequently, the primary value proposition of L2s is shifting from merely providing cheap blockspace to offering L1 cannot easily provide: application-specific optimizations, privacy features, and flexible governance models. L2s are becoming a spectrum of execution environments with varying degrees of security inheritance from Ethereum. A critical challenge in this multi-chain future is interoperability. The vision is to make Ethereum "feel like one chain again." This relies on advancements in native account abstraction (like EIP-7702) and intent-based architectures (Open Intents Framework), where users declare desired outcomes, and solvers handle the complex cross-chain execution. Furthermore, shortening Ethereum's finality time from minutes to seconds is crucial, as it underpins trust between chains for bridges, stablecoins, and cross-chain applications. Perhaps the most provocative idea is that Ethereum L1 itself could become a form of "its own Rollup." As zkEVM and proof systems mature, high-performance nodes could execute transactions and generate validity proofs. Regular validators would then verify these proofs instead of re-executing all transactions. This blurs the traditional L1/L2 hierarchy, making "Rollup" more of a general execution-verification architecture. Native Rollup aims to integrate L2 validation more directly into the Ethereum protocol, allowing L2s to inherit L1's security more fully and move away from reliance on security councils. In the end, L2s are not destined to replace L1 or be made obsolete by it. The likely future is a unified system where diverse execution environments—each optimized for specific use cases like DeFi, gaming, or privacy—coexist. They will share a common foundation of security, liquidity, and verifiable state, seamlessly connected to restore a cohesive user experience. The next phase for Ethereum is not just about scaling through separation, but about intelligently reintegrating what was separated back into a coherent whole.

链捕手49m ago

Long-Divided Must Unite, Long-United Must Divide: When L1 Becomes Its Own Rollup, What Is Ethereum's Endgame?

链捕手49m ago

Trading

Spot
活动图片