Bitcoin Price Only Inches Away From Historical Bottom, Here’s The Level

AmbcryptoPublished on 2026-03-19Last updated on 2026-03-19

Abstract

Bitcoin can either start a new rally from here or reverse from here to retest $60,000 again before embarking on the rally.

Bitcoin is approaching a price level that has, without exception, led to the absolute bottom of every major bear market cycle in its history, and on-chain indicators show the moment of maximum opportunity may be drawing near for Bitcoin traders to capitalize on an incoming rally.

Bitcoin’s Historical Bottom At The 200-Week Moving Average

One technical level has held with incredible consistency throughout more than a decade of Bitcoin’s price history. This technical level is, in fact, the 200-week moving average. Bitcoin has never closed a weekly candle meaningfully below the long-term 200-week moving average, even during the pandemic-era crash of 2020 and the cycle bottom of late 2022, and has, in each instance, staged a powerful recovery every time it touched it.

The chart below shows Bitcoin moving in cycles, with each correction eventually cooling off near this long-term average before the beginning of a rally phase. Notably, the Bitcoin price action followed this same script in 2015, 2018, and 2022. Each time, extended drawdowns ended only after Bitcoin touched or briefly dipped below the 200-week moving average.

The chart also adds a 14-month Relative Strength Index reading directly onto price via a color-coded dot system. Red dots highlight overbought euphoria around cycle peaks, while blue dots signal deeply oversold conditions consistent with capitulation bottoms. Green and yellow dots, on the other hand, populate the recovery and mid-cycle expansion phases in between.

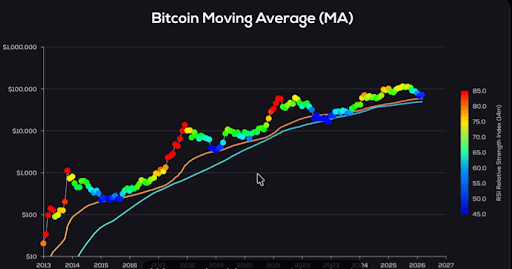
Source: Chart from Coinvo on X

At present, BTC is trading just above that same line once again, placing the price in a position that has historically led to a bottom. Blue dots are once again beginning to form along the current price trajectory. This is precisely the RSI pattern that appeared at the 2015 bottom, the 2018-2019 bottom, and the 2022 bottom.

If history holds, then the distance between the current price and a confirmed cycle bottom may be very small indeed. Bitcoin can either start a new rally from here or reverse from here to retest $60,000 again before embarking on the rally.

A Larger Breakout Structure Points To $500,000

According to crypto analyst Coinvo Trading, a multi-year Cup and Handle formation is playing out on Bitcoin’s monthly chart. The bullish structure stretches across several years, with the rounded cup forming from mid-2021 to early 2025. The breakout of neckline resistance occurred in 2025, and the handle stage of the pattern has been forming since then.

As it stands, BTC is now approaching the final stages of this formation. Coinvo Trading projected the measured price target for this breakout at $505,761, which is derived from projecting the full depth of the cup formation above the breakout level. “Once it breaks, you’re too late,” the analyst warned.

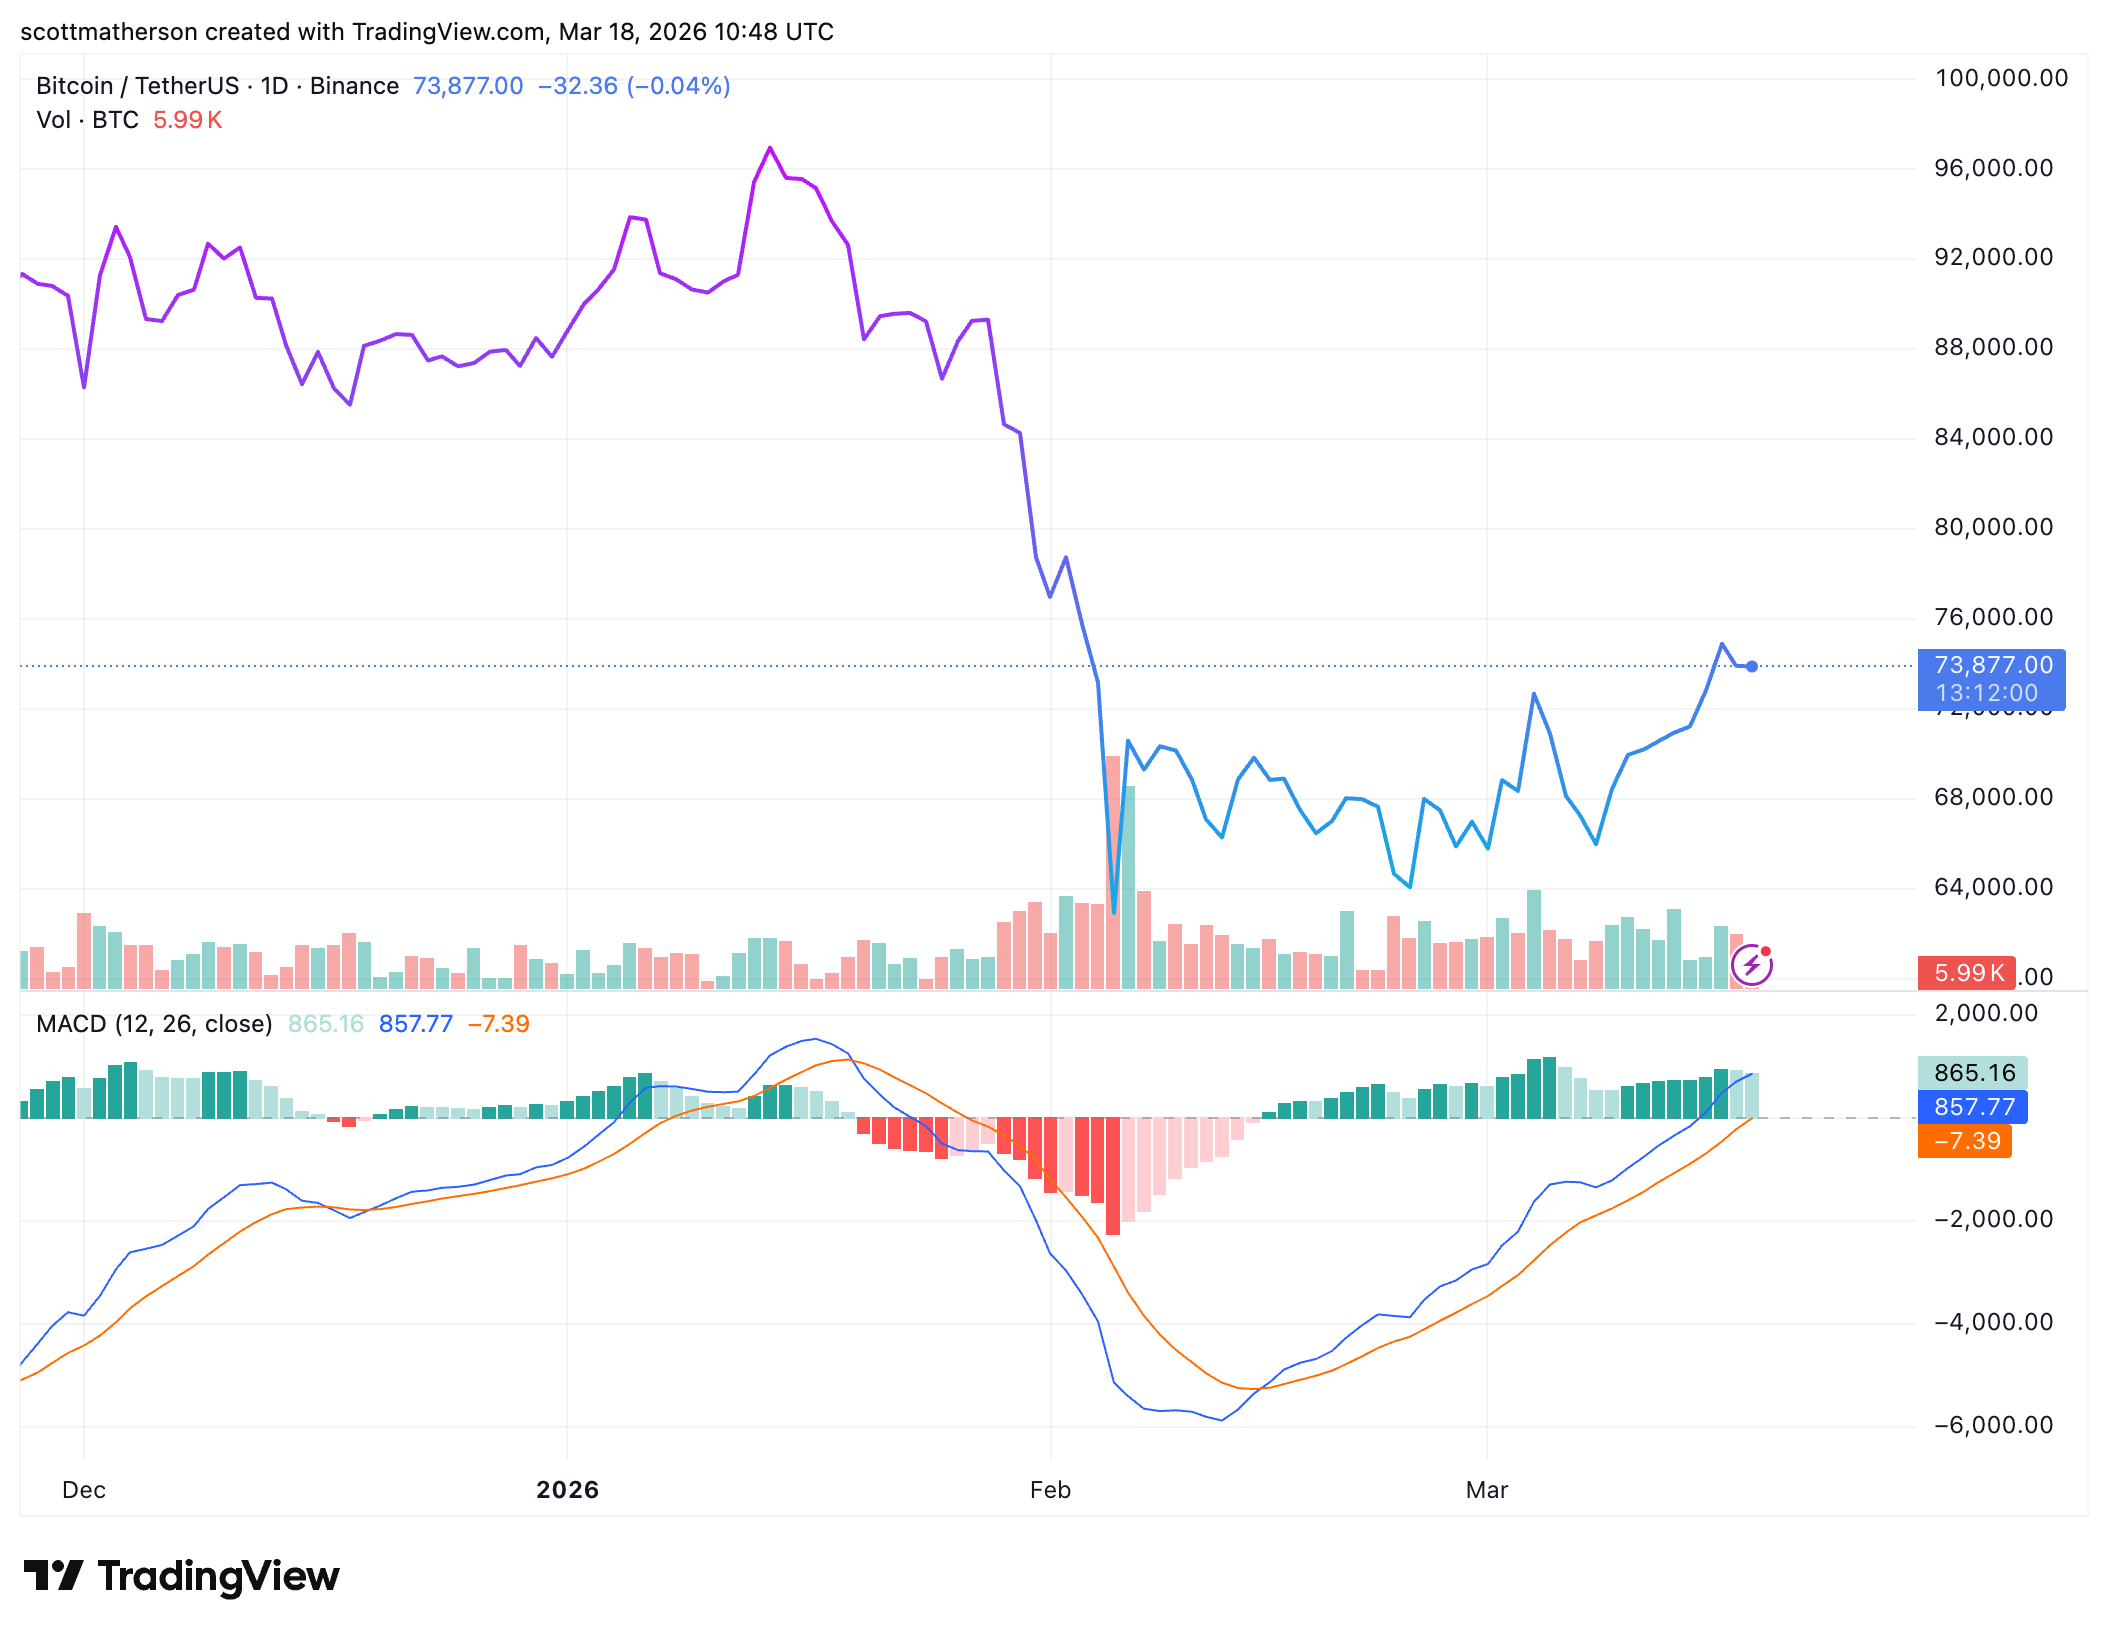
BTC trading at $73,877 on the 1D chart | Source: BTCUSDT on Tradingview.com

Related Questions

QWhat key technical level has historically marked the bottom of Bitcoin's major bear market cycles?

AThe 200-week moving average has historically marked the bottom of Bitcoin's major bear market cycles, with the price never closing meaningfully below it on a weekly candle.

QAccording to the article, what does the appearance of blue dots in the RSI system indicate for Bitcoin?

ABlue dots in the RSI system indicate deeply oversold conditions consistent with capitulation bottoms, which have appeared at major cycle lows like in 2015, 2018-2019, and 2022.

QWhat is the analyst Coinvo Trading's projected price target for Bitcoin based on the Cup and Handle formation?

ACoinvo Trading's projected price target for Bitcoin based on the multi-year Cup and Handle formation is $505,761.

QHow does the article describe Bitcoin's current position relative to the 200-week moving average?

ABitcoin is currently trading just above the 200-week moving average, a position that has historically led to a cycle bottom.

QWhat are the two potential price actions Bitcoin might take from its current position near the 200-week MA, according to the article?

ABitcoin could either start a new rally from its current position or reverse to retest the $60,000 level before beginning a rally.

Related Reads

Earning Millions Daily in a Sluggish Market: Is Pump.fun's Revenue Real?

Despite a perceived market downturn, pump.fun remains a top revenue-generating crypto-native application, ranking fourth in earnings behind only Tether, Circle, and Hyperliquid across various timeframes. Its daily income consistently exceeds one million USD, derived from three primary sources: a 0.95% protocol fee on bonding curve transactions, a token’s "graduation" fees on Pumpswap, and revenue from its acquired multi-chain trading platform, Terminal (formerly Padre). On-chain analysis confirms the bonding curve revenue is authentic, with no evidence of fake transfers or data manipulation. However, questions arise about the organic nature of this activity. While Solana’s daily active addresses range between 1.2-2.2 million, pump.fun sees about 150,000, with roughly 30,000 new tokens deployed daily. Data suggests a significant portion of tokens are launched by a small group of sophisticated deployers, not organic users. Moreover, research indicates that 98.6% of tokens on pump.fun are pump-and-dump schemes, turning the platform into a low-cost, high-efficiency "casino" where deployers profit at the expense of retail investors. Despite pump.fun using nearly all its income to buy back its native token, $PUMP, the price continues to fall due to a lack of buyer confidence and organic demand. The fundamental issue is not revenue authenticity but the platform's role in facilitating a predatory ecosystem, making it unattractive to long-term institutional investment.

marsbit33m ago

Earning Millions Daily in a Sluggish Market: Is Pump.fun's Revenue Real?

marsbit33m ago

Gold Plunges for a Week, '1983 Great Sell-Off' Repeats, Middle East 'Selling Gold for Funds'?

Gold recorded its worst weekly decline in 43 years, echoing the historic 1983 sell-off. Spot gold fell for eight consecutive days, while silver dropped over 15%, with palladium and platinum also declining. The sell-off was triggered by escalating Middle East conflicts, which raised energy prices and reduced expectations for Fed rate cuts. Markets now price a 50% chance of a Fed hike by October. Higher inflation expectations and rising real interest rates diminished gold's appeal as a non-yielding asset. Additionally, tightening dollar liquidity, reflected in widening cross-currency basis swaps, intensified pressure on gold, often liquidated first during dollar shortages. Technical indicators worsened, with RSI falling below 30, triggering stop-losses and self-reinforcing selling. Gold ETFs saw outflows for three straight weeks, losing over 60 tons. The current situation parallels the 1983 crash when OPEC nations, facing falling oil revenue, sold gold reserves to raise cash, causing a rapid price collapse. Then, as now, Middle Eastern selling pressured gold, with impacts spreading across commodities. Despite a 4% year-to-date gain, stagflation risks are rising. Goldman Sachs estimates energy price increases could reduce global growth by 0.3% and raise inflation by 0.5-0.6%. Gold's future depends on real interest rates and geopolitical developments—continued conflict may sustain pressure, while de-escalation could revive safe-haven demand.

marsbit42m ago

Gold Plunges for a Week, '1983 Great Sell-Off' Repeats, Middle East 'Selling Gold for Funds'?

marsbit42m ago

Trading

Spot
Futures

Hot Articles

What is $BITCOIN

DIGITAL GOLD ($BITCOIN): A Comprehensive Analysis Introduction to DIGITAL GOLD ($BITCOIN) DIGITAL GOLD ($BITCOIN) is a blockchain-based project operating on the Solana network, which aims to combine the characteristics of traditional precious metals with the innovation of decentralized technologies. While it shares a name with Bitcoin, often referred to as “digital gold” due to its perception as a store of value, DIGITAL GOLD is a separate token designed to create a unique ecosystem within the Web3 landscape. Its goal is to position itself as a viable alternative digital asset, although specifics regarding its applications and functionalities are still developing. What is DIGITAL GOLD ($BITCOIN)? DIGITAL GOLD ($BITCOIN) is a cryptocurrency token explicitly designed for use on the Solana blockchain. In contrast to Bitcoin, which provides a widely recognized value storage role, this token appears to focus on broader applications and characteristics. Notable aspects include: Blockchain Infrastructure: The token is built on the Solana blockchain, known for its capacity to handle high-speed and low-cost transactions. Supply Dynamics: DIGITAL GOLD has a maximum supply capped at 100 quadrillion tokens (100P $BITCOIN), although details regarding its circulating supply are currently undisclosed. Utility: While precise functionalities are not explicitly outlined, there are indications that the token could be utilized for various applications, potentially involving decentralized applications (dApps) or asset tokenization strategies. Who is the Creator of DIGITAL GOLD ($BITCOIN)? At present, the identity of the creators and development team behind DIGITAL GOLD ($BITCOIN) remains unknown. This situation is typical among many innovative projects within the blockchain space, particularly those aligning with decentralized finance and meme coin phenomena. While such anonymity may foster a community-driven culture, it intensifies concerns about governance and accountability. Who are the Investors of DIGITAL GOLD ($BITCOIN)? The available information indicates that DIGITAL GOLD ($BITCOIN) does not have any known institutional backers or prominent venture capital investments. The project seems to operate on a peer-to-peer model focused on community support and adoption rather than traditional funding routes. Its activity and liquidity are primarily situated on decentralized exchanges (DEXs), such as PumpSwap, rather than established centralized trading platforms, further highlighting its grassroots approach. How DIGITAL GOLD ($BITCOIN) Works The operational mechanics of DIGITAL GOLD ($BITCOIN) can be elaborated on based on its blockchain design and network attributes: Consensus Mechanism: By leveraging Solana’s unique proof-of-history (PoH) combined with a proof-of-stake (PoS) model, the project ensures efficient transaction validation contributing to the network's high performance. Tokenomics: While specific deflationary mechanisms have not been extensively detailed, the vast maximum token supply implies that it may cater to microtransactions or niche use cases that are still to be defined. Interoperability: There exists the potential for integration with Solana’s broader ecosystem, including various decentralized finance (DeFi) platforms. However, the details regarding specific integrations remain unspecified. Timeline of Key Events Here is a timeline that highlights significant milestones concerning DIGITAL GOLD ($BITCOIN): 2023: The initial deployment of the token occurs on the Solana blockchain, marked by its contract address. 2024: DIGITAL GOLD gains visibility as it becomes available for trading on decentralized exchanges like PumpSwap, allowing users to trade it against SOL. 2025: The project witnesses sporadic trading activity and potential interest in community-led engagements, although no noteworthy partnerships or technical advancements have been documented as of yet. Critical Analysis Strengths Scalability: The underlying Solana infrastructure supports high transaction volumes, which could enhance the utility of $BITCOIN in various transaction scenarios. Accessibility: The potential low trading price per token could attract retail investors, facilitating wider participation due to fractional ownership opportunities. Risks Lack of Transparency: The absence of publicly known backers, developers, or an audit process may yield skepticism regarding the project's sustainability and trustworthiness. Market Volatility: The trading activity is heavily reliant on speculative behavior, which can result in significant price volatility and uncertainty for investors. Conclusion DIGITAL GOLD ($BITCOIN) emerges as an intriguing yet ambiguous project within the rapidly evolving Solana ecosystem. While it attempts to leverage the “digital gold” narrative, its departure from Bitcoin's established role as a store of value underscores the need for a clearer differentiation of its intended utility and governance structure. Future acceptance and adoption will likely depend on addressing the current opacity and defining its operational and economic strategies more explicitly. Note: This report encompasses synthesised information available as of October 2023, and developments may have transpired beyond the research period.

363 Total ViewsPublished 2025.05.13Updated 2025.05.13

What is $BITCOIN

Discussions

Welcome to the HTX Community. Here, you can stay informed about the latest platform developments and gain access to professional market insights. Users' opinions on the price of BTC (BTC) are presented below.

活动图片