Bitcoin Supply In Loss Turns Up: A Potential Bear Market Signal

bitcoinistPublished on 2026-01-29Last updated on 2026-01-29

Abstract

Bitcoin is struggling to reclaim the $90,000 level amid market uncertainty and consolidation, with analysts divided on the outlook. A CryptoQuant report indicates a concerning shift: Bitcoin’s Supply in Loss (%) has started rising again, a pattern historically associated with early bear markets. This metric suggests losses are spreading from short-term to long-term holders, signaling a potential change in market structure toward prolonged downturns rather than a temporary correction. Although current levels are below historical capitulation thresholds, the trend change aligns with past cycles where true bottoms formed only after broad distress. Price action remains constrained below key moving averages, with resistance near $94,000–$96,000. A break below $85,000 could renew downside pressure, while holding above $92,000 may improve short-term structure. The overall signal suggests risk remains skewed downward until loss expansion stabilizes or reaches extreme levels.

Bitcoin is trying to reclaim the $90,000 level as the market remains trapped in a phase of uncertainty and consolidation. After months of elevated volatility, price action has narrowed, reflecting hesitation from both buyers and sellers. This indecision has fueled a growing divide among analysts.

Some argue that Bitcoin is merely digesting prior gains, while others warn that the current structure points toward a continuation of the downtrend and a potentially bearish 2026. The lack of sustained upside momentum above key resistance levels has reinforced these concerns, especially as macro conditions remain fragile and risk appetite is uneven across global markets.

Adding weight to the cautious outlook, a recent CryptoQuant report highlights a notable shift in on-chain dynamics. Bitcoin’s Supply in Loss (%) has begun to trend upward again, a development that historically aligns with the early stages of bear markets.

In past cycles, this metric turned higher as price weakness persisted, signaling that losses were no longer confined to short-term traders but were gradually spreading to longer-term holders. This transition often marked a change in market psychology, from temporary pullbacks to more structural downturns.

In previous market cycles—2014, 2018, and 2022—the behavior of Bitcoin’s Supply in Loss (%) followed a consistent pattern. The metric began to trend upward well before the market reached its final bottom, while price continued to grind lower or remain under pressure. In each case, this early increase did not mark an immediate reversal.

Bitcoin Supply in Loss | Source: CryptoQuant

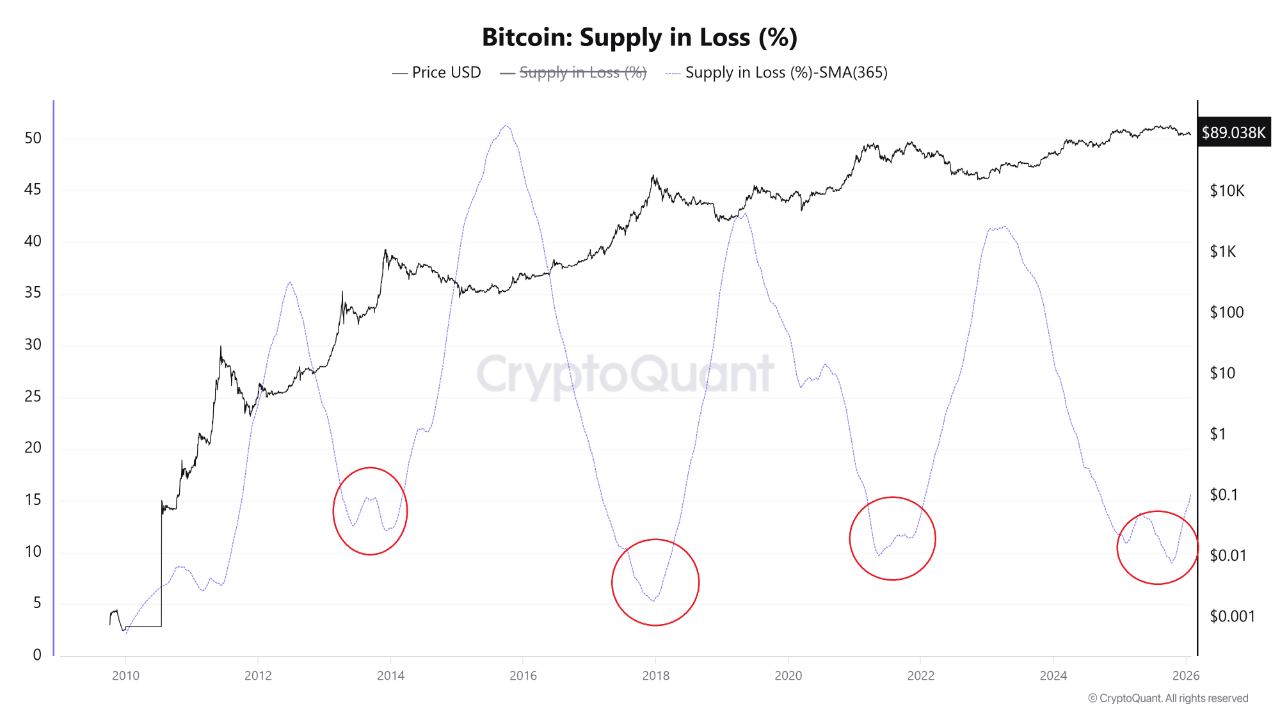
Instead, it reflected a gradual expansion of unrealized losses across the market, as downside pressure extended beyond short-term traders and increasingly affected longer-term holders. True cycle bottoms only formed later, after Supply in Loss had risen substantially and broad capitulation had taken place.

At present, Supply in Loss remains well below those historical capitulation thresholds. From a purely quantitative perspective, this suggests the market has not yet reached a point of widespread distress. However, the importance lies less in the absolute level and more in the change in direction. The recent uptick indicates that losses are beginning to spread again, a condition that has historically coincided with transitions toward more defensive market regimes.

This shift challenges the narrative that the current weakness is merely a corrective pause within a broader bull trend. Instead, it raises the possibility that Bitcoin is entering a bear market structure, characterized by prolonged consolidation, repeated downside tests, and delayed recovery.

While this does not preclude short-term rebounds, the on-chain signal suggests that risks remain skewed to the downside until loss expansion either stabilizes or accelerates toward historical extremes, where durable bottoms have previously formed.

Bitcoin Testing Key Resistance Level

Bitcoin price action on this daily chart reflects a market stuck in consolidation after a sharp structural breakdown. Following the rejection near the $125,000 region in October, BTC entered a clear downtrend, marked by lower highs and lower lows. The aggressive sell-off into late November pushed price below the 50-day and 100-day moving averages, confirming a loss of bullish momentum and shifting market control toward sellers.

BTC consolidates below key level | Source: BTCUSDT chart on TradingView

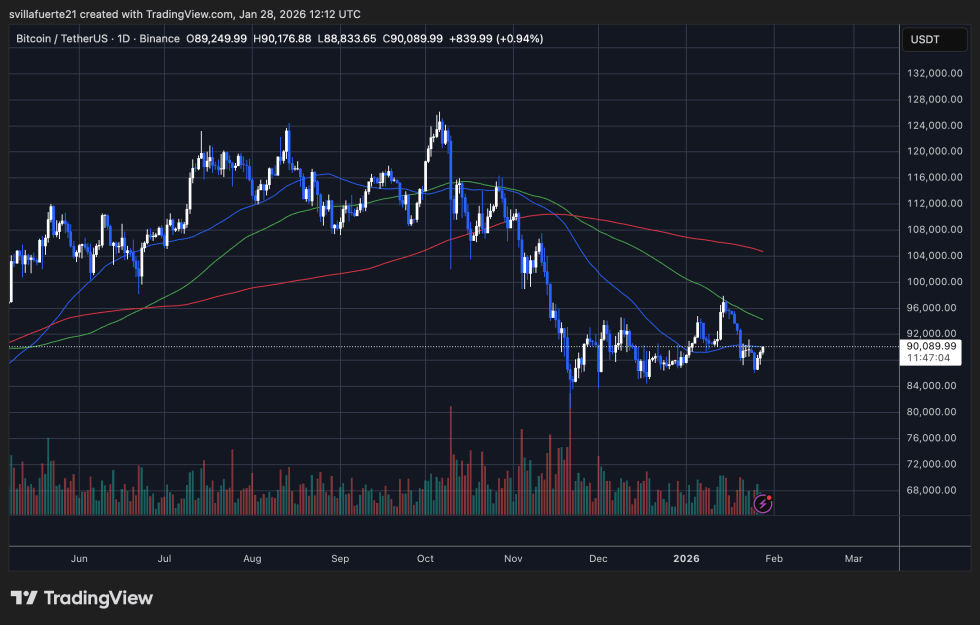
Since early December, Bitcoin has stabilized between roughly $85,000 and $92,000, forming a sideways range rather than an immediate continuation lower. This suggests that forced selling pressure has eased, but conviction remains limited.

The 50-day moving average (blue) continues to slope downward and currently caps upside attempts, while the 100-day (green) also trends lower, reinforcing overhead resistance in the $94,000–$96,000 zone. The 200-day moving average (red) remains well below the price near the mid-$70,000s, indicating that the broader cycle has not fully reset, despite the correction.

Selling volume peaked during the November breakdown but has since declined, signaling reduced participation rather than renewed demand. As long as BTC remains below the declining 50-day and 100-day averages, rallies are likely corrective. A sustained hold above $92,000 would be needed to improve short-term structure, while a breakdown below $85,000 would reopen downside risk.

Featured image from ChatGPT, chart from TradingView.com

Related Questions

QWhat does the recent uptick in Bitcoin's Supply in Loss (%) indicate, according to the CryptoQuant report?

AThe recent uptick in Bitcoin's Supply in Loss (%) indicates that losses are beginning to spread again, a development that historically aligns with the early stages of bear markets and a transition toward more defensive market regimes.

QBased on historical cycles, what did an increase in the Supply in Loss metric NOT signal?

ABased on historical cycles, an increase in the Supply in Loss metric did not signal an immediate market reversal. Instead, it reflected a gradual expansion of unrealized losses, and true cycle bottoms only formed later after broad capitulation had taken place.

QWhat key price level does Bitcoin need to hold above to improve its short-term structure, according to the technical analysis?

AAccording to the technical analysis, Bitcoin needs to sustain a hold above the $92,000 level to improve its short-term structure.

QHow does the article describe the current state of the Bitcoin market in terms of participant conviction?

AThe article describes the current state of the market as one of hesitation and indecision, where forced selling pressure has eased but conviction remains limited, with reduced participation from both buyers and sellers.

QWhat is the significance of the 50-day and 100-day moving averages for Bitcoin price in the current market setup?

AIn the current market setup, the 50-day and 100-day moving averages are sloping downward and act as overhead resistance, capping upside attempts. As long as the price remains below them, rallies are likely to be corrective rather than trend-changing.

Related Reads

Trading

Spot
Futures

Hot Articles

What is $BITCOIN

DIGITAL GOLD ($BITCOIN): A Comprehensive Analysis Introduction to DIGITAL GOLD ($BITCOIN) DIGITAL GOLD ($BITCOIN) is a blockchain-based project operating on the Solana network, which aims to combine the characteristics of traditional precious metals with the innovation of decentralized technologies. While it shares a name with Bitcoin, often referred to as “digital gold” due to its perception as a store of value, DIGITAL GOLD is a separate token designed to create a unique ecosystem within the Web3 landscape. Its goal is to position itself as a viable alternative digital asset, although specifics regarding its applications and functionalities are still developing. What is DIGITAL GOLD ($BITCOIN)? DIGITAL GOLD ($BITCOIN) is a cryptocurrency token explicitly designed for use on the Solana blockchain. In contrast to Bitcoin, which provides a widely recognized value storage role, this token appears to focus on broader applications and characteristics. Notable aspects include: Blockchain Infrastructure: The token is built on the Solana blockchain, known for its capacity to handle high-speed and low-cost transactions. Supply Dynamics: DIGITAL GOLD has a maximum supply capped at 100 quadrillion tokens (100P $BITCOIN), although details regarding its circulating supply are currently undisclosed. Utility: While precise functionalities are not explicitly outlined, there are indications that the token could be utilized for various applications, potentially involving decentralized applications (dApps) or asset tokenization strategies. Who is the Creator of DIGITAL GOLD ($BITCOIN)? At present, the identity of the creators and development team behind DIGITAL GOLD ($BITCOIN) remains unknown. This situation is typical among many innovative projects within the blockchain space, particularly those aligning with decentralized finance and meme coin phenomena. While such anonymity may foster a community-driven culture, it intensifies concerns about governance and accountability. Who are the Investors of DIGITAL GOLD ($BITCOIN)? The available information indicates that DIGITAL GOLD ($BITCOIN) does not have any known institutional backers or prominent venture capital investments. The project seems to operate on a peer-to-peer model focused on community support and adoption rather than traditional funding routes. Its activity and liquidity are primarily situated on decentralized exchanges (DEXs), such as PumpSwap, rather than established centralized trading platforms, further highlighting its grassroots approach. How DIGITAL GOLD ($BITCOIN) Works The operational mechanics of DIGITAL GOLD ($BITCOIN) can be elaborated on based on its blockchain design and network attributes: Consensus Mechanism: By leveraging Solana’s unique proof-of-history (PoH) combined with a proof-of-stake (PoS) model, the project ensures efficient transaction validation contributing to the network's high performance. Tokenomics: While specific deflationary mechanisms have not been extensively detailed, the vast maximum token supply implies that it may cater to microtransactions or niche use cases that are still to be defined. Interoperability: There exists the potential for integration with Solana’s broader ecosystem, including various decentralized finance (DeFi) platforms. However, the details regarding specific integrations remain unspecified. Timeline of Key Events Here is a timeline that highlights significant milestones concerning DIGITAL GOLD ($BITCOIN): 2023: The initial deployment of the token occurs on the Solana blockchain, marked by its contract address. 2024: DIGITAL GOLD gains visibility as it becomes available for trading on decentralized exchanges like PumpSwap, allowing users to trade it against SOL. 2025: The project witnesses sporadic trading activity and potential interest in community-led engagements, although no noteworthy partnerships or technical advancements have been documented as of yet. Critical Analysis Strengths Scalability: The underlying Solana infrastructure supports high transaction volumes, which could enhance the utility of $BITCOIN in various transaction scenarios. Accessibility: The potential low trading price per token could attract retail investors, facilitating wider participation due to fractional ownership opportunities. Risks Lack of Transparency: The absence of publicly known backers, developers, or an audit process may yield skepticism regarding the project's sustainability and trustworthiness. Market Volatility: The trading activity is heavily reliant on speculative behavior, which can result in significant price volatility and uncertainty for investors. Conclusion DIGITAL GOLD ($BITCOIN) emerges as an intriguing yet ambiguous project within the rapidly evolving Solana ecosystem. While it attempts to leverage the “digital gold” narrative, its departure from Bitcoin's established role as a store of value underscores the need for a clearer differentiation of its intended utility and governance structure. Future acceptance and adoption will likely depend on addressing the current opacity and defining its operational and economic strategies more explicitly. Note: This report encompasses synthesised information available as of October 2023, and developments may have transpired beyond the research period.

363 Total ViewsPublished 2025.05.13Updated 2025.05.13

What is $BITCOIN

Discussions

Welcome to the HTX Community. Here, you can stay informed about the latest platform developments and gain access to professional market insights. Users' opinions on the price of BTC (BTC) are presented below.

活动图片