Bitcoin Price Just Entered The DCA Zone That Has Previously Triggered A 2,200% Rally To ATH

bitcoinistPublished on 2026-06-12Last updated on 2026-06-12

Abstract

Bitcoin's price has entered a long-term dollar-cost averaging (DCA) zone, a pattern reminiscent of previous market cycles that preceded massive rallies. Analysts note this zone appeared after the 2017 peak and again post-FTX collapse in 2022, periods characterized by peak fear and significant price declines, which ultimately led to recoveries of over 2,200% and 600%, respectively, to new all-time highs. Currently trading around $62,800, Bitcoin is testing this historical accumulation support. While bearish pressures from ETF outflows and on-chain metrics like a declining Realized Cap persist, this aligns with past cycles where the DCA zone formed amid pessimism before a major bullish reversal. The key question is whether Bitcoin can hold this structural support to validate the cycle comparison.

Bitcoin’s price action is no longer trading with a sense of euphoria, nor is it safely above the levels that kept bulls confident earlier in the year. Instead, the leading cryptocurrency has now moved into a DCA zone, which is a region that has appeared in past cycles when sentiment was at its lowest and long-term opportunity was quietly forming.

There are two sides to the pattern, and the bullish side says BTC now seems to be forming an opportunity for accumulation before another rally.

Bitcoin Returns To The Zone Where Fear Usually Peaks

Crypto analyst Ardizor noted on X that Bitcoin has now touched the same dollar-cost averaging zone that appeared before major recoveries in previous cycles. There’s also a familiar pattern going on with BTC right now: the market declares Bitcoin dead, the price enters the long-term DCA accumulation region, and the next rally eventually takes the cryptocurrency to a new all-time high.

The candlestick price chart, which is shown below, tracks BTC on the monthly timeframe and compares three major cycle structures. Back in 2019, Bitcoin’s price entered a depressed DCA accumulation area after the 2017 peak around $19,000, which dragged the price down by more than 83%. That zone later preceded the run to the 2021 all-time high around $69,000.
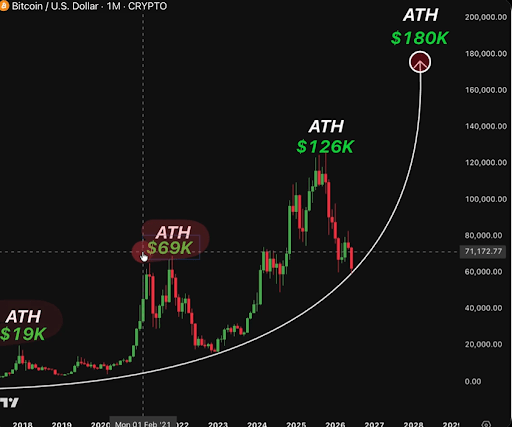
Source: Chart from Ardizor on X

The 2022 episode was shorter in duration but structurally identical. The FTX exchange collapse in November of that year produced a wave of forced selling, and Bitcoin fell to around $15,500 from its 2021 peak above $69,000.

However, BTC bulls eventually broke through the fear, and the best of accumulators were able to ride alongside an almost 600% rally above $100,000, and the cryptocurrency eventually rallied to a new high above $126,000 in October 2025.

Where Does Bitcoin Go From Here?

The question now is whether BTC can hold this DCA zone long enough for the cycle structure to turn bullish. At the time of writing, Bitcoin is trading at $62,800, which is still around the curved support shown on the monthly chart above. As long as BTC continues to respect that long-term structure, the comparison with the 2019 and 2022 accumulation phases will still make sense.

However, ETF flows and on-chain signals are adding bearish pressure to counter the bulls accumulating at this point. For instance, Bitcoin’s Realized Cap has declined by roughly $12 billion from its mid-May peak. Another analysis of Bitcoin’s PnL Index, which combines a few other data metrics, shows that Bitcoin has yet to reach a bottom, although it is currently in a transition phase.

However, that does not invalidate the DCA-zone argument. In fact, it may strengthen the comparison with past cycles. The 2019 and 2022 accumulation zones did not appear during calm conditions, but when liquidity was thin, and traders were still expecting another bottom.

BTC trading at $62,728 on the 1D chart | Source: BTCUSDT on Tradingview.com

Trending Cryptos

Related Questions

QWhat is the DCA zone mentioned in the article, and why is it significant for Bitcoin's price?

AThe DCA (Dollar-Cost Averaging) zone refers to a specific price region where Bitcoin has historically entered when market sentiment was low and long-term accumulation opportunities were forming. According to the article, entering this zone in past cycles (like 2019 and 2022) preceded major rallies to new all-time highs.

QAccording to the analyst Ardizor, what pattern does Bitcoin's price currently show?

AArdizor noted that Bitcoin has touched the same DCA accumulation zone that appeared before major recoveries in previous cycles. The pattern is: the market declares Bitcoin dead, the price enters this long-term DCA region, and the next rally eventually leads to a new all-time high.

QWhat were the outcomes after Bitcoin entered the DCA zone in the 2019 and 2022 cycles?

AIn 2019, after entering the DCA zone following the 2017 peak, Bitcoin later rallied to its 2021 all-time high of around $69,000. In 2022, after the FTX collapse drove Bitcoin into the DCA zone, it eventually rallied almost 600% above $100,000 and reached a new high above $126,000 in October 2025.

QWhat are some bearish pressures on Bitcoin's price mentioned in the article?

AThe article cites bearish pressures from ETF flows and on-chain signals. For example, Bitcoin's Realized Cap has declined by roughly $12 billion from its mid-May peak, and analysis of the PnL Index suggests Bitcoin has yet to reach a bottom, although it is in a transition phase.

QAt what price was Bitcoin trading at the time the article was written, and what key level was it near?

AAt the time of writing, Bitcoin was trading at $62,800. This price was around the curved long-term support level shown on the monthly chart, which defines the DCA accumulation zone discussed in the article.

Related Reads

HIP-3 Perpetual Futures Arbitrage in Action: SK Hynix ADR Premium Trading Opportunity

HIP-3 Perpetual Futures Arbitrage in Practice: The SK Hynix ADR Premium Trade Following its Nasdaq listing, a significant price gap emerged between SK Hynix's ADR (SKHY) and its underlying share (SKHX). During this period, the HIP-3 builder TradeXYZ launched perpetual futures markets for both on Hyperliquid. The divergent funding rates between these two markets offer a clear case study on the capabilities and limitations of stock perpetuals. The premium, which soared to 51% on July 14th, was primarily driven by closed arbitrage channels. The new ADR issuance did not involve depositing existing shares, and conversion between the underlying share and the ADR is not permitted until after July 29th. With strong US institutional demand facing constrained supply, the price gap widened. On Hyperliquid, the funding rates for SKHX and SKHY moved in opposite directions, revealing traders executing a pairs trade to bet on the premium narrowing—buying SKHX (underlying) and shorting SKHY (ADR). This highlights key insights: 1. **Ability to bypass traditional market friction:** The trade can be executed with USDC on a single platform, avoiding complexities like currency conversion, foreign accounts, and ADR borrowing. 2. **Missing tools to separate funding costs:** The trade inherently carries the cost of funding rate payments/receipts, as perpetuals reflect but do not force convergence between the two underlying indices. Instruments to hedge this variable cost are not yet available for HIP-3 stocks. 3. **Function as a leading indicator:** The SKHY pre-IPO market accurately predicted the Nasdaq opening price, and SKHX trades during KRX closures, providing price discovery. 4. **Inverse relationship with accessibility:** The SKHX perpetual, serving a market with fewer native hedging tools, sees much higher volume and sustained funding rates than the SKHY perpetual, which exists alongside a deep spot and options market. The focus now shifts to July 29th, when share conversion may partially open, though structural limits on creating new ADRs may persist. Regardless of the premium's path, Hyperliquid remains the primary venue to express a view on this spread via perpetual futures.

Foresight News20m ago

HIP-3 Perpetual Futures Arbitrage in Action: SK Hynix ADR Premium Trading Opportunity

Foresight News20m ago

AI Claims Erdős's $100 Bounty, Solves in One Page What a 44-Page Top Journal Paper Couldn't

An AI, in collaboration with a mathematician, has produced a one-page proof for a long-standing Erdős problem (#119), claiming the $100 bounty originally offered by Paul Erdős. The problem concerns the maximum modulus of polynomials with zeros on the unit circle. The new result, generated with the help of GPT-5.6 Sol and posted on the erdosproblems.com forum, is notably simpler than a famous 44-page proof by József Beck published in the Annals of Mathematics in 1991, which addressed a related but distinct part of the problem. Thomas Bloom, a mathematician and the maintainer of the Erdős problems website, stated that the AI's proof uses straightforward harmonic analysis techniques and contains "interesting ideas," suggesting the problem was less inherently difficult than previously believed. This follows other recent AI-assisted proofs, such as for the Cycle Double Cover conjecture. The development has sparked debate within the mathematical community. While some argue AI has hit a wall in pure mathematics, others point to incremental but genuine progress on tough problems, indicating that AI's relentless, non-intuitive exploration can uncover overlooked paths that human mathematicians might dismiss after initial failures. This event highlights a potential shift: some "open" problems may persist not due to sheer difficulty, but due to the limits of human patience in exploring all possible avenues.

marsbit22m ago

AI Claims Erdős's $100 Bounty, Solves in One Page What a 44-Page Top Journal Paper Couldn't

marsbit22m ago

1.2 Million in Line for Margin Calls: The Collapse of South Korea's National "Gamble" by Retail Investors

In July 2026, the South Korean stock market, fueled by a national "all-in" bet on semiconductor stocks, experienced a catastrophic meltdown. The KOSPI index plummeted from record highs, triggering seven market-wide trading halts in the first half of the year—more than half the total since the mechanism's inception in 2000. The crisis stemmed from the market's extreme concentration on two giants: Samsung Electronics and SK Hynix, which accounted for 60% of the KOSPI index. Amid an AI-driven boom, rampant retail speculation, particularly among young investors seeking to overcome high living costs and social immobility, led to a surge in leveraged trading. In a pivotal move, regulators allowed the launch of 2x leveraged ETFs tied solely to these two stocks in May 2026. This set the stage for disaster. When signs of an HBM chip glut emerged in July, prices for Samsung and SK Hynix fell. The leveraged ETFs' mandatory daily rebalancing mechanism forced them to sell shares aggressively to maintain their leverage ratios. This triggered a vicious cycle: ETF selling drove prices down further, which triggered margin calls and forced liquidations of retail investors' leveraged positions, leading to more selling. The market entered a self-reinforcing "death spiral" of cascading liquidations. The aftermath was devastating. Over 1.2 million retail margin accounts faced liquidation warnings, with an estimated 320,000 to 460,000 accounts completely wiped out, many left owing money to their brokers. Approximately 62% of these affected investors were in their 20s and 30s. Total losses from leveraged positions were estimated at around 2.15 trillion won (~$1.6 billion USD). Regulators later expressed regret for approving the high-risk ETFs, highlighting the dangers of financial innovation outpacing proper risk controls and investor protection. The episode serves as a stark warning: when market frenzy, structural fragility, and complex leverage products converge, the outcome can be a rapid and brutal wealth destruction, disproportionately impacting the most vulnerable participants.

marsbit1h ago

1.2 Million in Line for Margin Calls: The Collapse of South Korea's National "Gamble" by Retail Investors

marsbit1h ago

Trading

Spot

Hot Articles

What is $BITCOIN

DIGITAL GOLD ($BITCOIN): A Comprehensive Analysis Introduction to DIGITAL GOLD ($BITCOIN) DIGITAL GOLD ($BITCOIN) is a blockchain-based project operating on the Solana network, which aims to combine the characteristics of traditional precious metals with the innovation of decentralized technologies. While it shares a name with Bitcoin, often referred to as “digital gold” due to its perception as a store of value, DIGITAL GOLD is a separate token designed to create a unique ecosystem within the Web3 landscape. Its goal is to position itself as a viable alternative digital asset, although specifics regarding its applications and functionalities are still developing. What is DIGITAL GOLD ($BITCOIN)? DIGITAL GOLD ($BITCOIN) is a cryptocurrency token explicitly designed for use on the Solana blockchain. In contrast to Bitcoin, which provides a widely recognized value storage role, this token appears to focus on broader applications and characteristics. Notable aspects include: Blockchain Infrastructure: The token is built on the Solana blockchain, known for its capacity to handle high-speed and low-cost transactions. Supply Dynamics: DIGITAL GOLD has a maximum supply capped at 100 quadrillion tokens (100P $BITCOIN), although details regarding its circulating supply are currently undisclosed. Utility: While precise functionalities are not explicitly outlined, there are indications that the token could be utilized for various applications, potentially involving decentralized applications (dApps) or asset tokenization strategies. Who is the Creator of DIGITAL GOLD ($BITCOIN)? At present, the identity of the creators and development team behind DIGITAL GOLD ($BITCOIN) remains unknown. This situation is typical among many innovative projects within the blockchain space, particularly those aligning with decentralized finance and meme coin phenomena. While such anonymity may foster a community-driven culture, it intensifies concerns about governance and accountability. Who are the Investors of DIGITAL GOLD ($BITCOIN)? The available information indicates that DIGITAL GOLD ($BITCOIN) does not have any known institutional backers or prominent venture capital investments. The project seems to operate on a peer-to-peer model focused on community support and adoption rather than traditional funding routes. Its activity and liquidity are primarily situated on decentralized exchanges (DEXs), such as PumpSwap, rather than established centralized trading platforms, further highlighting its grassroots approach. How DIGITAL GOLD ($BITCOIN) Works The operational mechanics of DIGITAL GOLD ($BITCOIN) can be elaborated on based on its blockchain design and network attributes: Consensus Mechanism: By leveraging Solana’s unique proof-of-history (PoH) combined with a proof-of-stake (PoS) model, the project ensures efficient transaction validation contributing to the network's high performance. Tokenomics: While specific deflationary mechanisms have not been extensively detailed, the vast maximum token supply implies that it may cater to microtransactions or niche use cases that are still to be defined. Interoperability: There exists the potential for integration with Solana’s broader ecosystem, including various decentralized finance (DeFi) platforms. However, the details regarding specific integrations remain unspecified. Timeline of Key Events Here is a timeline that highlights significant milestones concerning DIGITAL GOLD ($BITCOIN): 2023: The initial deployment of the token occurs on the Solana blockchain, marked by its contract address. 2024: DIGITAL GOLD gains visibility as it becomes available for trading on decentralized exchanges like PumpSwap, allowing users to trade it against SOL. 2025: The project witnesses sporadic trading activity and potential interest in community-led engagements, although no noteworthy partnerships or technical advancements have been documented as of yet. Critical Analysis Strengths Scalability: The underlying Solana infrastructure supports high transaction volumes, which could enhance the utility of $BITCOIN in various transaction scenarios. Accessibility: The potential low trading price per token could attract retail investors, facilitating wider participation due to fractional ownership opportunities. Risks Lack of Transparency: The absence of publicly known backers, developers, or an audit process may yield skepticism regarding the project's sustainability and trustworthiness. Market Volatility: The trading activity is heavily reliant on speculative behavior, which can result in significant price volatility and uncertainty for investors. Conclusion DIGITAL GOLD ($BITCOIN) emerges as an intriguing yet ambiguous project within the rapidly evolving Solana ecosystem. While it attempts to leverage the “digital gold” narrative, its departure from Bitcoin's established role as a store of value underscores the need for a clearer differentiation of its intended utility and governance structure. Future acceptance and adoption will likely depend on addressing the current opacity and defining its operational and economic strategies more explicitly. Note: This report encompasses synthesised information available as of October 2023, and developments may have transpired beyond the research period.

942 Total ViewsPublished 2025.05.13Updated 2025.05.13

What is $BITCOIN

Discussions

Welcome to the HTX Community. Here, you can stay informed about the latest platform developments and gain access to professional market insights. Users' opinions on the price of BTC (BTC) are presented below.

活动图片